US30 | Countertrend Setup From Long-Term Fibonacci Target Zone
The Market Flow | Oct 27, 2025
Technical Overview
Weekly / Daily:
• Price has reached the 138.2% Fibonacci extension, aligning with the upper boundary of the long-term impulse zone.
• This region represents a potential profit-taking area within an extended expansion phase.
• The daily structure completed an impulse to the 161.8% Fibonacci target.
• Market currently trades inside a high-probability reaction zone, suggesting risk of corrective flow.
H4:
• Price action shows initial hesitation beneath the prior breakout.
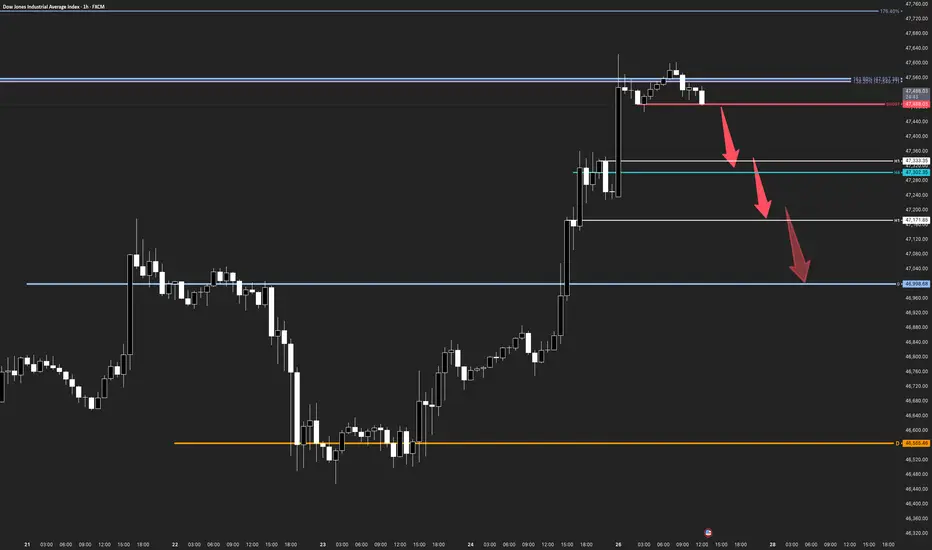
• Intermediate structural support rests near 47,330–47,200, representing the first countertrend target.
H1:
• A defined trigger = 47,488 (red SHORT level) marks potential short confirmation if broken with a 1–2–3 sequence on M15.
• Below this level, the path → 47,333 → 47,171 → 46,998 aligns with visible breakout retests.
Trade Structure & Levels
• Bias: Bearish countertrend short below 47,488
• Trigger = 47,488
• Invalidation = 47,580 (H1 structure high)
• Path → 47,333 → 47,171 → 46,998
• Phase: Countertrend within extended impulse reaching long-term target zone
Risk & Event Context
• Long-term momentum remains bullish, but exhaustion signals at key Fibonacci confluence may induce a corrective phase.
• Watch for volatility spikes near macro releases or equity session opens that could accelerate profit-taking.
Conclusion
US30 sits within its long-term Fibonacci target zone. A confirmed lower-timeframe trigger below 47,488 would validate a short-term countertrend move toward daily breakout levels before broader structure reassessment.
Technical Overview
Weekly / Daily:
• Price has reached the 138.2% Fibonacci extension, aligning with the upper boundary of the long-term impulse zone.
• This region represents a potential profit-taking area within an extended expansion phase.
• The daily structure completed an impulse to the 161.8% Fibonacci target.
• Market currently trades inside a high-probability reaction zone, suggesting risk of corrective flow.
H4:
• Price action shows initial hesitation beneath the prior breakout.
• Intermediate structural support rests near 47,330–47,200, representing the first countertrend target.
H1:
• A defined trigger = 47,488 (red SHORT level) marks potential short confirmation if broken with a 1–2–3 sequence on M15.
• Below this level, the path → 47,333 → 47,171 → 46,998 aligns with visible breakout retests.
Trade Structure & Levels
• Bias: Bearish countertrend short below 47,488
• Trigger = 47,488
• Invalidation = 47,580 (H1 structure high)
• Path → 47,333 → 47,171 → 46,998
• Phase: Countertrend within extended impulse reaching long-term target zone
Risk & Event Context
• Long-term momentum remains bullish, but exhaustion signals at key Fibonacci confluence may induce a corrective phase.
• Watch for volatility spikes near macro releases or equity session opens that could accelerate profit-taking.
Conclusion
US30 sits within its long-term Fibonacci target zone. A confirmed lower-timeframe trigger below 47,488 would validate a short-term countertrend move toward daily breakout levels before broader structure reassessment.
Note
For countertrend trades, it's worth to wait for the market open, and we now have a H1 invalidation level at the H1 pivot (orange).Day trader capitalizing on the expansion phases of emerging trends.
MORE CHARTS & FREE EDUCATION
SUBSCRIBE 🚀 themarketflow.trading
MORE CHARTS & FREE EDUCATION
SUBSCRIBE 🚀 themarketflow.trading
Disclaimer
The information and publications are not meant to be, and do not constitute, financial, investment, trading, or other types of advice or recommendations supplied or endorsed by TradingView. Read more in the Terms of Use.
Day trader capitalizing on the expansion phases of emerging trends.
MORE CHARTS & FREE EDUCATION
SUBSCRIBE 🚀 themarketflow.trading
MORE CHARTS & FREE EDUCATION
SUBSCRIBE 🚀 themarketflow.trading
Disclaimer
The information and publications are not meant to be, and do not constitute, financial, investment, trading, or other types of advice or recommendations supplied or endorsed by TradingView. Read more in the Terms of Use.