🔹 Chart Observations
Resistance Breakout
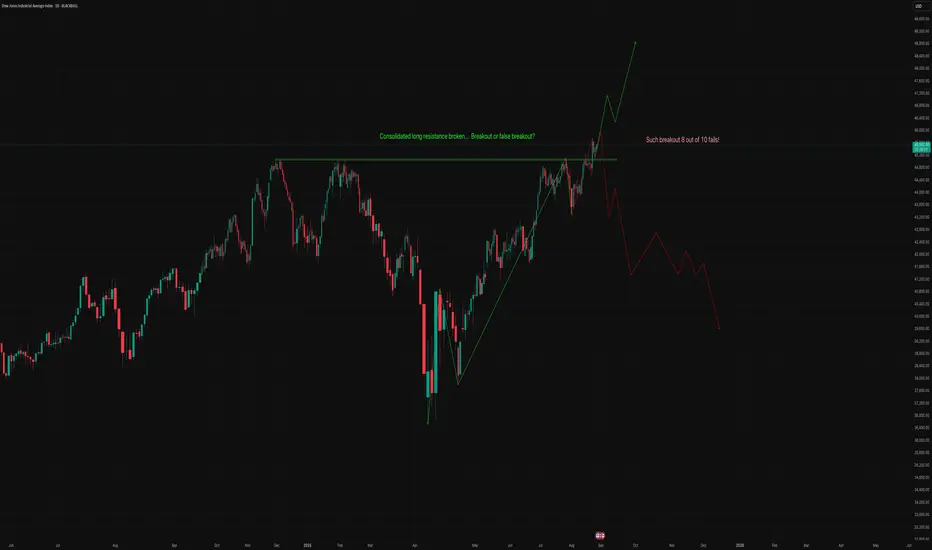
Price has broken above a long consolidation resistance (~46,000 region).
The breakout candle is strong, but history shows such moves can turn into false breakouts.
Volume / Price Action
Recent candles show strong upward momentum but also long wicks, hinting at supply near highs.
Breakouts without strong follow-up volume often fail.
Trend Structure
From April lows, the index has made a clear higher-high, higher-low structure.
This short-term uptrend is intact unless price falls below ~44,500.
Probability Factor
Your annotation (“Such breakouts 8 out of 10 fails”) is correct — historically, consolidated range breakouts in indices often retrace.
A retest of breakout zone (~45,000–45,500) is possible.
🔹 Medium-Term Scenarios
✅ Bullish Case (Green Path in Chart)
Sustains above 46,000 → momentum could extend toward 47,800 → 49,500 (ATH zones).
Requires confirmation with volume and follow-through buying.
Support at 45,000–45,500 must hold.
⚠️ Bearish Case (Red Path in Chart)
If price fails to hold 45,000, breakdown may drag index toward:
42,500 (first major demand zone).
40,000 (psychological + structural support).
A false breakout could trigger a deeper correction, especially if global risk sentiment weakens.
🔹 Medium-Term Outlook
Bias: Cautiously bullish, but watching for false breakout signs.
Key trigger levels:
Above 46,000 → bullish continuation.
Below 45,000 → correction likely toward 42,500–40,000.
🔹 Trading View
Swing Traders:
Enter only on confirmation (daily close above 46,200 with volume).
SL below 45,000.
Options Traders:
Iron condor/strangles around 45,000–47,000 range could work short term, since volatility may compress after breakout.
Medium-term investors:
Better to wait for a retest of breakout zone before adding fresh longs.
⚠️ Disclaimer: This is a technical view, not financial advice. Always combine with macro factors (US rates, Fed outlook, earnings).
Resistance Breakout
Price has broken above a long consolidation resistance (~46,000 region).
The breakout candle is strong, but history shows such moves can turn into false breakouts.
Volume / Price Action
Recent candles show strong upward momentum but also long wicks, hinting at supply near highs.
Breakouts without strong follow-up volume often fail.
Trend Structure
From April lows, the index has made a clear higher-high, higher-low structure.
This short-term uptrend is intact unless price falls below ~44,500.
Probability Factor
Your annotation (“Such breakouts 8 out of 10 fails”) is correct — historically, consolidated range breakouts in indices often retrace.
A retest of breakout zone (~45,000–45,500) is possible.
🔹 Medium-Term Scenarios
✅ Bullish Case (Green Path in Chart)
Sustains above 46,000 → momentum could extend toward 47,800 → 49,500 (ATH zones).
Requires confirmation with volume and follow-through buying.
Support at 45,000–45,500 must hold.
⚠️ Bearish Case (Red Path in Chart)
If price fails to hold 45,000, breakdown may drag index toward:
42,500 (first major demand zone).
40,000 (psychological + structural support).
A false breakout could trigger a deeper correction, especially if global risk sentiment weakens.
🔹 Medium-Term Outlook
Bias: Cautiously bullish, but watching for false breakout signs.
Key trigger levels:
Above 46,000 → bullish continuation.
Below 45,000 → correction likely toward 42,500–40,000.
🔹 Trading View
Swing Traders:
Enter only on confirmation (daily close above 46,200 with volume).
SL below 45,000.
Options Traders:
Iron condor/strangles around 45,000–47,000 range could work short term, since volatility may compress after breakout.
Medium-term investors:
Better to wait for a retest of breakout zone before adding fresh longs.
⚠️ Disclaimer: This is a technical view, not financial advice. Always combine with macro factors (US rates, Fed outlook, earnings).
Disclaimer
The information and publications are not meant to be, and do not constitute, financial, investment, trading, or other types of advice or recommendations supplied or endorsed by TradingView. Read more in the Terms of Use.
Disclaimer
The information and publications are not meant to be, and do not constitute, financial, investment, trading, or other types of advice or recommendations supplied or endorsed by TradingView. Read more in the Terms of Use.