Current trend
USD has shown a moderate decline against CAD during the Asian session, developing mixed trading dynamics in the short term.
Investors continue to focus on the situation with increased inflation, which forces the leading central banks of the world to act somewhat faster than the previously indicated timeframes. Thus, the US Fed and the Bank of Canada are already quite close to a possible tightening of monetary policy. Many analysts suggest that the US regulator will announce the reduction of its quantitative easing (QE) program already at the November meeting.
The macroeconomic statistics from the USA and Canada published on Friday turned out to be quite optimistic; however, the dynamics of the instrument was largely influenced by the Canadian data. Retail Sales in Canada increased by 2.1% MoM in August after falling by 0.1% MoM (revised from –0.6% MoM). The real dynamics turned out to be very close to the market forecasts at the level of 2.0% MoM. Retail Sales excluding Autos for the same period increased by 2.8% MoM after falling by 0.4% MoM in July.
Support and resistance
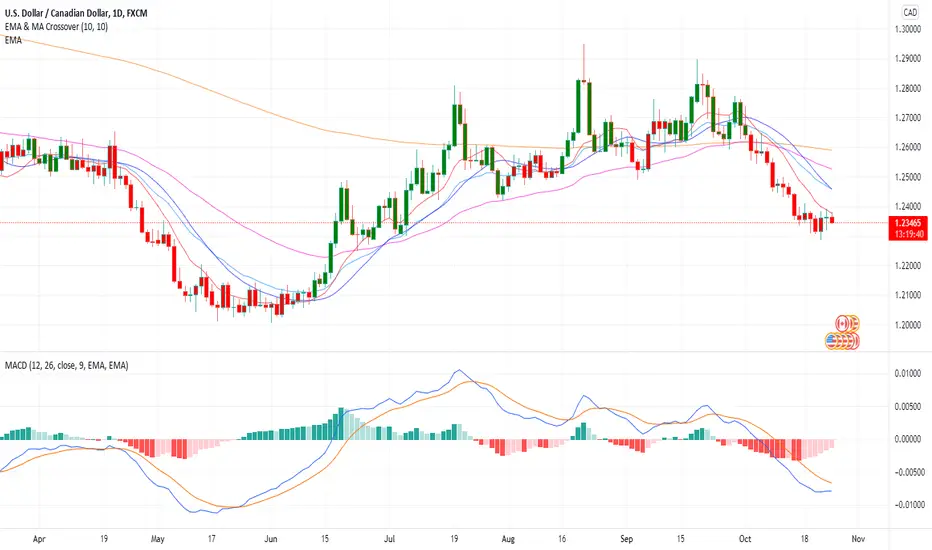
Bollinger Bands in D1 chart demonstrate a stable decrease. The price range is narrowing, pointing at the ambiguous nature of trading in the short term. MACD is reversing to growth forming a weak buy signal (located above the signal line). Stochastic increases more confidently, which, however, weakly correlates with the real trend in the market.
Resistance levels: 1.2400, 1.2445, 1.2500, 1.2558.
Support levels: 1.2335, 1.2300, 1.2245, 1.2200.
USD has shown a moderate decline against CAD during the Asian session, developing mixed trading dynamics in the short term.
Investors continue to focus on the situation with increased inflation, which forces the leading central banks of the world to act somewhat faster than the previously indicated timeframes. Thus, the US Fed and the Bank of Canada are already quite close to a possible tightening of monetary policy. Many analysts suggest that the US regulator will announce the reduction of its quantitative easing (QE) program already at the November meeting.
The macroeconomic statistics from the USA and Canada published on Friday turned out to be quite optimistic; however, the dynamics of the instrument was largely influenced by the Canadian data. Retail Sales in Canada increased by 2.1% MoM in August after falling by 0.1% MoM (revised from –0.6% MoM). The real dynamics turned out to be very close to the market forecasts at the level of 2.0% MoM. Retail Sales excluding Autos for the same period increased by 2.8% MoM after falling by 0.4% MoM in July.
Support and resistance
Bollinger Bands in D1 chart demonstrate a stable decrease. The price range is narrowing, pointing at the ambiguous nature of trading in the short term. MACD is reversing to growth forming a weak buy signal (located above the signal line). Stochastic increases more confidently, which, however, weakly correlates with the real trend in the market.
Resistance levels: 1.2400, 1.2445, 1.2500, 1.2558.
Support levels: 1.2335, 1.2300, 1.2245, 1.2200.
Disclaimer
The information and publications are not meant to be, and do not constitute, financial, investment, trading, or other types of advice or recommendations supplied or endorsed by TradingView. Read more in the Terms of Use.
Disclaimer
The information and publications are not meant to be, and do not constitute, financial, investment, trading, or other types of advice or recommendations supplied or endorsed by TradingView. Read more in the Terms of Use.