We are approaching a multi-layer confluence support on oil that aligns several HTF analysis factors and potential seasonal and geopolitical considerations.
This area represents a robust multi-confluence support zone — likely near a yearly low — offering a compelling blend of technical support and long-term positioning.
For reference, the USDWTI (ICE) has been used as the feed provides a reliable, continuous spot-price series for modern WTI crude — ideal for EMAs, pivots and near-term technical structure. Many retail-broker CFD feeds cover only limited history, which can be insufficient for HTF analysis.
Full USDWTI chart analysis:

🔎 Key Technical Levels on the Confluence Zone
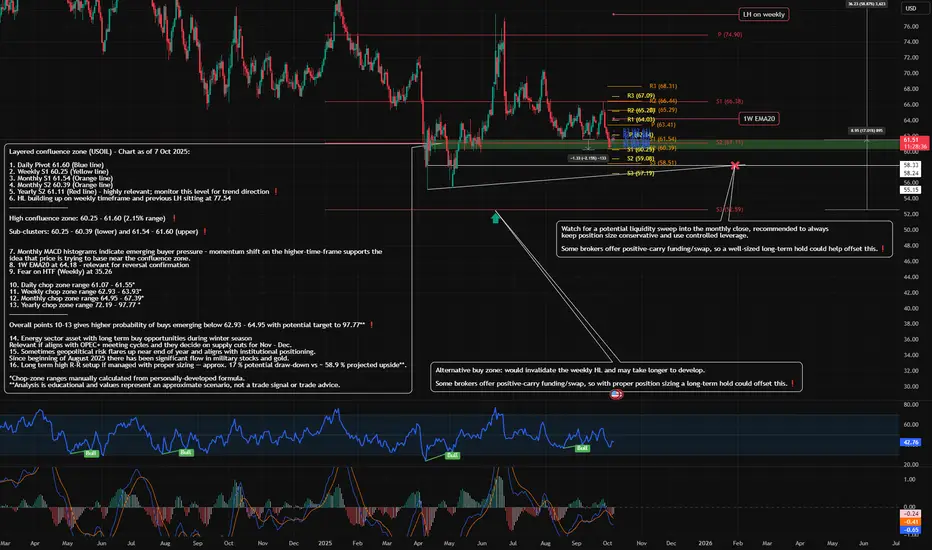
1. Daily Pivot: 61.60
2. Weekly S1: 60.25
3. Monthly S1: 61.54
4. Monthly S2: 60.39
5. Yearly S2: 61.11
Primary Confluence Zone: 60.25 - 61.60 (≈ 2.15 % range)
• Sub-clusters: 60.25 - 60.39 (lower) and 61.54 - 61.60 (upper)
____________
📊 Momentum & Structure
6. Monthly MACD histogram turning upward → early buyer pressure on HTF
7. 1W EMA-20 ≈ 64.18 – needs to be reclaimed for any sustained long-term reversal
8. Fear on weekly timeframe at 35.46
9. Daily chop zone: 61.07 - 61.55*
10. Weekly chop zone: 62.93 - 63.93*
11. Monthly chop zone: 64.95 - 67.39*
12. Yearly chop zone: 72.19 - 97.77*
____________
Seasonal / Macro Notes
13. Energy sector often benefits from Q4–winter demand (heating-fuel season).
OPEC+ meeting cycle in Nov–Dec: any production cuts would reinforce technical support.
14. Geopolitical risk often rises year-end; since Aug 2025, capital has rotated into gold and defence stocks, reflecting risk-hedge positioning.
15. Long term high R-R setup if managed with proper sizing — approx. 17 % potential draw-down vs ~ 58.9 % projected upside**.
____________
💡 Context
Crude typically shows mild seasonal firming from Oct → early winter on heating demand and OPEC policy, though this can be offset by high inventories, a mild winter, or weak macro growth.
The content in this analysis highlights a high-probability zone (60.25 - 61.60) where multiple confluences align, useful for observation and study.
This is not a buy or sell signal. These observations are for market-study purposes only and should not be interpreted as trade instructions.
____________
⚠️ Risk Note:
It is recommended not to overleverage your positions. Overexposure is the main killer of portfolios. Position sizing directly impacts mental clarity: excessive size can cloud judgment and trigger emotional reactions, while appropriate sizing supports composure and disciplined execution. It is better to collect steady breadcrumbs than to risk giving away your capital.
Trading risk can be managed but never eliminated.
❗️Disclaimer:
This content is provided for educational purposes only. It does not constitute financial, legal, tax, or investment advice. The author does not provide trading signals, portfolio management, or any services regulated by the Financial Conduct Authority.
___________
*Chop-zone ranges manually calculated from personally-developed formula.
**Analysis is educational and values represent an approximate scenario, not a trade signal or trade advice.
This area represents a robust multi-confluence support zone — likely near a yearly low — offering a compelling blend of technical support and long-term positioning.
For reference, the USDWTI (ICE) has been used as the feed provides a reliable, continuous spot-price series for modern WTI crude — ideal for EMAs, pivots and near-term technical structure. Many retail-broker CFD feeds cover only limited history, which can be insufficient for HTF analysis.
Full USDWTI chart analysis:
🔎 Key Technical Levels on the Confluence Zone
1. Daily Pivot: 61.60
2. Weekly S1: 60.25
3. Monthly S1: 61.54
4. Monthly S2: 60.39
5. Yearly S2: 61.11
Primary Confluence Zone: 60.25 - 61.60 (≈ 2.15 % range)
• Sub-clusters: 60.25 - 60.39 (lower) and 61.54 - 61.60 (upper)
____________
📊 Momentum & Structure
6. Monthly MACD histogram turning upward → early buyer pressure on HTF
7. 1W EMA-20 ≈ 64.18 – needs to be reclaimed for any sustained long-term reversal
8. Fear on weekly timeframe at 35.46
9. Daily chop zone: 61.07 - 61.55*
10. Weekly chop zone: 62.93 - 63.93*
11. Monthly chop zone: 64.95 - 67.39*
12. Yearly chop zone: 72.19 - 97.77*
____________
Seasonal / Macro Notes
13. Energy sector often benefits from Q4–winter demand (heating-fuel season).
OPEC+ meeting cycle in Nov–Dec: any production cuts would reinforce technical support.
14. Geopolitical risk often rises year-end; since Aug 2025, capital has rotated into gold and defence stocks, reflecting risk-hedge positioning.
15. Long term high R-R setup if managed with proper sizing — approx. 17 % potential draw-down vs ~ 58.9 % projected upside**.
____________
💡 Context
Crude typically shows mild seasonal firming from Oct → early winter on heating demand and OPEC policy, though this can be offset by high inventories, a mild winter, or weak macro growth.
The content in this analysis highlights a high-probability zone (60.25 - 61.60) where multiple confluences align, useful for observation and study.
This is not a buy or sell signal. These observations are for market-study purposes only and should not be interpreted as trade instructions.
____________
⚠️ Risk Note:
It is recommended not to overleverage your positions. Overexposure is the main killer of portfolios. Position sizing directly impacts mental clarity: excessive size can cloud judgment and trigger emotional reactions, while appropriate sizing supports composure and disciplined execution. It is better to collect steady breadcrumbs than to risk giving away your capital.
Trading risk can be managed but never eliminated.
❗️Disclaimer:
This content is provided for educational purposes only. It does not constitute financial, legal, tax, or investment advice. The author does not provide trading signals, portfolio management, or any services regulated by the Financial Conduct Authority.
___________
*Chop-zone ranges manually calculated from personally-developed formula.
**Analysis is educational and values represent an approximate scenario, not a trade signal or trade advice.
Disclaimer
The information and publications are not meant to be, and do not constitute, financial, investment, trading, or other types of advice or recommendations supplied or endorsed by TradingView. Read more in the Terms of Use.
Disclaimer
The information and publications are not meant to be, and do not constitute, financial, investment, trading, or other types of advice or recommendations supplied or endorsed by TradingView. Read more in the Terms of Use.