Crude Oil (WTI) - Cup and Handle Pattern Breakdown
Chart Overview:
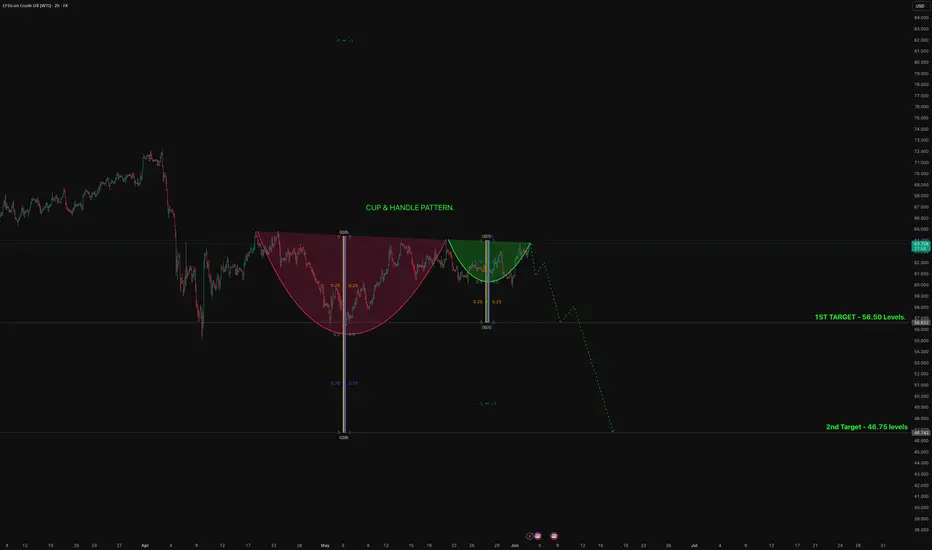
The chart displays a clearly formed Cup and Handle Pattern — a classic technical formation often followed by aggressive moves.
Cup Formation: Smooth rounding bottom showing accumulation phase, with resistance near $66.5.
Handle Formation: Slight pullback consolidating below resistance, typical before a breakdown.
Technical Interpretation:
The Cup and Handle pattern is typically considered a bullish continuation pattern. However, in this case, the price has failed to break above the resistance, suggesting a bearish reversal.
Bearish Breakdown Expected: Instead of breaking out to the upside, price action suggests a breakdown — making the Cup and Handle act as a reversal pattern.
Targets:
First Target:
56.50 USD
This level aligns with the measured move technique where the depth of the cup is projected downward from the breakdown point.
Second Target:
46.75 USD
This target is based on further extension, likely a Fibonacci projection or the full cup depth extension in bearish scenario.
Key Observations:
Pattern Completion: The handle part has completed and price is hesitating near the neckline.
Volume Confirmation: (Assumed from typical setups) — Breakdown from the handle zone usually needs a surge in volume to confirm the bearish move.
Trend Structure: Lower highs and lower lows forming after the peak of the handle indicate growing selling pressure.
Measured Move Logic:
The height of the Cup (from the bottom to resistance) is projected downward.
Extension projections justify the second target of 46.75 USD.
Risk Factors:
Watch for any false breakdown — if price reverses and reclaims above the handle resistance (~66.5 USD), the pattern would be invalidated.
Macroeconomic news (OPEC meetings, inventory data, geopolitical tensions) can impact Crude Oil prices unpredictably.
Summary:
Pattern: Cup & Handle (Bearish Reversal)
Breakdown Expectation: Strong, impulsive.
Immediate Target: 56.50 USD
Extended Target: 46.75 USD
Invalidation: Close above 66.50 USD.
Disclaimer:
This analysis is for educational purposes only and does not constitute investment advice. Trading in crude oil or any commodity involves significant risk and you should consult your financial advisor before making trading decisions.
Chart Overview:
The chart displays a clearly formed Cup and Handle Pattern — a classic technical formation often followed by aggressive moves.
Cup Formation: Smooth rounding bottom showing accumulation phase, with resistance near $66.5.
Handle Formation: Slight pullback consolidating below resistance, typical before a breakdown.
Technical Interpretation:
The Cup and Handle pattern is typically considered a bullish continuation pattern. However, in this case, the price has failed to break above the resistance, suggesting a bearish reversal.
Bearish Breakdown Expected: Instead of breaking out to the upside, price action suggests a breakdown — making the Cup and Handle act as a reversal pattern.
Targets:
First Target:
56.50 USD
This level aligns with the measured move technique where the depth of the cup is projected downward from the breakdown point.
Second Target:
46.75 USD
This target is based on further extension, likely a Fibonacci projection or the full cup depth extension in bearish scenario.
Key Observations:
Pattern Completion: The handle part has completed and price is hesitating near the neckline.
Volume Confirmation: (Assumed from typical setups) — Breakdown from the handle zone usually needs a surge in volume to confirm the bearish move.
Trend Structure: Lower highs and lower lows forming after the peak of the handle indicate growing selling pressure.
Measured Move Logic:
The height of the Cup (from the bottom to resistance) is projected downward.
Extension projections justify the second target of 46.75 USD.
Risk Factors:
Watch for any false breakdown — if price reverses and reclaims above the handle resistance (~66.5 USD), the pattern would be invalidated.
Macroeconomic news (OPEC meetings, inventory data, geopolitical tensions) can impact Crude Oil prices unpredictably.
Summary:
Pattern: Cup & Handle (Bearish Reversal)
Breakdown Expectation: Strong, impulsive.
Immediate Target: 56.50 USD
Extended Target: 46.75 USD
Invalidation: Close above 66.50 USD.
Disclaimer:
This analysis is for educational purposes only and does not constitute investment advice. Trading in crude oil or any commodity involves significant risk and you should consult your financial advisor before making trading decisions.
Disclaimer
The information and publications are not meant to be, and do not constitute, financial, investment, trading, or other types of advice or recommendations supplied or endorsed by TradingView. Read more in the Terms of Use.
Disclaimer
The information and publications are not meant to be, and do not constitute, financial, investment, trading, or other types of advice or recommendations supplied or endorsed by TradingView. Read more in the Terms of Use.