The long-awaited breakout in the Silver vs S&P 500 ratio is now confirmed.
The latest pullback validated the retest of the multi-year downtrend, and today’s move officially establishes a new bullish structural cycle.
Why This Matters
For the last 14 years, capital overwhelmingly favored the S&P 500 — the “fastest horse” in global markets.
The breakout in the Silver/SPX ratio signals the beginning of a capital rotation away from overvalued equities and back into real assets, especially industrial and monetary metals.
Macro Drivers Behind the New Silver Cycle
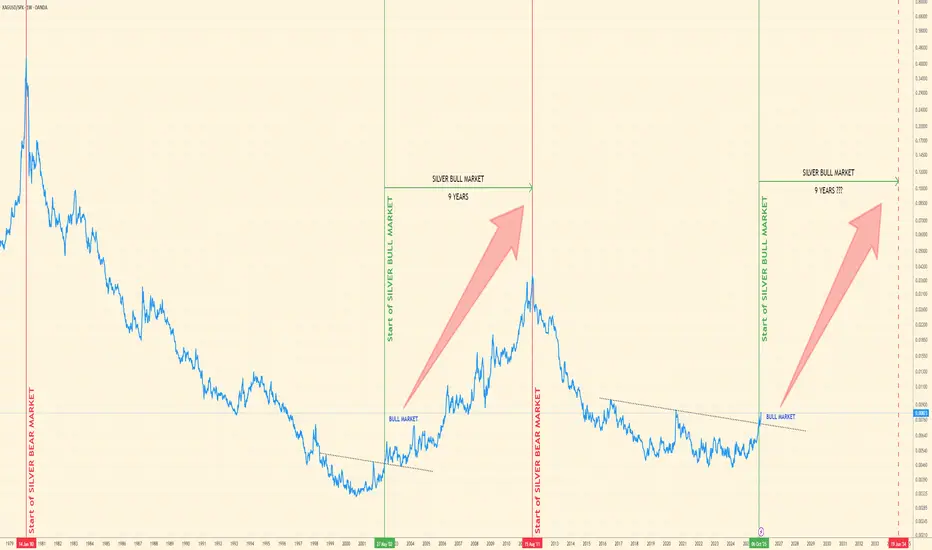
Cyclical Outlook
History suggests clear structural cycles:
Bear market: 1980–2002 (22 years)
Bull market: 2002–2011 (9 years)
In the last cycle, leading silver miners gained roughly 10x. Many miners already doubled from the 2022–2023 lows. If the pattern repeats, the current cycle (2025–2034?) could still deliver significant upside.
This cycle may even be faster and stronger, driven by exponential industrial demand and a fragile equity market dominated by a handful of megacap stocks.
Gold/Silver Ratio Signals Further Upside
Silver remains deeply undervalued relative to gold.
A move toward 62:1, and later 30:1, looks increasingly realistic based on technical structure.
Technical Setup – $62.66 First Target
On the 4H chart, silver has confirmed a Cup & Handle breakout, projecting a short-term target of $62.66 — likely just a waypoint on the path toward $100+ if the macro cycle unfolds as expected.
Conclusion
Silver is entering a new secular bull market supported by macro forces, tightening supply, and strong technical confirmation.
The coming years could be highly volatile, but extremely rewarding for holders of real assets.
This is not investment advice — always do your own research.
The latest pullback validated the retest of the multi-year downtrend, and today’s move officially establishes a new bullish structural cycle.
Why This Matters
For the last 14 years, capital overwhelmingly favored the S&P 500 — the “fastest horse” in global markets.
The breakout in the Silver/SPX ratio signals the beginning of a capital rotation away from overvalued equities and back into real assets, especially industrial and monetary metals.
Macro Drivers Behind the New Silver Cycle
- 5 consecutive years of structural deficit – demand consistently outpacing supply.
- Silver added to the U.S. critical minerals list.
- Central banks quietly accumulating silver for the first time in decades.
- LBMA inventories at historic lows, reducing available liquidity.
- Mining supply is constrained, with silver mostly produced as a by-product.
- Weakening Western currencies push capital into tangible assets.
- Exploding industrial demand, especially from next-gen solar technologies (TOPCon/HJT).
- A looming supply cliff – few new discoveries and long development timelines.
- Growing middle class in India & SE Asia driving record demand for jewelry and investment.
Cyclical Outlook
History suggests clear structural cycles:
Bear market: 1980–2002 (22 years)
Bull market: 2002–2011 (9 years)
In the last cycle, leading silver miners gained roughly 10x. Many miners already doubled from the 2022–2023 lows. If the pattern repeats, the current cycle (2025–2034?) could still deliver significant upside.
This cycle may even be faster and stronger, driven by exponential industrial demand and a fragile equity market dominated by a handful of megacap stocks.
Gold/Silver Ratio Signals Further Upside
Silver remains deeply undervalued relative to gold.
A move toward 62:1, and later 30:1, looks increasingly realistic based on technical structure.
Technical Setup – $62.66 First Target
On the 4H chart, silver has confirmed a Cup & Handle breakout, projecting a short-term target of $62.66 — likely just a waypoint on the path toward $100+ if the macro cycle unfolds as expected.
Conclusion
Silver is entering a new secular bull market supported by macro forces, tightening supply, and strong technical confirmation.
The coming years could be highly volatile, but extremely rewarding for holders of real assets.
This is not investment advice — always do your own research.
Disclaimer
The information and publications are not meant to be, and do not constitute, financial, investment, trading, or other types of advice or recommendations supplied or endorsed by TradingView. Read more in the Terms of Use.
Disclaimer
The information and publications are not meant to be, and do not constitute, financial, investment, trading, or other types of advice or recommendations supplied or endorsed by TradingView. Read more in the Terms of Use.