Silver has literally jumped to the forefront of commodity market traders’ screens in October as it has soared to record highs, followed by an increased period of volatility, before then moving to even higher levels again this morning. The main reasons seem to be Silver’s attraction as an alternative to Gold as a safe haven/debasement asset in this current period of uncertainty.
Traders are concerned about increased trade tensions, a prolonged US government shutdown, weaker global growth, excessive levels of government debt, inflation, a war in Ukraine and what the Federal Reserve may do next regarding interest rates. It is quite an extensive list!
Add to this a historic physical shortage of Silver, soaring borrowing costs and reduced liquidity in a market that is much smaller than its big brother, Gold, and you have a recipe for a volatile asset that is not to be entered without strong risk management, a good understanding of the fundamentals and a serious consideration of important technical levels.
Silver started the month at 46.647, dipped to a low of 45.903 on October 2nd and then hasn’t looked back, posting a series of new multi-year and then record highs all the way to a peak this morning at 53.50. However, it hasn’t been plain sailing, with an average 5% trading range over the last three days alone. An important risk factor to consider.
Looking forward across this week, Silver prices could be influenced by the next headlines outlining where the direction of trade tensions between the US and China are moving, including updates on whether President’s Trump and Xi will meet later this month as had been originally planned. Their first meeting for 6 years.
Progress updates on the stalemate between Democrats and Republicans that has forced the US government into a 2 week shutdown may also be relevant, alongside any easing in the current supply issues in the physical Silver market.
Technical Update: The Push Higher Continues:
It should always be remembered that traditional overbought signals are sometimes ignored while trending and sentiment measures remain strong. It’s a reminder that indicators like RSI or stochastics may flash caution, but price can continue to move higher if broader conditions support it.
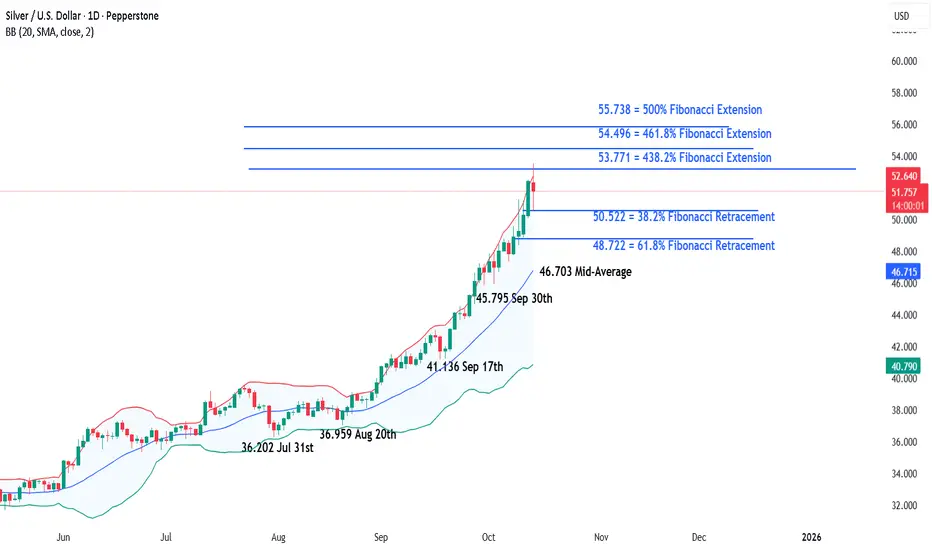
Silver has defied overbought readings of late with a near-uninterrupted rally since the August lows. Despite repeated calls from some for a correction, price action has remained resilient, underscoring how strong trend and sentiment can override traditional ‘overbought’ conditions.

So, what are the tools that might be used to gauge the trending and sentiment condition of Silver’s recent moves?
From a sentiment standpoint, the chart above shows a bias toward larger, more frequent green positive candles, indicating consistent buying interest. Traders appear willing to pay higher prices despite the extended rally, which reflects positive sentiment. This pattern suggests confidence in the trend, with dips being viewed as opportunities rather than warnings.
From a trending perspective, Bollinger Bands have shown price remains above the rising mid-average, frequently touching the upper band, while the bands themselves are widening. This combination reflects upward momentum and positive price volatility, maintaining a constructive backdrop.
Silver’s current setup might suggest attempts at further price strength, but it’s no guarantee of continuation. Positive candles and price action above the rising mid-average, alongside widening Bollinger Bands may point to momentum behind the current move, but traders must also stay alert, watching candlestick signals and Bollinger band activity to assess the current trends sustainability.
This backdrop can of course shift quickly, so tracking key support and resistance levels is also vital to help spot possible emerging directional themes.
Possible Resistance Levels:.
The 53.771 level, marking the 438.2% Fibonacci extension, may now act as a key resistance point. So far, Tuesday’s push into new highs has stayed below this level on a closing basis, suggesting it might slow further upside and potentially ease the prevailing bullish trend and sentiment.
Monitoring how this 53.771 resistance level is defended on a closing basis may prove important this week. A sustained break above it could result in further attempts at upside toward 54.496, the 461.8% extension, even potentially 55.738, a level equal to the 500% extension.
Possible Support Levels:
Throughout the August to October advance, pullbacks have been shallow, typically lasting just one or two sessions, before buyers reasserted control. This pattern currently suggests that near-term weakness may continue to prove limited.
To suggest potential of a possible shift in trend, closing breaks below support levels would likely be required, marking a possible transition from short-term dips to the potential of a corrective phase in price.
The first support may be at 50.522, which is the 38.2% retracement. A close below this level could suggest a deeper correction risk, shifting trader focus toward 48.722, the 61.8% Fibonacci retracement and potentially even 46.703, which is equal to the rising Bollinger mid-average.
The material provided here has not been prepared accordance with legal requirements designed to promote the independence of investment research and as such is considered to be a marketing communication. Whilst it is not subject to any prohibition on dealing ahead of the dissemination of investment research, we will not seek to take any advantage before providing it to our clients.
Pepperstone doesn’t represent that the material provided here is accurate, current or complete, and therefore shouldn’t be relied upon as such. The information, whether from a third party or not, isn’t to be considered as a recommendation; or an offer to buy or sell; or the solicitation of an offer to buy or sell any security, financial product or instrument; or to participate in any particular trading strategy. It does not take into account readers’ financial situation or investment objectives. We advise any readers of this content to seek their own advice. Without the approval of Pepperstone, reproduction or redistribution of this information isn’t permitted.
Traders are concerned about increased trade tensions, a prolonged US government shutdown, weaker global growth, excessive levels of government debt, inflation, a war in Ukraine and what the Federal Reserve may do next regarding interest rates. It is quite an extensive list!
Add to this a historic physical shortage of Silver, soaring borrowing costs and reduced liquidity in a market that is much smaller than its big brother, Gold, and you have a recipe for a volatile asset that is not to be entered without strong risk management, a good understanding of the fundamentals and a serious consideration of important technical levels.
Silver started the month at 46.647, dipped to a low of 45.903 on October 2nd and then hasn’t looked back, posting a series of new multi-year and then record highs all the way to a peak this morning at 53.50. However, it hasn’t been plain sailing, with an average 5% trading range over the last three days alone. An important risk factor to consider.
Looking forward across this week, Silver prices could be influenced by the next headlines outlining where the direction of trade tensions between the US and China are moving, including updates on whether President’s Trump and Xi will meet later this month as had been originally planned. Their first meeting for 6 years.
Progress updates on the stalemate between Democrats and Republicans that has forced the US government into a 2 week shutdown may also be relevant, alongside any easing in the current supply issues in the physical Silver market.
Technical Update: The Push Higher Continues:
It should always be remembered that traditional overbought signals are sometimes ignored while trending and sentiment measures remain strong. It’s a reminder that indicators like RSI or stochastics may flash caution, but price can continue to move higher if broader conditions support it.
Silver has defied overbought readings of late with a near-uninterrupted rally since the August lows. Despite repeated calls from some for a correction, price action has remained resilient, underscoring how strong trend and sentiment can override traditional ‘overbought’ conditions.
So, what are the tools that might be used to gauge the trending and sentiment condition of Silver’s recent moves?
From a sentiment standpoint, the chart above shows a bias toward larger, more frequent green positive candles, indicating consistent buying interest. Traders appear willing to pay higher prices despite the extended rally, which reflects positive sentiment. This pattern suggests confidence in the trend, with dips being viewed as opportunities rather than warnings.
From a trending perspective, Bollinger Bands have shown price remains above the rising mid-average, frequently touching the upper band, while the bands themselves are widening. This combination reflects upward momentum and positive price volatility, maintaining a constructive backdrop.
Silver’s current setup might suggest attempts at further price strength, but it’s no guarantee of continuation. Positive candles and price action above the rising mid-average, alongside widening Bollinger Bands may point to momentum behind the current move, but traders must also stay alert, watching candlestick signals and Bollinger band activity to assess the current trends sustainability.
This backdrop can of course shift quickly, so tracking key support and resistance levels is also vital to help spot possible emerging directional themes.
Possible Resistance Levels:.
The 53.771 level, marking the 438.2% Fibonacci extension, may now act as a key resistance point. So far, Tuesday’s push into new highs has stayed below this level on a closing basis, suggesting it might slow further upside and potentially ease the prevailing bullish trend and sentiment.
Monitoring how this 53.771 resistance level is defended on a closing basis may prove important this week. A sustained break above it could result in further attempts at upside toward 54.496, the 461.8% extension, even potentially 55.738, a level equal to the 500% extension.
Possible Support Levels:
Throughout the August to October advance, pullbacks have been shallow, typically lasting just one or two sessions, before buyers reasserted control. This pattern currently suggests that near-term weakness may continue to prove limited.
To suggest potential of a possible shift in trend, closing breaks below support levels would likely be required, marking a possible transition from short-term dips to the potential of a corrective phase in price.
The first support may be at 50.522, which is the 38.2% retracement. A close below this level could suggest a deeper correction risk, shifting trader focus toward 48.722, the 61.8% Fibonacci retracement and potentially even 46.703, which is equal to the rising Bollinger mid-average.
The material provided here has not been prepared accordance with legal requirements designed to promote the independence of investment research and as such is considered to be a marketing communication. Whilst it is not subject to any prohibition on dealing ahead of the dissemination of investment research, we will not seek to take any advantage before providing it to our clients.
Pepperstone doesn’t represent that the material provided here is accurate, current or complete, and therefore shouldn’t be relied upon as such. The information, whether from a third party or not, isn’t to be considered as a recommendation; or an offer to buy or sell; or the solicitation of an offer to buy or sell any security, financial product or instrument; or to participate in any particular trading strategy. It does not take into account readers’ financial situation or investment objectives. We advise any readers of this content to seek their own advice. Without the approval of Pepperstone, reproduction or redistribution of this information isn’t permitted.
Global risk Warning CFDs are complex instruments and come with a high risk of losing money rapidly due to leverage. Between 74-89% of retail investor accounts lose money when trading in CFDs. You should consider whether you understand how CFD
Disclaimer
The information and publications are not meant to be, and do not constitute, financial, investment, trading, or other types of advice or recommendations supplied or endorsed by TradingView. Read more in the Terms of Use.