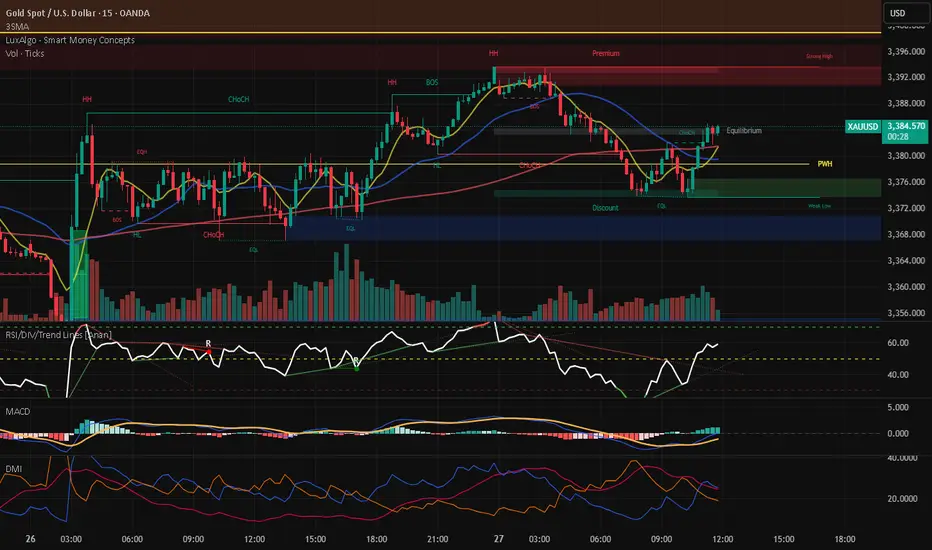
Gold (XAUUSD) is forming an **Ascending Triangle** pattern on the 4H chart.
🔹 Key Resistance
* The **3400 – 3440** zone is acting as a strong ceiling for price.
* A breakout and consolidation above this level could trigger the next bullish wave.
🔹 Supports
* Dynamic Support: Short-term ascending trendline.
* Static Supports: **3320 – 3340**, and if broken, the next support lies at **3260 – 3280**.
🔹 Scenarios
✅ Bullish Scenario:
If price breaks and holds above **3440**, next targets may extend towards **3480 – 3520** and even **3560**.
❌ Bearish Scenario:
If the ascending trendline and **3320** support fail, a deeper correction towards **3260 – 3280** is likely.
🔹 Volume
Decreasing volume in recent moves indicates the market is in a **waiting phase** for a decisive breakout either up or down.
---
📌 Summary:
The current structure suggests buyers have the upper hand, but confirmation will only come with a breakout above **3440**. Risk management is crucial in this area.
Disclaimer
The information and publications are not meant to be, and do not constitute, financial, investment, trading, or other types of advice or recommendations supplied or endorsed by TradingView. Read more in the Terms of Use.
Disclaimer
The information and publications are not meant to be, and do not constitute, financial, investment, trading, or other types of advice or recommendations supplied or endorsed by TradingView. Read more in the Terms of Use.