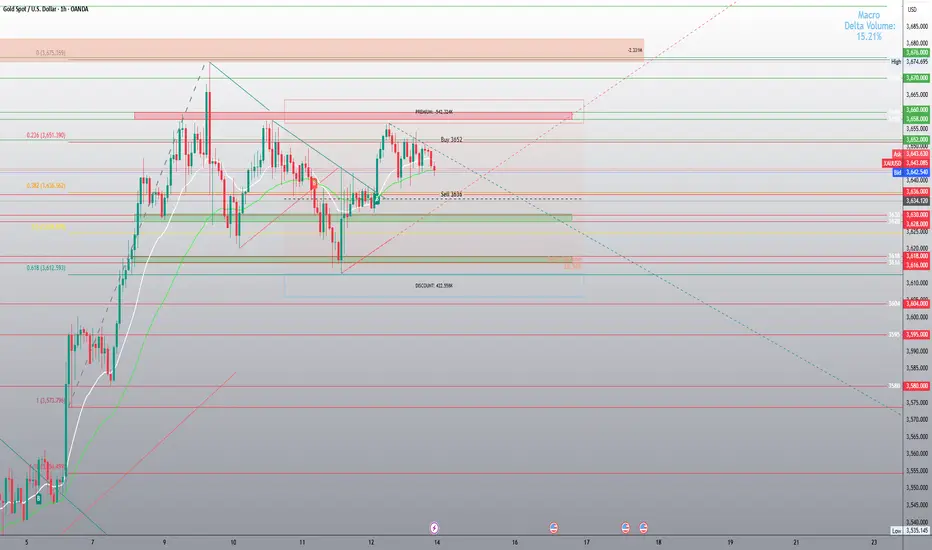
Buy @ 3652
Sell @ 3636
Here’s the analysis:
1. Buy level: 3652
This sits just above the 0.382 Fib retracement (~3650–3651) from the prior swing.
Price has been consolidating around this Fib cluster and the moving average ribbon, so buying at 3652 is a momentum continuation idea if price reclaims and holds above this level.
Upside targets:
First resistance ~3674–3675 (previous swing high).
Beyond that, 3680–3685 (upper green zone), then potential extension toward 3700.
Risk: This buy entry is vulnerable if price rejects at Fib 0.382 and rolls over — in that case, you could get trapped at the top of a range.
2. Sell level: 3636
This lines up with horizontal structure + mid-zone support.
It’s also just above a deeper retracement area (0.5–0.618 zone around 3630–3612).
A sell trigger here suggests you’re looking for a breakdown below consolidation, aiming for:
First target: 3620–3616
Deeper target: 3595–3580 (red zone below).
Risk: If price bounces from the 0.5–0.618 retracement (classic golden pocket), your short may get squeezed.
3. Macro context from this chart
Macro Delta Volume = +15% (top-right): suggests buyers still have an edge.
Current bias seems to favor buy dips rather than short breakdowns, unless we see strong selling momentum below 3630.
The broad structure looks like a bullish consolidation inside Fib retracement, but the market is choppy — meaning both levels are logical as tactical plays, depending on breakout direction.
✅ Summary
Buy 3652: good if price reclaims momentum above Fib 0.382 → targets 3675–3685+.
Sell 3636: works only if price closes below 3630 (break of support) → targets 3616 then 3595–3580.
Overall bias leans bullish as long as gold holds above 3612 (Fib 0.618) — but be ready to flip short if that level gives way.
As always use proper risk management on these trades , take profit ans start securing at 20+ pips
Disclaimer
The information and publications are not meant to be, and do not constitute, financial, investment, trading, or other types of advice or recommendations supplied or endorsed by TradingView. Read more in the Terms of Use.
Disclaimer
The information and publications are not meant to be, and do not constitute, financial, investment, trading, or other types of advice or recommendations supplied or endorsed by TradingView. Read more in the Terms of Use.