In our update on Monday, we discussed the possible involvement of speculators in recent Gold moves and the potential for higher volatility that this could generate because they tend to liquidate positions quickly when a particular move turns stale.
It seems this may have had an impact on Gold prices this week, with a push to record highs of 4381 on Monday followed by a sharp reversal and drop down to lows at 4004 on Wednesday morning, a straight line move that may have more similarities with Bitcoin price action than the potential number 1 safe haven asset of choice for investors.
Now, with traders still reeling from the speed of changes in Gold prices, the emphasis may shift to short term drivers with the US and EU announcing further sanctions on Russian energy in an attempt to end the war in Ukraine, while uncertainty is growing around trade discussions between the US and China after the White House yesterday announced it is considering applying new broad software export restrictions against China, bringing into doubt the ability of the 2 sides to reach an agreement in time for President Trump and Chinese President Xi to potentially still meet at some stage next week.
Also, with the on-going US government shutdown starving traders of some key economic data readings ahead of a crucial Federal Reserve (Fed) interest rate decision next week (Wednesday October 29th), the delayed US CPI reading on Friday, due at 1330 BST may take on increased significance. Any CPI reading above market expectations could lead to a stronger dollar with potential negative implications for Gold, while an in-line or below print could help to stabilise prices around current levels.
Looking forward, with so much uncertainty surrounding the current direction of Gold, it can be helpful to adapt your approach from a technical aspect to initiating trades. This may mean assessing the wider perspective through a daily chart, before moving to a more near-term approach, using a 4 hourly chart to monitor prices ahead of the key risk events into the weekend.
This may help you to adjust your time horizons to potentially take advantage of any short term over extension of moves that could be followed by a quick snap back/reversal as investors consider the wider macro backdrop.
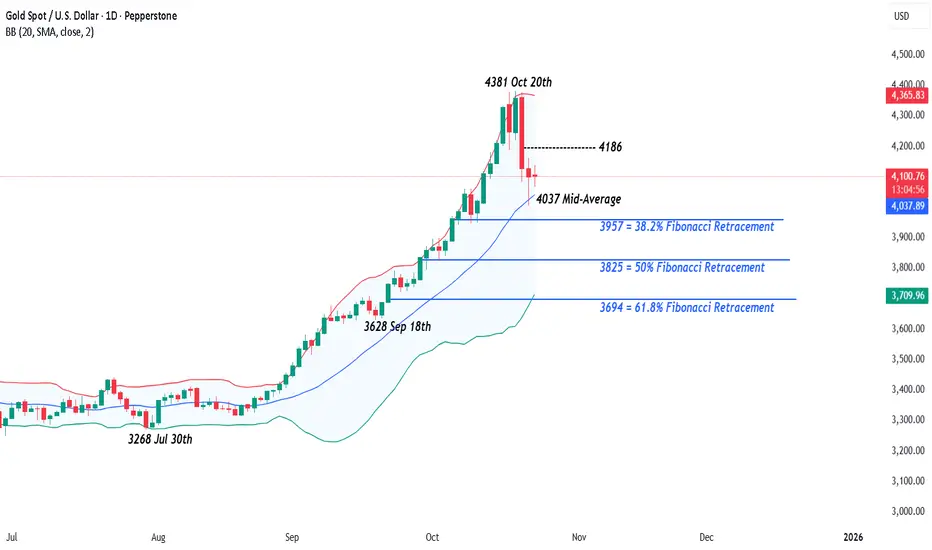
Technical Update: Gold - The Daily Perspective
During periods of high volatility, prices often become stretched away from the 20-period Bollinger mid-average, driven by momentum or sentiment extremes. However, when sentiment shifts direction, price tends to snap back sharply to the average, highlighting the market’s tendency to revert after an overextension.

As shown on the daily chart above, Gold’s latest price weakness could possibly be seen as a similar snap-back move. However, the rising daily Bollinger mid-average, currently at 4037, has so far held the decline on a closing basis, suggesting reversion might be at play following recent volatility.
Traders could now be focusing on this 4037 Bollinger mid-average as a daily support focus, with closing defence of this level watched over the coming key risk events.
However, by also monitoring the 4-hourly chart, it may offer earlier clues to shorter term directional risks, helping traders to anticipate whether longer term momentum is building again or may stall.
Potential Shorter Term Support Levels:
With the 4037 daily Bollinger mid-average already acting as support, the 4-hourly chart perhaps adds another layer of interest. It suggests 4004 as also a potential support level. This is equal to the 38.2% Fibonacci retracement of the September 18th to October 20th rally, and current price action suggests attempts at recovery may well be developing from here.

While not a guarantee of further weakness, 4-hourly closing breaks below the 4004/4037 range, a combination of both the daily and 4 hourly supports, could signal further price weakness. Such breaks may open the way for tests of 3944, the October 9th low, and potentially 3915, the deeper 62% Fibonacci retracement.
Potential Shorter Term Resistance Levels:
Following the recent recovery from the 4004/4037 support zone, the 4-hourly chart suggests 4141 could now be the first resistance focus. This level marks the 38.2% Fibonacci retracement of the October 20th to 21st decline and has already capped earlier attempts at price strength on Wednesday, perhaps further increasing traders attention on this level.
A confirmed 4-hour closing break above 4141 in Gold could lead to further attempts to move higher with 4184, the 50% retracement of the recent decline potentially then the next resistance.
If this level gives way, the rally could have potential to extend towards 4227, which is the higher 62% retracement.
The material provided here has not been prepared accordance with legal requirements designed to promote the independence of investment research and as such is considered to be a marketing communication. Whilst it is not subject to any prohibition on dealing ahead of the dissemination of investment research, we will not seek to take any advantage before providing it to our clients.
Pepperstone doesn’t represent that the material provided here is accurate, current or complete, and therefore shouldn’t be relied upon as such. The information, whether from a third party or not, isn’t to be considered as a recommendation; or an offer to buy or sell; or the solicitation of an offer to buy or sell any security, financial product or instrument; or to participate in any particular trading strategy. It does not take into account readers’ financial situation or investment objectives. We advise any readers of this content to seek their own advice. Without the approval of Pepperstone, reproduction or redistribution of this information isn’t permitted.
It seems this may have had an impact on Gold prices this week, with a push to record highs of 4381 on Monday followed by a sharp reversal and drop down to lows at 4004 on Wednesday morning, a straight line move that may have more similarities with Bitcoin price action than the potential number 1 safe haven asset of choice for investors.
Now, with traders still reeling from the speed of changes in Gold prices, the emphasis may shift to short term drivers with the US and EU announcing further sanctions on Russian energy in an attempt to end the war in Ukraine, while uncertainty is growing around trade discussions between the US and China after the White House yesterday announced it is considering applying new broad software export restrictions against China, bringing into doubt the ability of the 2 sides to reach an agreement in time for President Trump and Chinese President Xi to potentially still meet at some stage next week.
Also, with the on-going US government shutdown starving traders of some key economic data readings ahead of a crucial Federal Reserve (Fed) interest rate decision next week (Wednesday October 29th), the delayed US CPI reading on Friday, due at 1330 BST may take on increased significance. Any CPI reading above market expectations could lead to a stronger dollar with potential negative implications for Gold, while an in-line or below print could help to stabilise prices around current levels.
Looking forward, with so much uncertainty surrounding the current direction of Gold, it can be helpful to adapt your approach from a technical aspect to initiating trades. This may mean assessing the wider perspective through a daily chart, before moving to a more near-term approach, using a 4 hourly chart to monitor prices ahead of the key risk events into the weekend.
This may help you to adjust your time horizons to potentially take advantage of any short term over extension of moves that could be followed by a quick snap back/reversal as investors consider the wider macro backdrop.
Technical Update: Gold - The Daily Perspective
During periods of high volatility, prices often become stretched away from the 20-period Bollinger mid-average, driven by momentum or sentiment extremes. However, when sentiment shifts direction, price tends to snap back sharply to the average, highlighting the market’s tendency to revert after an overextension.
As shown on the daily chart above, Gold’s latest price weakness could possibly be seen as a similar snap-back move. However, the rising daily Bollinger mid-average, currently at 4037, has so far held the decline on a closing basis, suggesting reversion might be at play following recent volatility.
Traders could now be focusing on this 4037 Bollinger mid-average as a daily support focus, with closing defence of this level watched over the coming key risk events.
However, by also monitoring the 4-hourly chart, it may offer earlier clues to shorter term directional risks, helping traders to anticipate whether longer term momentum is building again or may stall.
Potential Shorter Term Support Levels:
With the 4037 daily Bollinger mid-average already acting as support, the 4-hourly chart perhaps adds another layer of interest. It suggests 4004 as also a potential support level. This is equal to the 38.2% Fibonacci retracement of the September 18th to October 20th rally, and current price action suggests attempts at recovery may well be developing from here.
While not a guarantee of further weakness, 4-hourly closing breaks below the 4004/4037 range, a combination of both the daily and 4 hourly supports, could signal further price weakness. Such breaks may open the way for tests of 3944, the October 9th low, and potentially 3915, the deeper 62% Fibonacci retracement.
Potential Shorter Term Resistance Levels:
Following the recent recovery from the 4004/4037 support zone, the 4-hourly chart suggests 4141 could now be the first resistance focus. This level marks the 38.2% Fibonacci retracement of the October 20th to 21st decline and has already capped earlier attempts at price strength on Wednesday, perhaps further increasing traders attention on this level.
A confirmed 4-hour closing break above 4141 in Gold could lead to further attempts to move higher with 4184, the 50% retracement of the recent decline potentially then the next resistance.
If this level gives way, the rally could have potential to extend towards 4227, which is the higher 62% retracement.
The material provided here has not been prepared accordance with legal requirements designed to promote the independence of investment research and as such is considered to be a marketing communication. Whilst it is not subject to any prohibition on dealing ahead of the dissemination of investment research, we will not seek to take any advantage before providing it to our clients.
Pepperstone doesn’t represent that the material provided here is accurate, current or complete, and therefore shouldn’t be relied upon as such. The information, whether from a third party or not, isn’t to be considered as a recommendation; or an offer to buy or sell; or the solicitation of an offer to buy or sell any security, financial product or instrument; or to participate in any particular trading strategy. It does not take into account readers’ financial situation or investment objectives. We advise any readers of this content to seek their own advice. Without the approval of Pepperstone, reproduction or redistribution of this information isn’t permitted.
Global risk Warning CFDs are complex instruments and come with a high risk of losing money rapidly due to leverage. Between 74-89% of retail investor accounts lose money when trading in CFDs. You should consider whether you understand how CFD
Disclaimer
The information and publications are not meant to be, and do not constitute, financial, investment, trading, or other types of advice or recommendations supplied or endorsed by TradingView. Read more in the Terms of Use.