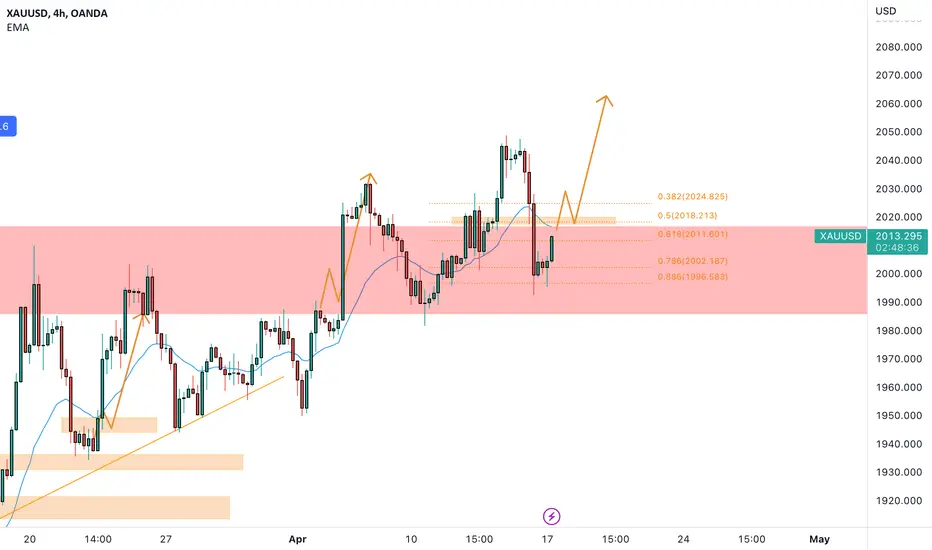
After our previous analysis, GOLD on the 4h chart shows more bullish strength and the price reached the 2040 level.
A break of the weekly resistance indicates that the bullish pressure has increased and a possible break over the 2050 area can happen.
How can i approach this scenario?
The price has retraced on Friday over the previous resistance now turned support at the 0.786 Fibonacci level.
In the pre- market session the price is moving to the 50% treavement and a break above can be a sign of bullish pressure.
According to Plancton's strategy IF the market will break above we will check the opportunity for a nice long order.
Note
Note
Disclaimer
The information and publications are not meant to be, and do not constitute, financial, investment, trading, or other types of advice or recommendations supplied or endorsed by TradingView. Read more in the Terms of Use.
Disclaimer
The information and publications are not meant to be, and do not constitute, financial, investment, trading, or other types of advice or recommendations supplied or endorsed by TradingView. Read more in the Terms of Use.