Support & Resistance in Trading – Key Concepts & Strategies
📌 What are Support & Resistance Levels?
Support and resistance are fundamental concepts in **technical analysis** that help traders identify key price levels where an asset's price is likely to **reverse, consolidate, or break through.
- **Support Level:** A price point where demand is strong enough to prevent further decline. When the price reaches support, buyers tend to step in, causing a bounce.
- **Resistance Level:** A price point where selling pressure is strong enough to prevent further rise. When the price reaches resistance, sellers often push the price lower.
---
**🔹 Why Are Support & Resistance Important?**
1️⃣ **Identifying Reversal Points:** These levels help traders anticipate where price might change direction.
2️⃣ **Entry & Exit Strategy:** Traders use them to plan buy/sell positions, stop-loss, and take-profit levels.
3️⃣ **Breakouts & Fakeouts:** If price breaks through a key level, it signals a strong trend; however, false breakouts (fakeouts) can also occur.
4️⃣ **Psychological Impact:** Many traders watch these levels, making them **self-fulfilling price zones**.
---
**📊 How to Identify Support & Resistance?**
- **Historical Price Action:** Look for levels where price previously reversed multiple times.
- **Trendlines:** Draw diagonal trendlines connecting higher lows (for support) or lower highs (for resistance).
- **Moving Averages (e.g., EMA50, EMA200):** Act as dynamic support/resistance.
- **Fibonacci Levels:** Key retracement levels (38.2%, 50%, 61.8%) often act as support/resistance.
- **Volume Analysis:** High volume near certain price levels indicates strong buying/selling pressure.
---
**🔹 Trading Strategies Using Support & Resistance**
**1️⃣ Range Trading Strategy**
✅ **Buy near support** and **sell near resistance** when the market is moving sideways.
✅ Stop-loss: Below support for buy trades, above resistance for sell trades.
✅ Best used in **range-bound markets** (no strong trend).
**2️⃣ Breakout Trading Strategy**
✅ Enter a trade when price **breaks through a strong support or resistance** level.
✅ Confirm the breakout with **high volume** to avoid fakeouts.
✅ Stop-loss: Below the breakout level (for buy) or above (for sell).
**3️⃣ Retest Trading Strategy (Break & Retest)**
✅ After a breakout, wait for price to **retest the previous support/resistance** before entering.
✅ Provides a better entry with lower risk.
✅ Stop-loss: Below the retested level (for buy) or above (for sell).
---
**📌 Common Mistakes Traders Make**
❌ **Buying too close to resistance** or **selling too close to support** – wait for confirmation.
❌ **Ignoring fakeouts** – always check volume & price action before entering a breakout trade.
❌ **Not using stop-losses** – markets can be unpredictable, and risk management is key.
---
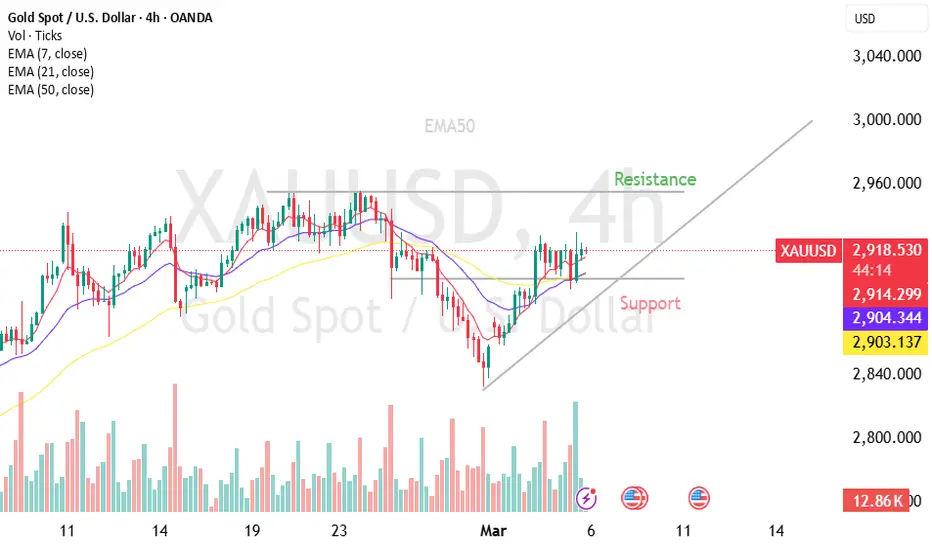
**📈 Example in Real Market (Gold – XAU/USD Analysis)**
- **Support:** $2,900
- **Resistance:** $2,950
- **Scenario 1 (Bullish Breakout):** If price **breaks above $2,950**, it could rally to $3,000.
- **Scenario 2 (Bearish Rejection):** If price **fails to break $2,950 and drops below $2,900**, a pullback to $2,870 is possible.
---
**🔹 Final Thoughts**
Mastering support & resistance is essential for **both beginners and advanced traders**. By combining these levels with other indicators (EMA, RSI, volume), you can improve your trade accuracy and risk management.https://www.tradingview.com/x/HMiYgp4Z/
📌 What are Support & Resistance Levels?
Support and resistance are fundamental concepts in **technical analysis** that help traders identify key price levels where an asset's price is likely to **reverse, consolidate, or break through.
- **Support Level:** A price point where demand is strong enough to prevent further decline. When the price reaches support, buyers tend to step in, causing a bounce.
- **Resistance Level:** A price point where selling pressure is strong enough to prevent further rise. When the price reaches resistance, sellers often push the price lower.
---
**🔹 Why Are Support & Resistance Important?**
1️⃣ **Identifying Reversal Points:** These levels help traders anticipate where price might change direction.
2️⃣ **Entry & Exit Strategy:** Traders use them to plan buy/sell positions, stop-loss, and take-profit levels.
3️⃣ **Breakouts & Fakeouts:** If price breaks through a key level, it signals a strong trend; however, false breakouts (fakeouts) can also occur.
4️⃣ **Psychological Impact:** Many traders watch these levels, making them **self-fulfilling price zones**.
---
**📊 How to Identify Support & Resistance?**
- **Historical Price Action:** Look for levels where price previously reversed multiple times.
- **Trendlines:** Draw diagonal trendlines connecting higher lows (for support) or lower highs (for resistance).
- **Moving Averages (e.g., EMA50, EMA200):** Act as dynamic support/resistance.
- **Fibonacci Levels:** Key retracement levels (38.2%, 50%, 61.8%) often act as support/resistance.
- **Volume Analysis:** High volume near certain price levels indicates strong buying/selling pressure.
---
**🔹 Trading Strategies Using Support & Resistance**
**1️⃣ Range Trading Strategy**
✅ **Buy near support** and **sell near resistance** when the market is moving sideways.
✅ Stop-loss: Below support for buy trades, above resistance for sell trades.
✅ Best used in **range-bound markets** (no strong trend).
**2️⃣ Breakout Trading Strategy**
✅ Enter a trade when price **breaks through a strong support or resistance** level.
✅ Confirm the breakout with **high volume** to avoid fakeouts.
✅ Stop-loss: Below the breakout level (for buy) or above (for sell).
**3️⃣ Retest Trading Strategy (Break & Retest)**
✅ After a breakout, wait for price to **retest the previous support/resistance** before entering.
✅ Provides a better entry with lower risk.
✅ Stop-loss: Below the retested level (for buy) or above (for sell).
---
**📌 Common Mistakes Traders Make**
❌ **Buying too close to resistance** or **selling too close to support** – wait for confirmation.
❌ **Ignoring fakeouts** – always check volume & price action before entering a breakout trade.
❌ **Not using stop-losses** – markets can be unpredictable, and risk management is key.
---
**📈 Example in Real Market (Gold – XAU/USD Analysis)**
- **Support:** $2,900
- **Resistance:** $2,950
- **Scenario 1 (Bullish Breakout):** If price **breaks above $2,950**, it could rally to $3,000.
- **Scenario 2 (Bearish Rejection):** If price **fails to break $2,950 and drops below $2,900**, a pullback to $2,870 is possible.
---
**🔹 Final Thoughts**
Mastering support & resistance is essential for **both beginners and advanced traders**. By combining these levels with other indicators (EMA, RSI, volume), you can improve your trade accuracy and risk management.https://www.tradingview.com/x/HMiYgp4Z/
Disclaimer
The information and publications are not meant to be, and do not constitute, financial, investment, trading, or other types of advice or recommendations supplied or endorsed by TradingView. Read more in the Terms of Use.
Disclaimer
The information and publications are not meant to be, and do not constitute, financial, investment, trading, or other types of advice or recommendations supplied or endorsed by TradingView. Read more in the Terms of Use.