1) The Current Technical Structure (XRP/USD)
The quarterly chart for XRP confirms a powerful technical setup:
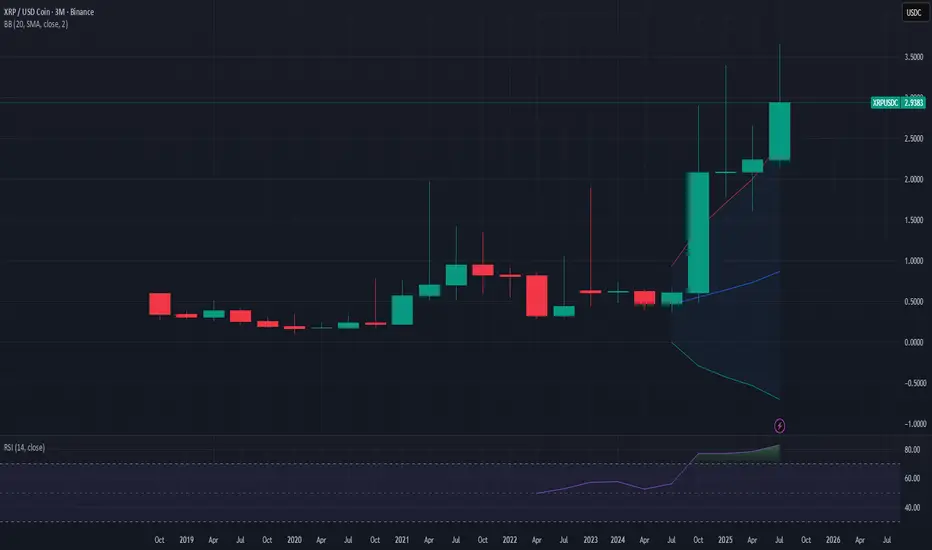
- A classic Bollinger Band breakout on this long timeframe.
- RSI at 82, indicating extremely strong momentum.
- The quarterly candle closed significantly above the upper band, pulled back to test it, and is now pushing higher again.
- This is the exact type of pattern that has historically preceded major multi-year bull markets in other assets.
Quarterly Data
- Q3 2024: Closed at $2.08 (massive breakout quarter).
- Q4 2024: Closed at $2.09 (consolidation at resistance).
- Q1 2025: Closed at $2.24 (reaffirmation of trend).
- Q2 2025: Closed at $2.82 (continued expansion).
________________________
2) Historical Precedents and Outcomes
- Nasdaq (1999): Led to a 5-year rally before a significant correction.
- Gold (2006): Preceded a multi-year rally into 2011.
- Bitcoin (2017): Sparked a 3-year bull market cycle.
The failed examples:
- Oil (2008): Collapsed due to global recession and demand destruction.
- Bitcoin (2021): Failed due to excessive leverage and lack of regulatory clarity.
Key Insight: Sustained precedents coincided with fundamental shifts (tech adoption, central bank easing, institutional crypto entry). Failures were tied to crises or regulatory headwinds.
________________________
3) XRP’s Fundamental Context
XRP stands apart from failed cases because:
- It now has regulatory clarity that Bitcoin lacked in 2021.
- There is potential ETF approval, which could bring institutional flows.
- The financial industry continues to explore blockchain-based payment solutions.
________________________
4) Long-term Value Perspective
- Volume Confirmation: Breakout quarters showed 6–16bn vs prior lower levels, consistent with accumulation.
- Regulatory Sequenance: Momentum followed clarity, unlike Bitcoin 2021.
- Relative Valuation: Despite momentum, XRP hasn’t shown the euphoric valuations typical of late-cycle blow-offs.
Benjamin Graham’s principle applies: “The market is a voting machine in the short run, but a weighing machine in the long run.” The market here seems to be weighing XRP’s improved fundamentals.
________________________
5) XRP/BTC Ratio Analysis – Structural Strength
Looking at the XRP/BTC pair adds critical confirmation:
- Bottoming (2023–2024): Ratio held around 0.000007–0.000008 BTC.
- Breakout (Q3–Q4 2024): Jumped to 0.000022 (≈129% vs BTC).
- Consolidation (Q1 2025): Formed higher base at 0.000020–0.000025.
- Continuation (Q2 2025): Held 0.000026 despite Bitcoin’s own strength.
This is a textbook basing → breakout → consolidation → continuation pattern on a quarterly ratio chart — much stronger evidence than USD price alone.
________________________
6) Comparative Historical Context
- Bitcoin 2015–2017: Similar long-term basing before secular breakout.
- Ethereum 2016–2017: Ratio strength vs BTC came before ETH’s surge.
The distinction: XRP broke out after regulatory clarity, unlike BTC in 2021, which surged first and then faced challenges.
________________________
7) Volume Analysis
- Elevated volume through the 2023–2024 base.
- Explosive volume during Q3–Q4 2024 breakout.
- Healthy, consistent participation during Q1 2025 consolidation.
- Renewed interest into Q2–Q3 2025.
This mirrors institutional accumulation profiles in traditional markets during secular shifts.
________________________
8) Long-term Investment Perspective
From a value perspective, the XRP/BTC ratio suggests:
- Base Length: Nearly a year before breakout.
- Breakout Magnitude: More than doubled vs BTC.
- Consolidation Quality: Higher lows held above resistance.
- Regulatory Timing: Breakout followed, not preceded, clarity.
This aligns with the principle that the market is now “weighing” XRP’s improved fundamentals.
________________________
9) Risks to Monitor
- Correlation: XRP still linked to crypto market flows.
- RSI 82: Signals potential near-term overextension.
- ETF uncertainty: Approval timelines could sway sentiment.
- Invalidation levels: A quarterly close back inside Bollinger bands (USD) or sustained loss of 0.000020–0.000022 (BTC ratio).
________________________
10) Conclusion
Both the quarterly USD breakout and the XRP/BTC ratio strength point to a structural, early-to-mid cycle revaluation rather than late-cycle froth.
For long-term investors, this resembles the early stages of prior secular breakouts (Bitcoin 2015–2017, Ethereum 2016–2017, Gold 2006). While corrections of 30–40% are likely along the way, the structural thesis remains intact as long as the quarterly patterns hold.
________________________
Not financial advice. Extracted directly from TrendSpider Sidekick analysis (Warren, the Long Term Investor).
The quarterly chart for XRP confirms a powerful technical setup:
- A classic Bollinger Band breakout on this long timeframe.
- RSI at 82, indicating extremely strong momentum.
- The quarterly candle closed significantly above the upper band, pulled back to test it, and is now pushing higher again.
- This is the exact type of pattern that has historically preceded major multi-year bull markets in other assets.
Quarterly Data
- Q3 2024: Closed at $2.08 (massive breakout quarter).
- Q4 2024: Closed at $2.09 (consolidation at resistance).
- Q1 2025: Closed at $2.24 (reaffirmation of trend).
- Q2 2025: Closed at $2.82 (continued expansion).
________________________
2) Historical Precedents and Outcomes
- Nasdaq (1999): Led to a 5-year rally before a significant correction.
- Gold (2006): Preceded a multi-year rally into 2011.
- Bitcoin (2017): Sparked a 3-year bull market cycle.
The failed examples:
- Oil (2008): Collapsed due to global recession and demand destruction.
- Bitcoin (2021): Failed due to excessive leverage and lack of regulatory clarity.
Key Insight: Sustained precedents coincided with fundamental shifts (tech adoption, central bank easing, institutional crypto entry). Failures were tied to crises or regulatory headwinds.
________________________
3) XRP’s Fundamental Context
XRP stands apart from failed cases because:
- It now has regulatory clarity that Bitcoin lacked in 2021.
- There is potential ETF approval, which could bring institutional flows.
- The financial industry continues to explore blockchain-based payment solutions.
________________________
4) Long-term Value Perspective
- Volume Confirmation: Breakout quarters showed 6–16bn vs prior lower levels, consistent with accumulation.
- Regulatory Sequenance: Momentum followed clarity, unlike Bitcoin 2021.
- Relative Valuation: Despite momentum, XRP hasn’t shown the euphoric valuations typical of late-cycle blow-offs.
Benjamin Graham’s principle applies: “The market is a voting machine in the short run, but a weighing machine in the long run.” The market here seems to be weighing XRP’s improved fundamentals.
________________________
5) XRP/BTC Ratio Analysis – Structural Strength
Looking at the XRP/BTC pair adds critical confirmation:
- Bottoming (2023–2024): Ratio held around 0.000007–0.000008 BTC.
- Breakout (Q3–Q4 2024): Jumped to 0.000022 (≈129% vs BTC).
- Consolidation (Q1 2025): Formed higher base at 0.000020–0.000025.
- Continuation (Q2 2025): Held 0.000026 despite Bitcoin’s own strength.
This is a textbook basing → breakout → consolidation → continuation pattern on a quarterly ratio chart — much stronger evidence than USD price alone.
________________________
6) Comparative Historical Context
- Bitcoin 2015–2017: Similar long-term basing before secular breakout.
- Ethereum 2016–2017: Ratio strength vs BTC came before ETH’s surge.
The distinction: XRP broke out after regulatory clarity, unlike BTC in 2021, which surged first and then faced challenges.
________________________
7) Volume Analysis
- Elevated volume through the 2023–2024 base.
- Explosive volume during Q3–Q4 2024 breakout.
- Healthy, consistent participation during Q1 2025 consolidation.
- Renewed interest into Q2–Q3 2025.
This mirrors institutional accumulation profiles in traditional markets during secular shifts.
________________________
8) Long-term Investment Perspective
From a value perspective, the XRP/BTC ratio suggests:
- Base Length: Nearly a year before breakout.
- Breakout Magnitude: More than doubled vs BTC.
- Consolidation Quality: Higher lows held above resistance.
- Regulatory Timing: Breakout followed, not preceded, clarity.
This aligns with the principle that the market is now “weighing” XRP’s improved fundamentals.
________________________
9) Risks to Monitor
- Correlation: XRP still linked to crypto market flows.
- RSI 82: Signals potential near-term overextension.
- ETF uncertainty: Approval timelines could sway sentiment.
- Invalidation levels: A quarterly close back inside Bollinger bands (USD) or sustained loss of 0.000020–0.000022 (BTC ratio).
________________________
10) Conclusion
Both the quarterly USD breakout and the XRP/BTC ratio strength point to a structural, early-to-mid cycle revaluation rather than late-cycle froth.
For long-term investors, this resembles the early stages of prior secular breakouts (Bitcoin 2015–2017, Ethereum 2016–2017, Gold 2006). While corrections of 30–40% are likely along the way, the structural thesis remains intact as long as the quarterly patterns hold.
________________________
Not financial advice. Extracted directly from TrendSpider Sidekick analysis (Warren, the Long Term Investor).
Trade active
Remember: Sidekick can't see the future it can only see the full data as it exists up until that point. Please remember to do your own research as always. That notwithstanding the strength of XRP vs ETH and BTC has stayed quite well in this sudden dip - which may have been triggered by the strike on Doha.I'm remaining in my unleveraged position unless I see obvious bad signs.
Trade closed manually
Just sold 25% to take a shot at accumulating more if the dip goes deeper.Remember, NFA.
Disclaimer
The information and publications are not meant to be, and do not constitute, financial, investment, trading, or other types of advice or recommendations supplied or endorsed by TradingView. Read more in the Terms of Use.
Disclaimer
The information and publications are not meant to be, and do not constitute, financial, investment, trading, or other types of advice or recommendations supplied or endorsed by TradingView. Read more in the Terms of Use.