☃️ Welcome to the cryptos winter , I hope you’ve started your day well.
⏰ We’re analyzing XRP on the 1-Day timeframe .
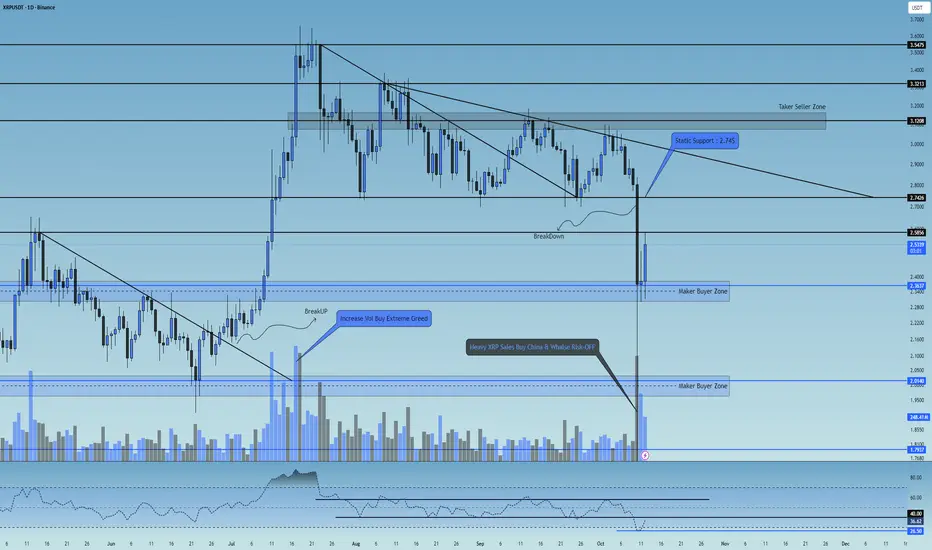
👀 On the daily timeframe of Ripple (XRP), we can see that — for this analysis — I decided to share my perspective from left to right across the chart.
From mid-May to late June, Ripple was trading below a descending dynamic resistance trendline, which it successfully broke to the upside, rallying from $2 to $3.5. In that area, heavy profit-taking occurred, pushing the price downward. The first major support after that sharp rally was at $2.74.
Later, Ripple formed a lower high at $3.23 and a double bottom (equal low) around $2.74, which created a strong static support and positioned the price within the final third of its triangle pattern. It then broke its dynamic trendline resistance again and managed to make a higher high, but this time it failed to show the same sharp bullish momentum. It was quickly rejected from $3.1, which was a taker-seller zone, and pulled back toward its static support.
Buyers didn’t allow the key floor to break — they defended the level aggressively, pouring in additional liquidity to keep XRP above support. However, since no major new capital inflow entered the market and Ripple remained compressed within multiple overlapping triangle formations, a new dynamic resistance was formed. Even with intense effort from buyers, that resistance couldn’t be broken, and eventually, Ripple lost its key static support at $2.74 and dropped further.
Although this move was technically predictable, the speed and depth of the fall were hard to manage in real time. Now, Ripple is sitting above a strong buyer-maker support zone, and much of the selling volume is being absorbed by buybacks. Retail traders are also accumulating again.
The interesting point: Ripple has a critical resistance at $2.58 — if it breaks and holds above this level, it can reignite a bullish move upward. The main resistance zone remains the same old static support area that buyers previously tried hard to protect. Once the $2.74 level is broken back to the upside, Ripple could experience a strong pump.
🧮 On the daily RSI oscillator, Ripple had a very strong static resistance zone around 62, and on its last touch it got heavily rejected, dropping below 50 and 30 without much resistance. Currently, RSI has a support around 26.5 and a key resistance around 40 — these are the main RSI pivot levels. If Ripple’s RSI breaks out of this range, it can trigger higher volatility and momentum aligned with the market direction.
🕯 The recent candle structures — especially the large bearish candle with a long lower wick — caused panic and FOMO among Ripple holders. This led many institutions and big wallets to switch into risk-off mode, dumping their XRP positions and causing a 50% crash within hours.
However, Ripple has recovered well, and the last two bullish candles came with solid buying volume, likely supported by the RSI exiting its oversold zone. With continued buying volume and a break above the key taker-seller resistance at $2.58, Ripple could resume its upward movement.
🧠 If we held Ripple — what would we do?
Personally, if I owned XRP right now, I’d strictly follow capital and risk management, avoiding emotional decisions driven by fear or greed. Ripple is currently forming a new trading range with tight highs and lows, meaning that breaking either boundary will likely start the next major leg of movement.
The upcoming week, especially with the meeting between Trump and the Chinese President, could significantly impact risk markets.
So for now, I’d do nothing major — and if I decided to open a position, I’d do it with minimal risk (and yes, I call that “a bad habit” on purpose 🙂).
This scenario will be updated with more precision and detail in future analyses.
❤️ Disclaimer : This analysis is purely based on my personal opinion and I only trade if the stated triggers are activated .
⏰ We’re analyzing XRP on the 1-Day timeframe .
👀 On the daily timeframe of Ripple (XRP), we can see that — for this analysis — I decided to share my perspective from left to right across the chart.
From mid-May to late June, Ripple was trading below a descending dynamic resistance trendline, which it successfully broke to the upside, rallying from $2 to $3.5. In that area, heavy profit-taking occurred, pushing the price downward. The first major support after that sharp rally was at $2.74.
Later, Ripple formed a lower high at $3.23 and a double bottom (equal low) around $2.74, which created a strong static support and positioned the price within the final third of its triangle pattern. It then broke its dynamic trendline resistance again and managed to make a higher high, but this time it failed to show the same sharp bullish momentum. It was quickly rejected from $3.1, which was a taker-seller zone, and pulled back toward its static support.
Buyers didn’t allow the key floor to break — they defended the level aggressively, pouring in additional liquidity to keep XRP above support. However, since no major new capital inflow entered the market and Ripple remained compressed within multiple overlapping triangle formations, a new dynamic resistance was formed. Even with intense effort from buyers, that resistance couldn’t be broken, and eventually, Ripple lost its key static support at $2.74 and dropped further.
Although this move was technically predictable, the speed and depth of the fall were hard to manage in real time. Now, Ripple is sitting above a strong buyer-maker support zone, and much of the selling volume is being absorbed by buybacks. Retail traders are also accumulating again.
The interesting point: Ripple has a critical resistance at $2.58 — if it breaks and holds above this level, it can reignite a bullish move upward. The main resistance zone remains the same old static support area that buyers previously tried hard to protect. Once the $2.74 level is broken back to the upside, Ripple could experience a strong pump.
🧮 On the daily RSI oscillator, Ripple had a very strong static resistance zone around 62, and on its last touch it got heavily rejected, dropping below 50 and 30 without much resistance. Currently, RSI has a support around 26.5 and a key resistance around 40 — these are the main RSI pivot levels. If Ripple’s RSI breaks out of this range, it can trigger higher volatility and momentum aligned with the market direction.
🕯 The recent candle structures — especially the large bearish candle with a long lower wick — caused panic and FOMO among Ripple holders. This led many institutions and big wallets to switch into risk-off mode, dumping their XRP positions and causing a 50% crash within hours.
However, Ripple has recovered well, and the last two bullish candles came with solid buying volume, likely supported by the RSI exiting its oversold zone. With continued buying volume and a break above the key taker-seller resistance at $2.58, Ripple could resume its upward movement.
🧠 If we held Ripple — what would we do?
Personally, if I owned XRP right now, I’d strictly follow capital and risk management, avoiding emotional decisions driven by fear or greed. Ripple is currently forming a new trading range with tight highs and lows, meaning that breaking either boundary will likely start the next major leg of movement.
The upcoming week, especially with the meeting between Trump and the Chinese President, could significantly impact risk markets.
So for now, I’d do nothing major — and if I decided to open a position, I’d do it with minimal risk (and yes, I call that “a bad habit” on purpose 🙂).
This scenario will be updated with more precision and detail in future analyses.
❤️ Disclaimer : This analysis is purely based on my personal opinion and I only trade if the stated triggers are activated .
🔥 Join the Action Now 🔥
☄️ Telegram
t.me/FireHoseReel
☄️ Trade & Earn
bitunix.com/register?inviteCode=28r21f
☄️ Telegram
t.me/FireHoseReel
☄️ Trade & Earn
bitunix.com/register?inviteCode=28r21f
Related publications
Disclaimer
The information and publications are not meant to be, and do not constitute, financial, investment, trading, or other types of advice or recommendations supplied or endorsed by TradingView. Read more in the Terms of Use.