Gold Selloff - Why Gold Is Pulling Back After a Parabolic MoveIn my view, the sharp selloff in gold is neither an accident nor a market anomaly, but a natural reaction after parabolic moves driven almost entirely by momentum. This had become a crowded trade, with increasing amounts of capital rotating in from other asset classes not because of strong fundamental conviction, but out of fear of missing the trend. In such environments, even a minor shift in news flow or perception is enough to trigger a violent correction.
The catalyst, in my opinion, was a shift in monetary-policy expectations: the appointment of a Fed chair perceived as responsible and independent reduced fears that the dollar would be deliberately debased through artificially lower interest rates. The immediate strength in the dollar confirms this change in sentiment, while gold is highly sensitive to such expectations — reacted in the opposite direction through rapid capital outflows.
What we are seeing now looks more like a forced pause in the trend rather than a complete invalidation of the medium-term thesis. That said, the structure of the move is consistent with potential blow-off tops: excessive acceleration followed by an abrupt correction. Whether this proves to be a major top or not will only be clear in hindsight, but it would not surprise me if gold remain under pressure for some time as speculative positions continue to unwind.
Over the longer term, I still believe gold has a legitimate role in a portfolio as a counter-cyclical asset and a hedge.
The gold selloff may continue in the short term, as speculative positions are still being liquidated and the market digests the shift in monetary policy expectations. The correction does not automatically invalidate the long-term thesis, but it suggests that gold needs time—and probably lower prices—before it can build a base for a potential resumption of the trend.
Group

AR Antero Resources Bullish Bets in the Options Market! PT: $40Macro Catalyst: Winter Storm Fern:
The severe storm has disrupted U.S. gas supply, cutting production by 9–15% and boosting demand. For AR, focused on Appalachian gas, this spells direct upside as exports and heating needs spike.
Technicals:
AR held support above $34, with recent highs at $35.51. Volume topped 3.69M shares. A bullish pennant pattern suggests a breakout past $35.50–36 could target $37–38, accelerating to $40 post-earnings. EPS growth hit +472% Q/Q, limiting downside (support at $32–30).
Options Flow: Heavy Bullish Bets:
Sentiment screams bullish: $105M call premiums vs. minimal puts, volumes 6.8x daily average. Key unusual activity on long-dated calls:
Massive blocks on Feb 2026 $37 strikes (35k+ contracts, $2.6M–$8.6M premium)
Mar 2026 $38/$39 strikes with sweeps (40k/3k contracts)
Recent Mar $39 calls at $0.85
IV at 41–48%, high heat score signals aggressive upside plays. Dark pool blocks (e.g., 1.17M shares ~$40M) show smart money accumulating quietly.
Analyst Consensus: Strong Buy with Upside!
15 analysts rate Buy overall (9 Buy, 7 Hold, 2 Strong Buy), average target $44.33 (~29% upside). Wells Fargo at $46, Siebert at $48; optimists see $60. Stable BBB- ratings from Fitch/S&P. Expect ~$500M FCF boost from recent acquisitions like HG Energy.
Outlook: $40 Feasible!
Volatility in gas prices and post-storm corrections are risks, plus options decay without quick moves.
But with insider buying, earnings positioning, and flow momentum, $40 looks realistic post-report – a ~16% gain aligning with key strikes!

TheGrove | USDJPY Buy | Idea Trading AnalysisUSDJPY is falling towards a support level which is a pullback support and could bounce from this level to our take profit.
We expect a decline in the channel after testing the current level which suggests that the price will continue to rise
Hello Traders, here is the full analysis.
I think we can soon see more fall from this range! GOOD LUCK! Great BUY opportunity USDJPY
I still did my best and this is the most likely count for me at the moment.
-------------------
Traders, if you liked this idea or if you have your own opinion about it, write in the comments. I will be glad 🤝

2026 Price Target for SPY: $790 – Why the S&P 500 Could Soar 15%If you haven`t bought the dip on SPY last year:
Why my Price Target is $790 for SPY? Key Drivers for 2026!
Earnings Growth Acceleration:
Analysts expect S&P 500 EPS to grow 12–15% in 2026 (Goldman Sachs: 12%; FactSet consensus: ~14.9%). This builds on the AI-driven productivity boom and resilient consumer spending. If AI adoption accelerates (as seen in Meta, Nvidia, and Microsoft earnings), we could see 15–18% EPS growth—pushing multiples higher in a low-rate environment.
Fed Policy Tailwinds:
With inflation cooling (core PCE at ~2.8% in November, in line with expectations) and the economy strong (Q3 2025 GDP revised to +4.4%), the Fed is likely to deliver 1–2 more rate cuts in 2026. Lower rates support valuations and boost corporate borrowing/profits—classic bull-market fuel.
Geopolitical & Policy Clarity:
Trump's recent backtrack on aggressive tariffs (U-turn on 10–25% threats to NATO allies and Greenland deal) has eased fears. Combined with potential fiscal stimulus and deregulation, this creates a pro-growth backdrop. Midterm elections could add volatility, but history shows markets often "pump" post-election.
Valuation Expansion Potential:
The forward P/E is ~22x—elevated but justified by AI productivity gains. If earnings beat expectations and rates fall, multiples could stretch to 24–25x (similar to past tech-led cycles), supporting my higher target.
Comparison to Wall Street ConsensusWall Street targets for the S&P 500 end-2026 range widely:
Conservative: Bank of America ~7,100 (3–4% upside)
Average: ~7,269–7,600 (6–11% upside)
Bullish: Oppenheimer 8,100; Deutsche Bank 8,000; Goldman Sachs ~12% total return
My $790 SPY target sits on the bullish side (~15% upside), assuming stronger-than-expected earnings and policy support. It's not moonshot territory (some outliers see 8,000+), but it requires the rally to broaden beyond Big Tech.
Risks to Watch:
Tariff resurgence or trade wars could cap gains.
Inflation reacceleration might delay Fed cuts.
AI spending disappointment → valuation compression.
Volatility spikes around elections or macro data.
Still, the base case remains bullish: resilient economy, AI tailwinds, and supportive policy. SPY at $790 would mark another strong year in this bull run.

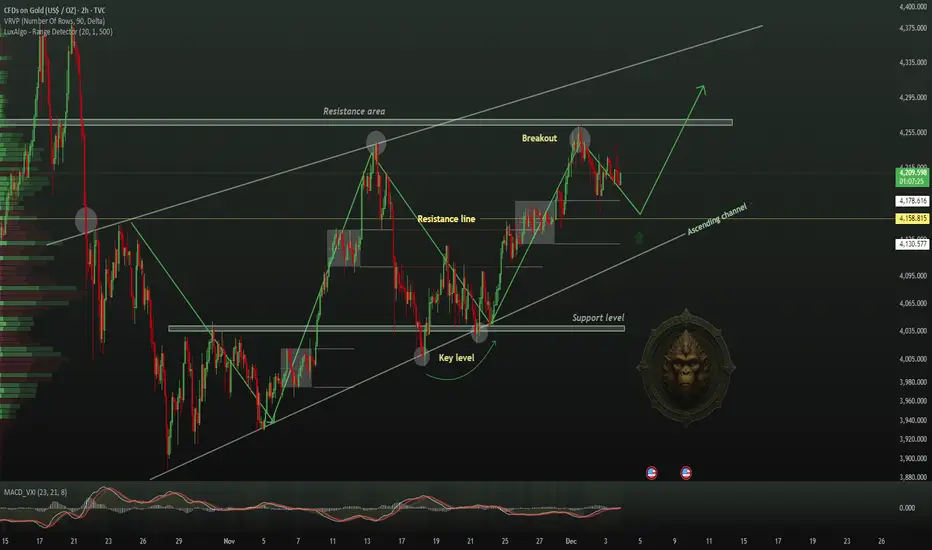
GOLD BUY | Idea Trading AnalysisGOLD is moving in an ascending channel and creating symmetrical triangle and is moving in a descending AND is moving in an UPWARD channel.
We expect a decline in the channel after testing the current level.
Hello Traders, here is the full analysis.
I think we can soon see more fall from this range! GOOD LUCK! Great BUY opportunity GOLD
I still did my best and this is the most likely count for me at the moment.
-------------------
Traders, if you liked this idea or if you have your own opinion about it, write in the comments. I will be glad
MRK Merck On the Verge of a Breakout? Unusual Calls !!Merck (MRK) is setting up for what could be a high-probability breakout. The stock has been in a falling wedge pattern for several months — a classic technical formation that often precedes sharp upside moves. Price action has now compressed to the end of the wedge, and we may be on the brink of a bullish resolution.
🔍 Technical Setup
Falling Wedge Pattern nearing completion
Price currently hovering near long-term support ($78.25)
Strong bullish divergence forming on momentum indicators (RSI/MACD)
The falling wedge is typically a reversal pattern, and given how deep MRK has pulled back from its highs ($134+), the risk/reward here looks compelling.
🔥 Options Flow
Today’s options market added fuel to the fire:
48,000 call contracts traded expiring this Friday
This sudden surge in short-dated call buying signals aggressive positioning for an imminent move
This kind of volume is not retail-driven — it points to potential institutional interest
💡 The Bullish Case
With the technical breakout structure in place and strong confirmation from options flow, the case for a bullish reversal is growing. If MRK can close above wedge resistance with volume, it opens the door to a quick move toward $85+, possibly even higher in the coming weeks.
Disclosure: I am part of Trade Nation's Influencer program and receive a monthly fee for using their TradingView charts in my analysis.

BTC Bitcoin & Crypto Selloff Alert: Is a Second Wave Imminent?If you haven`t bought BTC before the rally:
The cryptocurrency market is still reeling from the brutal sell-off on Friday, October 10, 2025, triggered by U.S. President Donald Trump's announcement of 100% tariffs on Chinese imports. Bitcoin plummeted below $105,000, Ethereum dropped over 16% to under $3,700, and the broader market saw liquidations exceeding $19 billion—the largest single-day wipeout in crypto history, nine times bigger than February 2025's crash.
While Monday and Tuesday brought some recovery, with Bitcoin climbing back above $115,000 and the total market cap topping $4 trillion, underlying issues like inflated trading volumes, massive altcoin losses, and a prominent whale re-entering a short position suggest this might just be a dead-cat bounce. This article explores why a second leg down could be imminent, incorporating technical analysis for TradingView users eyeing volatility plays.
The Friday Flash Crash: A Perfect Storm Amplified by Fake Volumes
The October 10 crash unfolded rapidly, with Bitcoin shedding nearly 10% in hours and over $200 billion erased from the market cap. But what made the drop so severe, especially for altcoins?
A key culprit: fake trading volumes driven by wash trading. Wash trading, where traders buy and sell the same asset to themselves to inflate volumes, creates the illusion of liquidity and interest without real economic activity. Estimates suggest that up to 87-88% of crypto volumes are fake, often used in pump-and-dump schemes or to lure retail investors.
In thin markets like crypto, these artificial volumes mask true liquidity. When real selling pressure hit—amplified by leveraged positions and the tariff news—exchanges like Binance saw cascading liquidations due to flawed margin systems. This "flash crash" wiped out $600–900 million in longs alone, but the fake volumes meant the market couldn't absorb the shock, leading to exaggerated drops.
Analysts note that such illusions persist in 2025, with AI tools now exposing them, but regulators lag behind. If volumes remain overstated, any renewed catalyst could trigger another liquidity vacuum, setting up a second leg down.
Altcoin Bloodbath: 50–90% Drops Expose Vulnerabilities
While Bitcoin and Ethereum recovered somewhat, altcoins bore the brunt of the carnage. An index tracking altcoins (excluding BTC, ETH, and stablecoins) cratered about 33% in just 25 minutes, with some tokens plunging 50–90%. Tokens like Solana, XRP, and Dogecoin lost 20–60%, but lesser-known altcoins saw even steeper declines, highlighting the sector's over-leveraged and illiquid nature.
This disproportionate pain stems from altcoins' reliance on hype and speculative inflows, often propped up by those same fake volumes. In a risk-off environment, capital flees to safer assets like Bitcoin, whose dominance spiked during the crash.
Altseason indicators are now cooling (76–78 previously).
Bitcoin dominance dropped below 59% post-crash.
If earnings season in traditional markets reveals economic weakness, spilling over to crypto, altcoins could lead the next sell-off wave, potentially dropping another 20–50% if support levels break.
The Whale Factor: $192M Profit, Then Re-Entry Signals Bearish Conviction
Adding fuel to the fire is a mysterious crypto whale who timed the crash impeccably. Just 30 minutes before Trump's tariff announcement, this entity opened a massive short position on Bitcoin, pocketing $192 million in profits as the market tanked.
Speculation abounds: Was it insider knowledge, or just savvy trading? Either way, the whale didn't stop there—they've re-entered with another short, increasing their position to $340 million, and even opened a fresh $163 million bearish bet.
Other whales have followed suit, including:
A Satoshi-era entity shorting $1.1 billion before the news
An OG whale opening a $392 million short
These moves suggest high conviction in further declines, possibly tied to ongoing trade tensions or macroeconomic risks. In a market where whales can move prices, this re-entry could catalyze the second leg, especially if it triggers more liquidations.
My price target for Bitcoin is $95K

AAPL Apple Options Ahead of EarningsIf you haven`t bought the dip on AAPL:
Now analyzing the options chain and the chart patterns of AAPL Apple prior to the earnings report this week,
I would consider purchasing the 255usd strike price Calls with
an expiration date of 2025-11-21,
for a premium of approximately $18.65.
If these options prove to be profitable prior to the earnings release, I would sell at least half of them.

BYD Boyd Gaming Corporation Options Ahead of EarningsAnalyzing the options chain and the chart patterns of BYD Boyd Gaming Corporation prior to the earnings report this week,
I would consider purchasing the 95usd strike price Calls with
an expiration date of 2025-12-19,
for a premium of approximately $0.82.
If these options prove to be profitable prior to the earnings release, I would sell at least half of them.

MOONPIG Is Taking Off — Thanks to James Wynn’s Viral CloutThe James Wynn Phenomenon:
James Wynn, a crypto trader who turned $4 million into $100 million before losing nearly all of it in leveraged Bitcoin futures, has become a polarizing figure in the crypto space. His massive trades, including a $1.2 billion Bitcoin long position that ended in a $17.5 million loss and a subsequent $1 billion short position with 40x leverage, have made him a viral sensation. Despite these setbacks, Wynn’s resilience and bold moves keep him in the spotlight, with thousands of traders and investors following his every step.
Wynn’s fame stems not just from his trading but from his ability to move markets. His posts on X, where he boasts a significant following, often trigger rapid price movements in the assets he mentions. This influence is now centered on $MOONPIG, a Solana-based meme coin that’s gaining traction thanks to his vocal support.
$MOONPIG: A Meme Coin with Momentum:
$MOONPIG, a meme coin built on the Solana blockchain, has seen its price surge by as much as 80% following Wynn’s endorsements, though it’s also faced volatility with a 30% drop in 24 hours and a 60% decline from its all-time high. Despite these fluctuations, the coin’s community-driven narrative and Wynn’s backing make it a compelling speculative play.
Wynn’s posts on X reveal his belief in $MOONPIG’s potential to be the “next SafeMoon” of this cycle, predicting a run to a billion-dollar market cap. He’s emphasized its appeal to retail investors, calling it “normie-friendly” and highlighting its strong community as a key driver. This narrative aligns with the meme coin mania that often propels tokens like CRYPTOCAP:DOGE or CRYPTOCAP:SHIB to explosive gains during bullish market phases.
Why I’m Bullish:
Wynn’s Influence as a Catalyst: Wynn’s fame amplifies $MOONPIG’s visibility. His posts on X, such as one claiming he transferred profits to the $MOONPIG reserves wallet, signal commitment and attract attention. When Wynn speaks, traders listen, and his endorsements have already driven significant price action, with one instance sparking an 80% surge.
Community Strength: Wynn has emphasized $MOONPIG’s community-driven ethos, stating it “doesn’t need KOLs or BS” and thrives on organic support. In the meme coin space, strong communities can sustain momentum, as seen with tokens like CRYPTOCAP:PEPE , which Wynn also supports.
Market Timing: With Bitcoin hitting new highs and retail interest flooding back into crypto, $MOONPIG is well-positioned to ride the wave. Wynn’s thesis that retail investors will soon pour into altcoins aligns with current market sentiment, making $MOONPIG a potential beneficiary.
Speculative Upside: Meme coins thrive on hype, and $MOONPIG’s low market cap relative to its potential—analysts like @KookCapitalLLC
speculate a $1 billion valuation—offers significant upside for early investors. Even after recent pullbacks, the coin’s volatility suggests opportunities for traders who can stomach the risk.
MLong

GameStop (GME) Is the New MSTR — And It Might Moon Harder ! If you haven`t bought the dip on GME:
Now You need to know that GameStop (GME) is the new MSTR MicroStrategy — But With Meme Power!
GME GameStop just made its boldest move yet: the company revealed it has purchased 4,710 Bitcoin, officially entering the crypto game in a serious way. While it hasn’t disclosed the total price paid, the intent is loud and clear — GameStop is transforming into a Bitcoin-holding company, just like MicroStrategy (MSTR) did back in 2020.
This isn’t just about hype. In March, GameStop raised $1.3 billion through a convertible note offering, specifically to help fund Bitcoin purchases. It also updated its investment policy to formally add Bitcoin as a reserve asset — the same exact strategy that led to MicroStrategy’s 10x stock explosion.
But here’s the twist: GameStop brings more than just Bitcoin exposure — it brings meme momentum. Unlike MicroStrategy, which had to win over the market, GME already has an army of loyal retail traders, massive online visibility, and a cultural legacy as the original meme stock. If MicroStrategy was the corporate face of Bitcoin adoption, GameStop is the internet’s version — louder, faster, and potentially more explosive.
Yes, the stock dipped on the announcement — typical for big moves like this — but long-term, the upside is undeniable. Bitcoin on the balance sheet gives GME new life, and volatility is GameStop’s comfort zone. With Bitcoin becoming a political and financial flashpoint — highlighted by major figures like JD Vance and Donald Trump Jr. attending the 2025 Bitcoin conference — GME’s move couldn’t be more timely.
This is more than a pivot. It’s a power play. GameStop is no longer just a nostalgia-fueled retailer — it’s a digital asset powerhouse in the making.
If you missed MicroStrategy’s rise, GameStop might just be your second chance — with even more firepower behind it.
Disclosure: I am part of Trade Nation's Influencer program and receive a monthly fee for using their TradingView charts in my analysis.
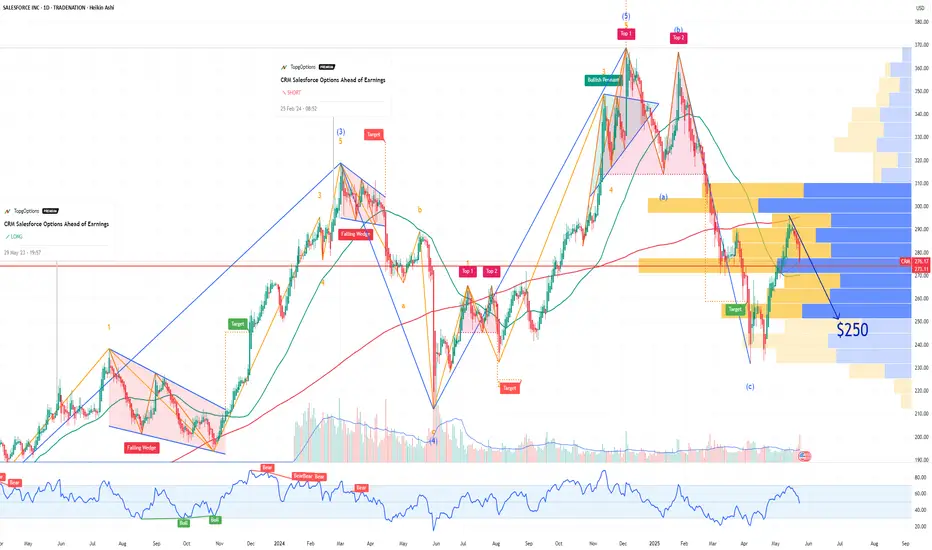
CRM Salesforce Options Ahead of EarningsIf you haven`t bought CRM before this rally:
nor sold this top:
Now analyzing the options chain and the chart patterns of CRM Salesforce prior to the earnings report this week,
I would consider purchasing the 250usd strike price Puts with
an expiration date of 2025-6-20,
for a premium of approximately $5.15.
If these options prove to be profitable prior to the earnings release, I would sell at least half of them.
Disclosure: I am part of Trade Nation's Influencer program and receive a monthly fee for using their TradingView charts in my analysis.
GEO The GEO Group Options Ahead of Earnings If you haven`t bought the dip on GEO:
Now analyzing the options chain and the chart patterns of GEO The GEO Group prior to the earnings report this week,
I would consider purchasing the 26usd strike price Calls with
an expiration date of 2025-4-17,
for a premium of approximately $3.10.
If these options prove to be profitable prior to the earnings release, I would sell at least half of them.

AMZN Amazon Options Ahead of EarningsIf you haven`t bought AMZN before the previos earnings:
Now analyzing the options chain and the chart patterns of AMZN Amazon prior to the earnings report this week,
I would consider purchasing the 240usd strike price Calls with
an expiration date of 2025-2-7,
for a premium of approximately $6.40.
If these options prove to be profitable prior to the earnings release, I would sell at least half of them.

TLRY Tilray Brands Options Ahead of EarningsAnalyzing the options chain and the chart patterns of TLRY Tilray Brands prior to the earnings report this week,
I would consider purchasing the 2usd strike price Calls with
an expiration date of 2025-6-20,
for a premium of approximately $0.32.
If these options prove to be profitable prior to the earnings release, I would sell at least half of them.

EURJPY BUY | Potential Upsides | LONGEURJPY is moving in an UP trend channel.
The chart broke through the dynamic Resistance line, which now acts as support.
We expect a decline in the channel after testing the current level which suggests that the price will continue to rise
Hello Traders, here is the full analysis.
I think we can soon see more fall from this range! GOOD LUCK! Great BUY opportunity EURJPY
I still did my best and this is the most likely count for me at the moment.
-------------------
Traders, if you liked this idea or if you have your own opinion about it, write in the comments. I will be glad

QQQ Nasdaq 100 ETF 2025 Prediction - My Top 10 PicksIf you haven`t bought the recent dip on QQQ:
My price target for QQQ in 2025 is $608, driven by the following fundamental factors:
Strong Growth Potential in Technology:
The QQQ ETF is heavily weighted towards technology companies, which are at the forefront of innovation and growth. Major constituents like Apple, Microsoft, and NVIDIA are not only leaders in their respective fields but are also expected to benefit from ongoing trends such as artificial intelligence, cloud computing, and digital transformation. Analysts project that the earnings growth for QQQ constituents will outpace that of broader market indices, with estimated one-year earnings growth rates around 17.31%. This growth trajectory supports a bullish outlook as these companies continue to expand their market share and profitability.
Favorable Macroeconomic Conditions:
Recent Federal Reserve actions, including interest rate cuts, create a conducive environment for growth stocks. The Fed's dovish stance is likely to lower borrowing costs and stimulate investment in technology sectors. As interest rates decline, the present value of future earnings increases, making high-growth tech stocks more attractive. The anticipated economic recovery and stabilization should further enhance investor sentiment towards QQQ.
Historical Performance and Resilience:
Historically, QQQ has outperformed the S&P 500 in bull markets, showcasing its resilience during periods of economic expansion. Over the past decade, QQQ has delivered an average annual return of approximately 18.59%, significantly outpacing many other investment vehicles. This historical performance suggests that as market conditions improve, QQQ is well-positioned to capitalize on renewed investor interest in growth stocks.

PLTR Palantir Technologies Options Ahead of EarningsIf you haven`t bought PLTR before the major breakout:
Now analyzing the options chain and the chart patterns of PLTR Palantir Technologies prior to the earnings report this week,
I would consider purchasing the 42usd strike price Puts with
an expiration date of 2024-11-15,
for a premium of approximately $3.07.
If these options prove to be profitable prior to the earnings release, I would sell at least half of them.
PShort

APLD Applied Digital Corporation Options Ahead of EarningsIf you haven`t bought the dip on APLD:
Now analyzing the options chain and the chart patterns of APLD Applied Digital Corporation prior to the earnings report this week,
I would consider purchasing the 9usd strike price Calls with
an expiration date of 2024-11-15,
for a premium of approximately $1.10.
If these options prove to be profitable prior to the earnings release, I would sell at least half of them.

AYI Acuity Brands Options Ahead of EarningsAnalyzing the options chain and the chart patterns of AYI Acuity Brands prior to the earnings report this week,
I would consider purchasing the 260usd strike price Puts with
an expiration date of 2024-10-18,
for a premium of approximately $8.75.
If these options prove to be profitable prior to the earnings release, I would sell at least half of them.

MSFT Microsoft Corporation Options Ahead of EarningsIf you haven't entered MSFT when they bought a stake in OpenAI, the creator of ChatGPT:
Now analyzing the options chain and the chart patterns of MSFT Microsoft Corporation prior to the earnings report this week,
I would consider purchasing the 460usd strike price Calls with
an expiration date of 2024-11-15,
for a premium of approximately $13.05.
If these options prove to be profitable prior to the earnings release, I would sell at least half of them.

PULTE GROUP (PHM), THIS DUDE GIVES AWAY LOTS OF MONEYYou can follow the ceo on twitter.
He often has live streams where he obviously talks about his company among other things.
He also gives away a lot of money. It seems he genuinely cares and enjoys giving away money. It seems partly for his image, but imo, he created a win/win. With the amount of money he has given away, he's earned some good publicity.
(I've never received money as a disclaimer, I mention this because a lot of his twitter feed is about giving)
He talks about GME and BBBY often.
Flys a chopper.
Won't give me a ride.
For his stock.
Honestly, he seems awesome, but his stock is getting to the scary zone.
Now, I say this because even though it is a scary zone, there is a lot of potential upside momentum can carry the price to.
So, earnings on the 23th is important to note.
It will likely have an effect on price. I assume from the looks of things, price might see a decent upside movement to 125-145 range and then see a significant downside before recovery.
I think I labeled most of the important things on the chart.

WOOF Petco Health and Wellness Company Options Ahead of EarningsIf you haven`t sold WOOF before the previous earnings:
Then analyzing the options chain and the chart patterns of WOOF Petco Health and Wellness Company prior to the earnings report this week,
I would consider purchasing the 3usd strike price Puts with
an expiration date of 2024-4-19,
for a premium of approximately $0.57.
If these options prove to be profitable prior to the earnings release, I would sell at least half of them.
Looking forward to read your opinion about it.
