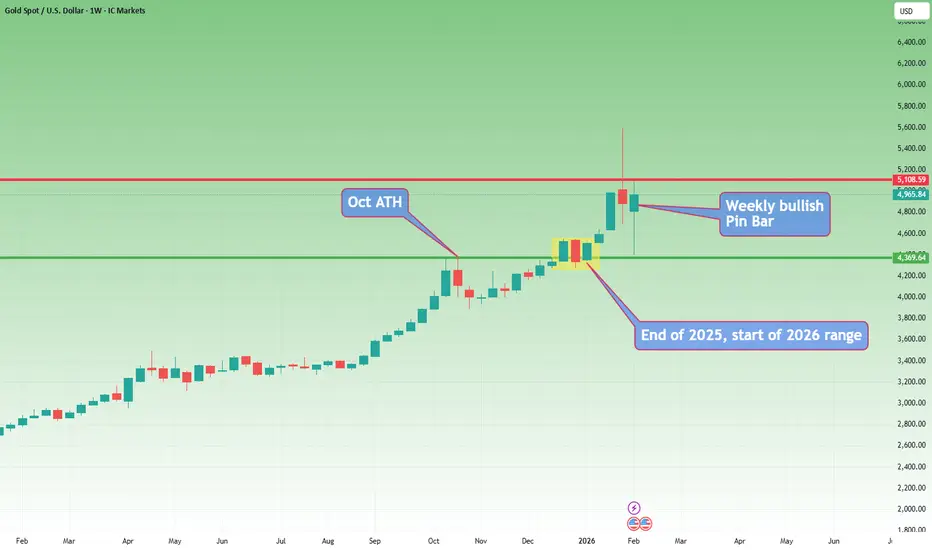
Gold- From weekly to 15m chart. Where are the trades?These days, everyone has an opinion on Gold.
Most of them are bullish.
And to be fair — so am I.
But here is what many traders either don’t understand or simply ignore:
There is a huge difference between having an opinion and having a tradable opinion.
A tradable opinion is one that can actually be executed in the market, with leverage, risk control, and realistic stops — not just a direction on a chart.
This analysis is not about saying “Gold is bullish, it will go to 6k or 7k, I’m a genius if it does.”
It’s about giving traders something they can actually work with.
🔎 Weekly Chart — Big Picture Reality
Three things stand out immediately:
1️⃣ The 5600 → 4400 drop
Yes, it was massive:
- ~12,000 pips
- large in percentage terms
- emotionally shocking
But in long-term trend terms?
👉 Just a correction.
Even if we measure only the 2025 rally, the drop didn’t even reach a 50% retracement.
2️⃣ Technical respect of structure
The decline stopped almost exactly at the October 2025 ATH, which acted as support.
Markets remember levels.
This is not random.
3️⃣ Alignment with congestion
The drop also aligned with:
- the late-December congestion zone
- the starting price of 2026
The first prices of the year often act as major S/R zones.
This is classic market behavior.
✅ Conclusion from Weekly:
Trend is bullish. No debate here.
❌ But tradable?
Not really.
Why?
Because a correct structural stop would be ~8,000 pips away.
With leverage, that’s not trading — that’s praying.
🔎 Daily Chart — Still Bullish, Still Not Tradable
On the daily:
- clean reversal from support
- first impulsive leg up
- pullback forming a higher low
- recent Piercing Line bullish pattern
Again:
✅ Bullish structure
❌ Not tradable structure
A proper stop still sits ~4,000 pips away.
That’s not risk management.
🔎 15-Minute Chart — Where Trading Actually Happens for me lately
Given current volatility, this is what matters these days
Here’s what we see:
- initial rally in a rising wedge
- rejection from resistance
- drop from 5100 → 4650 contained within a bullish flag relative to the impulse
- breakout above flag resistance
- continuation toward 5k
- NY close near highs
Structurally?
👉 Still bullish.
But even here:
❌ Buying blindly at 4965 makes no sense.
We need a dip.
We need structure.
We need asymmetric risk.
📌 The Two Buy Zones That Make Sense
If price offers them:
✅ 4900
✅ 4800
Those are the zones where risk/reward becomes logical.
⚠️ The Reality Most Traders Don’t Want to Hear
Even on a 15M chart:
- stops of 300–500 pips are normal
- targets should be well above 1,000 pips
Let’s be honest:
Bragging about a 100-pip Gold target these days is like bragging about a 2-pip win on a EURUSD trade.
simply not trading...
✅ Final Conclusion
✔️ Gold is bullish
✔️ I will look to buy dips
✔️ But only with structure and discipline
Because in this environment:
- volatility is extreme
- emotions are expensive
- precision matters more than bias
A trader’s job is not to be right.
A trader’s job is to make money.
And those are two very different things. 🚀
P.S.
And yes — if I see a clear reversal structure on the 15-minute chart, I can take a short trade, even if my overall bias on Gold remains bullish.
This does not contradict my opinion.
It simply reflects the reality that:
You can be bullish on the bigger picture and still trade short-term corrections.
Have a nice Saturday!
Mihai Iacob
Community ideas
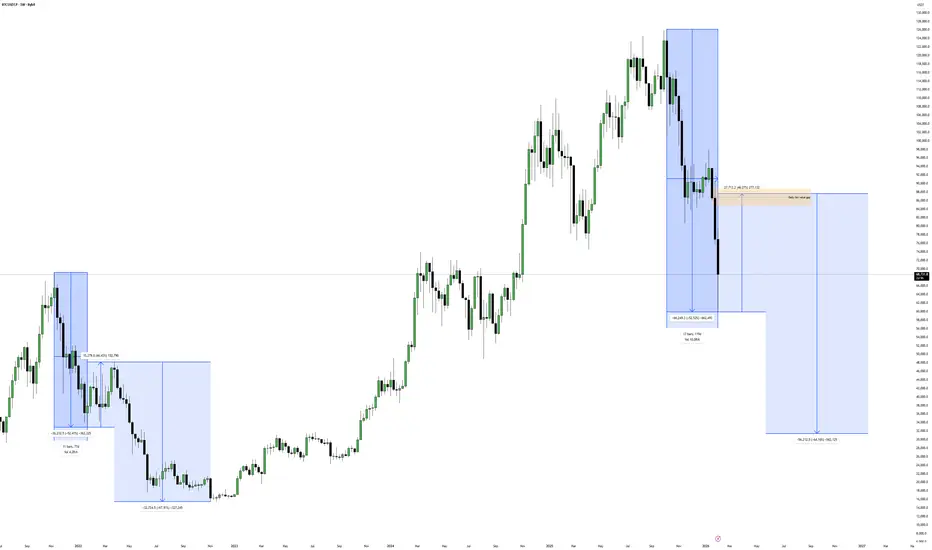
Bitcoin - When History RhymesMarket Context and Historical Symmetry
Bitcoin has a tendency to move in recognizable cycles, and what stands out right now is the near-perfect similarity between the previous bull market correction and the current one. During the 2021 cycle, price retraced approximately 52% from the all-time high before establishing a mid term bear market low. That level ultimately became the foundation for the next impulsive expansion.
Fast forward to today, and we are seeing almost the exact same percentage decline from the 2025 all-time high. A 52% correction is not just a random statistic, it reflects a deep but structurally healthy retracement within a broader macro trend. When markets repeat this type of behavior, it often signals that larger participants are positioning rather than abandoning the trend entirely.
Why the Current Zone Matters
The present price region is technically significant because it represents both psychological and structural support. Sharp selloffs typically aim to force weak hands out of the market, while stronger capital accumulates at discounted prices.
If this level holds, it strengthens the narrative that Bitcoin may already be forming its mid term bear market low. What makes this especially compelling is the speed of the decline, capitulation-style moves often precede powerful relief rallies as liquidity flips direction.
This is not about predicting an immediate reversal, but about recognizing that the risk-to-reward profile begins to improve dramatically after a correction of this magnitude.
The 46% Relief Rally Scenario
After the 2021 mid term low was established, Bitcoin rallied roughly 46%. If price were to mirror that behavior again, a similar percentage move from the current low would drive price directly into the Daily Fair Value Gap left behind during the aggressive leg down.
This alignment is important.
Fair Value Gaps act as magnets for price because they represent inefficiencies created by institutional urgency. Markets frequently revisit these zones to rebalance order flow before deciding on the next directional move.
A 46% expansion into that imbalance would not only be technically clean, it would also reflect classic cycle behavior, sharp drop, strong relief rally, then continuation.
Daily Imbalance as the Technical Target
The daily FVG overhead is more than just a chart feature, it represents unfinished business. When price leaves a gap during displacement, it often returns to mitigate it before larger players re-engage.
Should Bitcoin rally into this region, traders should pay close attention to price behavior inside the gap. Acceptance above it would suggest stronger-than-expected bullish momentum, while rejection would reinforce the idea that the broader corrective phase is not yet complete.
Confluence between the historical 46% rebound and the location of this imbalance gives the upside scenario additional credibility.
Cycle Continuation and the 34K Projection
If Bitcoin continues to respect the previous cycle structure, the relief rally would likely be followed by another leg lower. Historically, markets rarely bottom in a single move, they tend to form complex accumulation ranges with multiple expansions and retracements.
Following the analog, a rejection from the daily imbalance could send price toward the 34K region. That area would become a logical candidate for a higher timeframe accumulation phase, especially if liquidity builds beneath it.
This type of sequence, capitulation, relief rally, secondary drop, is characteristic of mid cycle bear markets rather than full macro reversals.
Conclusion
The striking similarity between the previous 52% correction and the current one provides a powerful framework for anticipating potential price behavior. While no cycle repeats perfectly, markets often echo prior structures because participant psychology remains constant.
A relief rally of roughly 46% into the daily Fair Value Gap would be the first confirmation that history may be rhyming once again. From there, traders should remain prepared for volatility, as a subsequent move toward the 34K region could complete the broader corrective pattern before the next major expansion begins.
Recognizing these patterns early allows traders to shift from emotional reactions to strategic positioning, which is ultimately where consistency is built.
___________________________________
Thanks for your support!
If you found this idea helpful or learned something new, drop a like 👍 and leave a comment, I’d love to hear your thoughts! 🚀
TradeCityPro | Bitcoin Daily Analysis #261👋 Welcome to TradeCity Pro!
Let’s move on to Bitcoin analysis. After the recent sharp drop, the market is now going through an upward corrective move.
⏳ 1-Hour Timeframe
After Bitcoin’s bearish move down to the 62,824 support, it entered a corrective phase and has so far retraced up to 71,670.
✔️ During this correction, volume has decreased, which confirms the strength of the bearish trend. Now, as a new bearish leg appears to be starting, selling volume is increasing again, further supporting the continuation of the downtrend.
✨ At the moment, the short trigger we have on Bitcoin is 67,735. This trigger remains valid as long as price does not stabilize above 71,670, and we can open a short position on a clean break of this level.
💥 The main short trigger is still the break of 62,824. That said, in my view, if price continues lower, it will likely react to another low and form a new structure before moving further down—but for now, 62,824 remains our key trigger.
📊 For long positions, we have a very risky trigger at the break of 71,670. This setup is only worth considering if buying volume starts to increase, and even then, it should be taken with minimal risk.
🔔 The main long trigger will only be confirmed after a trend change on higher timeframes, such as the 4-hour and daily charts.
❌ Disclaimer ❌
Trading futures is highly risky and dangerous. If you're not an expert, these triggers may not be suitable for you. You should first learn risk and capital management. You can also use the educational content from this channel.
Finally, these triggers reflect my personal opinions on price action, and the market may move completely against this analysis. So, do your own research before opening any position.

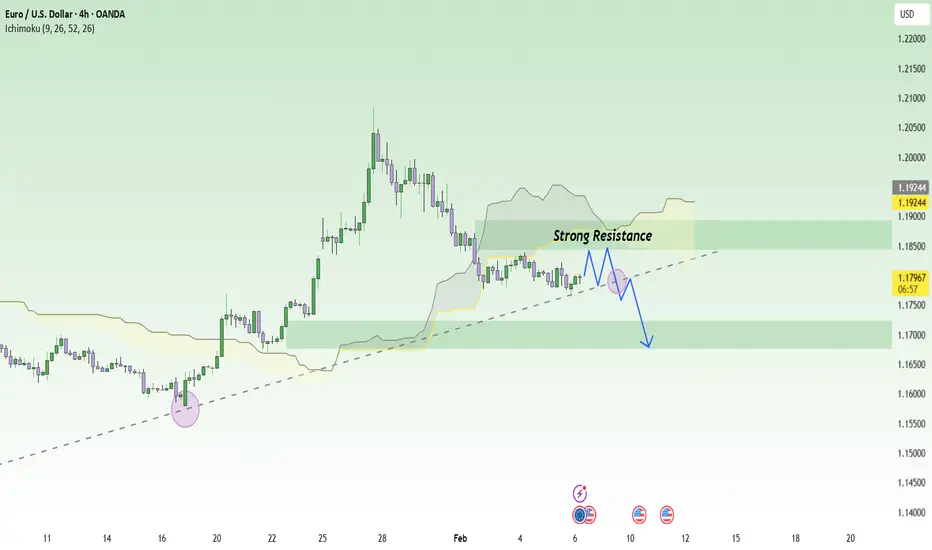
Don’t Rush to Buy EURUSD – The Bearish Trend Is Speaking UpEURUSD is currently leaning toward a short-term BEARISH trend, as recent news continues to favor the U.S. dollar over the euro . The ECB has kept interest rates unchanged with a rather cautious tone , while Eurozone data and momentum remain too weak to support a sustainable EUR recovery. In contrast, the USD is still supported by expectations that U.S. interest rates will stay higher for longer , making EURUSD rallies vulnerable to selling pressure.
On the chart, after the strong rally at the end of January , price has entered a corrective phase and is now trading below the Ichimoku cloud. This signals that bullish momentum has faded , and the market is shifting into a “technical rebound within a short-term downtrend” . Recent candles are compressing around the 1.17–1.18 zone, which may look like accumulation, but in reality it is more likely consolidation before a downside break if price fails to clear overhead resistance.
The 1.1840 area stands out as a clear resistance zone (supply confluence + cloud resistance) , where selling reactions are highly likely. If price pulls back toward 1.1840 but fails to hold, the higher-probability scenario is a renewed move lower, with an initial focus on 1.1700, and a deeper extension toward 1.1677, in line with the marked targets.
Elise | XAUUSD · 30M – Liquidity Grab → Bullish ContinuationOANDA:XAUUSD
Gold executed a classic liquidity grab below support, trapping weak sellers before aggressively reclaiming structure. Each dip into demand has been met with strong buying pressure, showing smart-money accumulation. The current pullback appears corrective, and as long as price holds above support, continuation toward the higher resistance zone remains favored.
Key Scenarios
✅ Bullish Case 🚀 → 🎯 Target: 5,040 – 5,080
❌ Bearish Case 📉 → Failure to hold 4,820 may expose price back toward the lower demand zone.
Current Levels to Watch
Resistance 🔴: 5,040 – 5,080
Support 🟢: 4,780 – 4,820
⚠️ Disclaimer: This analysis is for educational and informational purposes only. It is not financial advice. Please conduct your own research before trading

BITCOIN - From the DISTRIBUTION phase to the CONSOLIDATION phaseBINANCE:BTCUSDT.P tested 60K during the current cycle and formed a fairly significant pullback to 70K. However, it is too early to talk about a bullish trend; this is just a reaction to liquidation. The cycle continues...
At the moment, the decline is 52%, which is historically within acceptable limits and is a relatively average indicator.
Fundamentally, there is no support for the crypto market, and Friday's pullback was supported by the recovery of the US stock market.
Global and local trends are bearish, and local spikes in volume and bullish impulses are possible in the hunt for liquidity, which should be viewed conservatively.
The price has entered the key trading channel of 53K - 73K and is likely to stop within the current cycle and form another trading range, which may subsequently reinforce the reversal momentum. Key liquidity zones have not yet been tested: 59650 - 53330.
Resistance levels: 71,900, 73,800, 82,200
Support levels: 65,000, 59,650, 53,330
How can we tell that the market is ready to reverse? Technically, the reversal phase does not come immediately after distribution, the cycle of which is still ongoing. The market must enter a consolidation phase with the gradual formation of sequentially rising lows/highs. The breakdown of local structures + the market holding above key resistance levels will hint at a positive market sentiment.
Thus, we are waiting for the formation of an intermediate bottom and a change in the market phase from distributive to consolidation...
Best regards, R. Linda!

XAU/USD ~ Gold Building Momentum from Key Support📝 Description 🔍 Setup OANDA:XAUUSD
✅Gold has been respecting a descending trendline with multiple rejections, showing clear bearish structure. Now price is attempting a breakout + retest while holding above a strong demand zone.
✅Buyers stepped in aggressively from support, forming higher lows and pushing price back toward the cloud resistance area.
✅Geopolitical tensions (Middle East concerns) continue to support safe-haven demand for gold — adding a fundamental tailwind.
📍 Support & Resistance
🟥 Support Zone: 4,760 – 4,650
🟥 Major Support: 4,570 – 4,400
🟩 1st Resistance: 5,310
🟩 2nd Resistance: 5,550
Volume profile shows strong acceptance near support — buyers defending the zone.
⚠️ Disclaimer
This analysis is for educational purposes only.
Trading involves risk. Always use proper risk management and your own strategy.
💬 Support the Idea👍 Like if you’re bullish on Gold
💬 Comment: Breakout rally or fakeout? 🔁 Share with fellow gold traders
#XAUUSD #Gold #Forex #PriceAction #TrendlineBreakout #SafeHaven #TradingView #SupportResistance #IntradayTrading #Kabhi_TATrading

GOLD - Consolidation in a symmetrical triangle. Up or down? FX:XAUUSD showed signs of recovery on Friday, but the price is stuck within the boundaries of a symmetrical triangle, which generally indicates market uncertainty.
Key fundamental factors
The ADP, JOLTS, and unemployment claims reports pointed to weakness in the labor market, supporting expectations of two Fed rate cuts this year, which is positive for gold. Upcoming US-Iran talks are supporting demand for safe-haven assets, despite the conclusion of the Ukraine talks. Other central banks (the ECB and the Bank of England) easing policy has strengthened the dollar, putting pressure on gold.
Gold's attempt at recovery looks vulnerable. Although weak employment data and geopolitical risks provide support, the main counterforce remains the global rotation of capital in favor of the US dollar.
Technically, the market may have a chance to break through the correction resistance, but will there be support from traders?
Resistance levels: 4901, 5021, 5100
Support levels: 4811, 4751, 4670
I expect that before attempting a breakout, the market may try to test liquidity in the 4812 zone. However, if the market breaks through the resistance conglomerate and manages to close above 4901, then the market will be able to continue its growth towards 5000.
Otherwise, if 4812 does not hold the price, the market will close within the boundaries of a symmetrical triangle (flat).
Best regards, R. Linda!

XAUUSD Breaks the Deadlock as Bulls Regain ControlXAUUSD has rebounded strongly after the corrective phase.
Following that clear impulse to the upside, bullish momentum briefly slowed and price transitioned into a clean, downward-sloping corrective structure—exactly the type of price behavior I often observe during trend continuation phases.
This pullback is not a sign of weakness, but a necessary pause.
Sellers attempted to push price lower, but the decline remained shallow and lacked follow-through. Each dip into lower levels was quickly met with strong buying interest, effectively absorbing selling pressure. This behavior clearly suggests that buyers remain firmly in control of the broader market structure.
Price has now broken out of the corrective structure with convincing strength.
The breakout candle reflects clear buying intent and confirms that capital is rotating back into the market. This is a familiar setup that typically signals the activation of the next bullish leg, rather than a short-lived technical rebound.
As long as price holds above the breakout zone and does not rotate back into the structure,
I expect gold to continue extending higher, with upside targets focused on the 5.2xxx – 5.3xxx region in the coming sessions.

Gold Price Analysis – Key Resistance and Support LevelsThis chart outlines critical resistance and support levels for gold prices. The Key Resistance Level at 5,565.814 is a potential area for price rejection or breakout. If price approaches this level, watch for either a continuation of bullish momentum or a pause in upward movement. The Support Zone around 4,820 is being tested, and if this level holds, it could lead to a bullish reversal or bounce. The Critical Support at 5,012.323 is a key level for potential bullish movement, while the Final Target at 4,504.227 represents the expected downside if support fails. Extreme Support at 4,509.018 is a significant reversal area, should the price reach this level

BTCUSD CHoCH Signals Trend Reversal Clear structure break + CHoCH on BTCUSD (2H). Based on what you marked, here are clean upside targets:
🎯 BTCUSD Upside Targets (after CHoCH)
Target 1 (TP1):
78,000 – 79,000
Previous supply / structure resistance
First logical profit-taking zone
Target 2 (TP2):
83,500 – 84,500
Higher timeframe resistance
Major liquidity / imbalance area
Strong swing target if bullish momentum continues
Invalidation / Risk Area (for bias)
If BTC loses 65,000 – 64,000, bullish setup weakens and downside continuation becomes likely.
Short & Simple Caption (for your post)
BTC breaks bearish structure and shows CHoCH on 2H, hinting at a potential trend reversal. Price may target higher liquidity zones if bullish momentum holds.

BNB/USDT | Up or down? (READ THE CAPTION)As you can see in the daily chart of BNBUSDT, it has been dropping in price ever since October 10th. After it hit the Bullish OB yesterday, it rose from 570 to 669, before dropping again and it's being traded at 632.
If Binance coin keeps itself above the $600 level, it could go up to $730.
If it fails to stay above $600, it may drop lower to $500.

Bitcoin Rebound: Pause Before the Next Move Lower?Hello everyone, looking at Bitcoin on the H4 timeframe, the overall picture hasn’t changed much. The dominant trend remains bearish, and the recent rebound is more likely a technical move rather than a genuine reversal signal.
From a structural perspective, price is still trading below the key EMA levels, and these EMAs continue to slope downward — a clear sign that selling pressure remains in control. The recent bounce came immediately after a sharp sell-off, which is a very typical characteristic of a technical rebound: price retraces to release downside pressure, but without meeting the conditions required to confirm a new uptrend. Volume supports this view as well — selling volume expanded strongly during the decline, while the rebound lacked the kind of volume that would confirm sustained buying interest.
From my experience, when price rallies but fails to reclaim the EMA zone above, it usually signals a pullback within the dominant trend rather than the start of a longer bullish phase.
So what are the key levels to watch next?
On the downside, the 63,000–65,000 USDT area is the nearest support zone I’m closely monitoring. If selling pressure continues, this is a level Bitcoin could realistically revisit to test market reaction. My base case scenario is a move down toward support, potentially followed by short-term consolidation or even a false break, before a rebound toward the resistance zone around 72,000–75,000 USDT.
Only if price can break above and hold above the medium-term EMA zone, while rebuilding a Higher High – Higher Low structure, would I begin to seriously consider a transition into a more sustainable bullish trend.
From a macro and news perspective, current pressures have not fully faded. Based on information flows from Forex Factory and other mainstream financial sources, US interest rate expectations continue to weigh on risk assets. While the market has started to talk more about potential easing in the second half of the year, the Fed has yet to deliver a sufficiently dovish signal to attract large-scale capital back into crypto. At the same time, short-term risk-off sentiment still emerges as investors react to economic data and sharp moves across global financial markets, while larger players appear more patient, waiting for deeper discounted price zones rather than chasing rebounds.
Putting everything together, I’m still leaning toward a decline–rebound–decline scenario. My personal approach is to avoid chasing buys during technical rebounds and instead focus on observing price behavior around the 63k–65k zone. If price rallies into the 72k–75k area but fails to break the broader trend structure, this region is likely to remain a notable selling zone.
What about you? Are you expecting Bitcoin to hold support and form a base, or are you still preparing for a deeper correction ahead?

Gold 30-Min — Volume Bullish Reversal Triggered⚡Base : Hanzo Trading Alpha Algorithm
The algorithm calculates volatility displacement vs liquidity recovery, identifying where probability meets imbalance.
It trades only where precision, volume, and manipulation intersect —only logic.
Technical Reasons
/ Direction — LONG / Reversal 4862 Area
☄️Bullish momentum confirmed through strong candle body.
☄️Structure shifted with higher-low near key demand base.
☄️Volume expanding confirms order-flow alignment upward.
☄️Buyers reclaimed imbalance with sustained clean break.
☄️Algorithm detects rising momentum under low liquidity.
⚙️ Hanzo Alpha Trading Protocol
The Alpha Candle defines the day’s real control zone — the first battle of momentum.
From this origin, the Volume Window reveals where the next precision strike begins.
⚙️ Hanzo Volume Window / Map
Window tracked from 10:30 — mapping true market behavior.
POC alignment exposes institutional bias and breakout potential zones.
⚙️ Hanzo Delta Window / Pulse
Delta window monitors real buying vs. selling power behind each move.
Tracks volume aggression to expose who controls the candle — buyers or sellers.
When Delta aligns with Volume Map, momentum becomes undeniable.

XAUUSD Short: Supply Holding, $4,750 Demand as TargetHello traders! Here’s a clear technical breakdown of XAUUSD (4H) based on the current chart structure. Gold previously traded within a well-defined ascending channel, where price respected both the rising support and resistance lines, forming a series of higher highs and higher lows. This structure confirmed sustained bullish momentum and healthy trend continuation. During this phase, pullbacks remained corrective, and buyers consistently defended the lower boundary of the channel, allowing price to gradually grind higher. The bullish move ultimately accelerated into a strong impulsive rally, which culminated at a clear pivot high, marking a temporary exhaustion of buying pressure. Following this pivot point, market structure shifted. Price broke below the ascending channel support and transitioned into a bearish corrective phase, signaling that bullish control was weakening.
Currently, XAUUSD is trading below the descending Supply Line, with price structure showing lower highs and failed recovery attempts. This suggests that the recent upward moves are corrective pullbacks rather than the start of a new bullish trend. Below current price, the Demand Zone around 4,750 stands out as the next major area of interest. This zone represents a strong historical demand level and aligns with prior consolidation, making it a logical downside target where buyers may attempt to step in.
My primary scenario favors further downside continuation as long as price remains below the descending supply line and below the 4,900 Supply Zone. Any rallies into this resistance area are viewed as potential selling opportunities rather than trend reversals. The main downside objective is the 4,750 Demand Zone (TP1), where partial profits can be considered and where a market reaction is likely. If price reaches this zone, the response will be key in determining whether gold forms a base for a corrective bounce or continues lower into deeper demand. However, a strong bullish reclaim and acceptance back above the supply zone and the descending supply line would invalidate the bearish scenario and signal a possible trend shift. Until that happens, structure, trend, and price behavior continue to favor sellers. Manage your risk!

BTCUSD · 30M – Liquidity Sweep → Bullish RecoveryBITSTAMP:BTCUSD
BTC swept sell-side liquidity aggressively, forcing stops and triggering panic selling. After the sweep, buyers stepped in strongly, reclaiming key structure and printing a bullish break. The recovery shows acceptance above demand, suggesting a corrective bullish move toward higher resistance zones within the broader range.
Key Scenarios
✅ Bullish Case 🚀 → 🎯 Target 1: 71,000 → 🎯 Target 2: 75,000
❌ Bearish Case 📉 → Loss of the BOS/demand zone may lead to a revisit of liquidity lows.
Current Levels to Watch
Resistance 🔴: 71,000 – 75,000
Support 🟢: 65,800 – 66,300
⚠️ Disclaimer: This analysis is for educational and informational purposes only. It is not financial advice. Please conduct your own research before trading.

GOLD(XAUUSD): New Potential Zone For Swing And Intraday Buyers! Gold fell below our previous analysis’s expectations rendering it invalid. Consequently, we’ve identified two potential zones for buyers. One is safer while the other is riskier. You can choose either or both depending on your trading strategy.
Like and comment for more! We appreciate your support and hope it continues.
Team Setupsfx_

Ethereum · Highest volume in 365 days · New all-time high?Look at this, a simple signal: The same day that Ether produced a correction low the action turned bullish closing green with the highest volume in a year.
Back on the 9th of April 2025, this date Ether ended a multiple months longs correction. Guess what happened?
The day turned bullish closing green with the highest volume until this day. So a correction low closing green rather than red, with a full candle, signals the end of the correction. The start of a reversal, a new market phase.
Seeing this signal makes me wonder, how far up will Ethereum go? How long will the bullish period last?
This is such a strong signal that the next move is bound to be something big.
When I was looking at Bitcoin going back to 2018, which matches in some ways what is happening today, I saw potential for a 98% rise as part of the current relief rally... I am not saying this will happen but this is what is possible.
2017 produced a blow-off top and also 2025. There are many similarities.
Now Ethereum is showing potential for several months of growth. Back above $2,000 with the correction ending as a higher low.
Higher lows lead to higher highs? Good question, right?
Namaste.

Wave (2)- Wave (3)
I see two possibilities; Blue or Brown ?
Technical Section:
Wave (2)- Sharp Correction
Common Ratios for Wave 2:
Wave 2 = either 61.8% of Wave 1 or 76.4% of Wave 1
Long Term support levels:
The Blue Path: $ 57655 (once complete the market will reverse ..)
The Brown Path: $ 47986 (Possible and probable (Middle East war))
Wave (3)
Wave 3 = either 1.618 x length of Wave 1
or 2.618 x length of Wave 1
or 4.236 x length of Wave 1
Long Term resistance levels:
1 x length of Wave 1= $ 181000 (always travels beyond the end of wave 1)
1.618 x length of Wave 1= $ 258000
2.618 x length of Wave 1= $ 383000
4.236 x length of Wave 1= $ 584000

Bitcoin monthly —Support found at EMA55There are many things to consider. The market represents a natural force, a force of nature. It is a collective mind, human action. It represents one aspect of our collective mind. When we are thinking, being and feeling in a certain way, this is reflected in the market, that being neutral, bearish or bullish.
The market never stays the same, just as nothing stays the same in our bodies, minds and world. Everything is always in a constant flux. Everything is always changing.
The most basic part of this phenomena is the intrinsic duality of this world. It doesn't matter where you live, you can never miss the fact that the day changes between night and day. This basic reality is reflected as bearish and bullish in our market.
When the day comes, we know night is always lurking right around the corner. When the market is bearish, we know that bullish comes next.
Bitcoin found support on the monthly timeframe right at EMA55, trading five consecutive months red. A very strong bearish impulse. This is the night, now comes day.
EMA55 is a very strong support. So now we get some sort of reversal, some sort of relief, some sort of bullish action. The night makes way for the appearance of the sun. The morning has come. It is a bright day. We are going up.
Namaste.

Bitcoin (BTC): Liquidity Sweep Near $60K | Might Recover To $70KBTC endured heavy bleeding, which dipped the price to the new lows no one could have thought about.
Yet what happened happened, and now we are left with BTC sitting near the $66K area, where the price dipped to the $60K zone and went for a liquidity sweep, after which the price has been growing and gathering again the buy-side volume.
The game plan is simple: as we enter the weekend market, most likely we will see some more volatility and recovery to upper zones—a smaller correction. Expecting $70K to be reached, after which we should see some struggle around that zone.
Swallow Academy

BTC: Is This the Bottom or Just the First Reaction?After the sharp BTC sell-off, the big question is obvious:
was this the bottom or just the first move?
Here’s my current read on BTC after the recent sell-off.
There are a few realistic scenarios worth considering.
Scenario 1: Black swan, not a bear market
This move could be driven by a black swan–type event rather than a true cycle shift.
In that case:
* the sell-off is reactive
* structure damage is temporary
* price may recover faster than expected once uncertainty fades
This would explain the violence of the move without requiring a full bear market thesis.
Scenario 2: Bear markets rarely end with a V-shape
Historically, bear markets almost never bottom with a clean V-shaped recovery.
If this is the start of a broader bearish phase:
* immediate upside would be suspicious
* fast recoveries tend to fail
* patience becomes more important than prediction
Sharp bounces can happen but they don’t automatically mean “bottom in”.
Scenario 3: Range before resolution
More often than not, markets need time.
A common pattern after major sell-offs:
* strong initial bounce
* followed by weeks or months of sideways range
* then a clearer directional move
This range phase is where sentiment resets and real positioning happens.
Takeaway
Right now, it’s less about calling the bottom and more about watching how price behaves after the bounce.
Does BTC:
* reclaim structure quickly?
* fail and range?
* or break down again?
The answer won’t come from one candle it will come from time.
Another important technical detail is that BTC recently rejected from the Weekly 200 Moving Average. Historically, this level acts as a key cycle filter.
In past bear markets, BTC has typically traded below the 200 MA for a period of time before a durable bottom was formed.
Because of that, I wouldn’t be surprised to see price dip below the Weekly 200 MA as part of a bottoming process. That kind of move wouldn’t signal weakness by itself, it would more likely confirm a bear-market bottom structure rather than invalidate the asset.
Curious to hear your take:
bottom in, or more chop ahead? 👇

Bitcoin Breaks Major Support — Extreme Fear or Another Leg Down?Bitcoin ( BINANCE:BTCUSDT ), as I highlighted in my previous weekly idea , started its decline. The drop came with higher momentum than expected, surprising many, and it successfully broke the heavy support zone($78,260-$64,850).
Now, here are the fundamental reasons for Bitcoin’s movement in the last 24-48 hours, as well as the general context:
•Global Risk-Off Sentiment: Investors moved away from high-risk assets as global equity markets—especially tech stocks—came under heavy selling pressure.
•Lack of Strong Spot Demand: There was no meaningful inflow of fresh capital to absorb selling pressure at key support levels.
•Institutional Pressure & Unrealized Losses: Large BTC holders and public companies with Bitcoin on their balance sheets reported increased unrealized losses, weakening market confidence.
•Correlation With Traditional Markets: Bitcoin continued to trade as a risk asset, following the downside momentum of global financial markets.
•Forced Liquidations: High leverage across the market led to cascading liquidations, accelerating the downside move.
Bitcoin Fear & Greed Index is currently at 9 — marked as “Extreme Fear”.
This is the lowest reading since June 2022, when the market sentiment collapsed following major events like the Terra crash.
Historically, when the Fear & Greed Index dropped this low, Bitcoin experienced prolonged selling pressure and volatility, followed by eventual stabilization as fear subsided. Extreme Fear readings often coincide with market bottoms or oversold conditions, but they do not guarantee an immediate price reversal.
In short: Extreme fear can signal that market participants are overly pessimistic — possibly a contrarian buying environment — but confirmation from price action and other indicators is crucial before assuming a trend reversal.
Now, let’s take a quick look at Bitcoin’s 4-hour chart to assess the current situation.
It appears that Bitcoin, given its momentum, has successfully broken the heavy support zone($78,260-$64,850) and is currently pulling back toward that zone.
From an Elliott Wave perspective, it seems we are in the final stages of the main wave 4. After this pullback near Fibonacci levels, we anticipate another decline. Since the drop’s momentum has been strong, wave 5 could potentially be truncated.
I expect Bitcoin to resume its drop from one of the Fibonacci levels or Cumulative Short Liquidation Leverage($68,900-$67,200), targeting at least $64,123.
First Target: $64,123
Second Target: $62,103
Stop Loss(SL): $72,033
Points may shift as the market evolves
Cumulative Long Liquidation Leverage: $60,000-$58,000
CME Gap: $84,560-$79,660
CME Gap: $54,545-$52,980
💡 Please respect each other's opinions and express agreement or disagreement politely.
📌Bitcoin Analysis (BTCUSDT), 4-hour time frame.
🛑 Always set a Stop Loss(SL) for every position you open.
✅ This is just my idea; I’d love to see your thoughts too!
🔥 If you find it helpful, please BOOST this post and share it with your friends.
