Bitcoin in multi year collapse back to $1k - December 2025Perhaps you've noticed as have I, Media studies and Art collage students now turned financial experts flock to Youtube to inform peers of investment opportunities with the great Boomer wealth rotation that is set to land on their laps. Who would not be in disbelief at the possibility of wealth generated over generations is now at risk of being smoked on speculation in mere months. It is a real risk, and few seem to want to talk about it.
Over the next 10 years wealth is expected to rotate from one generation to the next. During that time this one chart about screams "stay away". Few care to listen. Instead it's all recession talk, crash, mountains of debt, sky-high prices, and chaotic politics. Everything seems out of whack, distortion and noise as the AI tech bubble grinds on.
Remember the post " Is Alt season dead? - June 2025 " when everyone was convinced of moon?, or " 3 week idea as price action broke down from $120k ". Read the comments, do you see yourself here? Shouting at the wind of sellers as your feet were lifted from the ground?
Opportunities to generate significant returns in the years ahead do exist, just not not in crypto. If you stick around over the next 2-3 years, I'll show you them. But you're on your own, will not be guiding folks on every turn or daily pullback. That's for Ww homepage. Instead, this is a post to highlight the Rotation from Growth to value has already begun. Opportunities on real value, on real businesses that generate profit. That's the ticket.
Not another "bearish Bitcoin post"
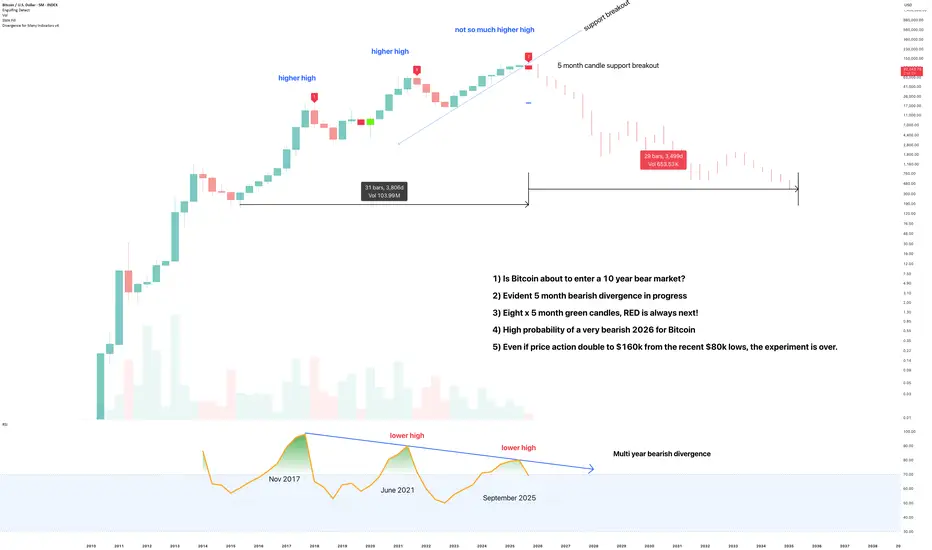
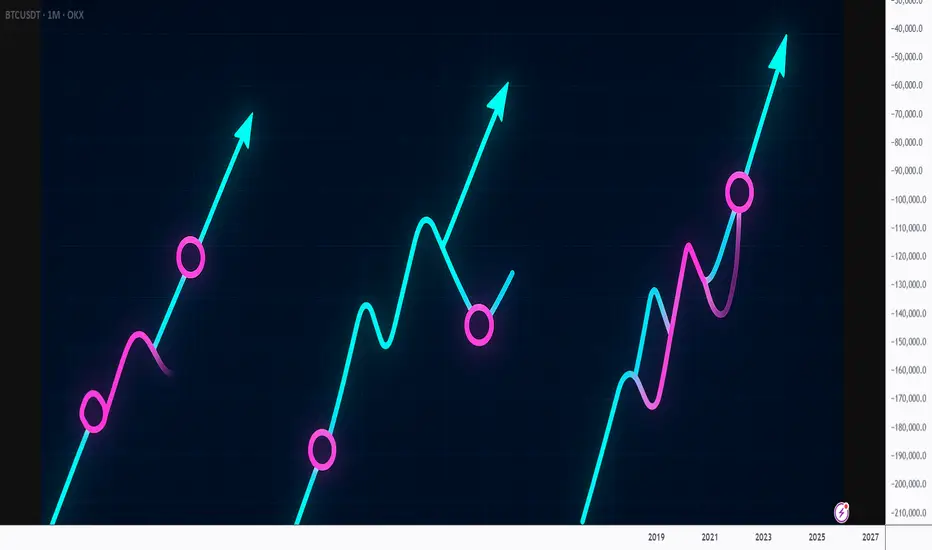
As 2025 draws to to a close, the end of another 4 year cycle plays out perfectly. Few want to believe until that 70% correction is complete. They'll return with videos such as "It was manipulated!" or some nonsense. The truth is, a 700% return was made from the lows. That's decent. However, this cycle top was far more nefarious than price action lets on, it was the first time Bitcoin closes last year of a bull market at a lower price than the year began! Let that sink in for a moment. Still not sinking?
1) In the last year of a Bitcoin bull market, usually the most bullish year of the 4 year cycle, price action would nearly double.
2) Seriously. Look left. 2013, 1017, 2021, er 2025 hello. Did you try switching it off and on again?
The end of the Bitcoin experiment
Okay, the last year of a Bitcoin bull market, price action closed lower. That's not FUD, that's fact. It is the first time in the history of Bitcoin price action that has seen a lower close during the last year of the bull market. Think about that for a moment. That's not adoption, that's gravity gripping maxis by the ankles.
The Bitcoin white paper implied a future that creates a globally accessible financial infrastructure. One that aims to give everyone equal opportunity to access a neutral monetary network, regardless of nationality, credit history, or status.
Instead why we got was laser eyes and individuals who amassed chunks of the circulating supply. That's arguably more centralised than the US dollar! Since most dollars today exist outside of the US, not in it. (Wait until those dollars come flooding back home, that'll be an entertainment not even a Netflix Warner Bros combo could create).
A significant bearish divergence prints
On the above 5 month chart we have a higher high matched with a lower high in RSI. Same settings used on the divergence tool. There are now 21 days remaining of the year for that 5 month candle to print. If history is our teacher, two more red candle prints will follow. That's basically all of 2026 to be red. Not just a little bit red, but a scene so bloody even Quentin Tarantino uses the black and white filter.
Conclusions, (or how to lose a fortune and blame the illuminati)
Right. So to wrap this up for anyone still listening. We’ve established that the world’s gone mad. We’ve got people who until recently thought a “bear market” was a poorly attended gay pride event in the woods now lecturing you on monetary policy from their mum’s box room. The great Boomer wealth handover is coming, and it’s shaping up to be the biggest game of Hot Potato with Grandparents lifesavings. And your entry ticket is a magic internet bean that just had its worst party year *ever*.
The facts, for those who enjoy them:
1. Bitcoin just wet itself. In the final, supposedly explosive year of its bull run, it closed *lower*. That’s like the finale of a fireworks display being a single, sad squeaker from a party popper. History screamed “double!”, 2025 whispered “...meh.”
2. The dream is a meme. The promise was a noble, decentralised utopia. The reality is laser eyed influencers and a supply more concentrated than a Kardashian’s self tanner. It’s not a revolution; it’s a pyramid scheme with better graphics.
3. The chart is screaming get out. A macro bearish divergence is printing. In layman's terms, the engine is smoking, the wheels are coming off, and the satnav is politely suggesting, for the 21st time, “At the next available opportunity, please turn the $§%$ around.”
So, what’s the takeaway?
This isn’t FUD. It’s an intervention. While the world is distracted by AI chatbots writing sonnets and political circuses, real value is quietly shifting. It’s not in speculative digital tokens; it’s in actual, boring, profit-making businesses. I know, double yawn, but the rotation has begun. You can still make 5-10x on stock positions if you chose wisely, manage risk, and are above all… are patient. That means no more 4hr charts and screaming day traders on Tik Tok.
Ww
Disclaimer
==========================
This isn’t financial advice. I’m a bloke with a chart, not a wizard. I’m patiently waiting for Tradingview Mods to elevate me to that status. Nudge nudge.
I could be utterly, spectacularly wrong. Bitcoin could moon tomorrow, propelled by a tweet from a billionaire who owns too much of it. You might buy a business that makes widgets and it goes bust because widgets become passé. That’s your gamble.
My only point is this: when the history books are written about this period, the chapter won’t be called ‘The Genius of the Crypto Bros.’ It’ll be called ‘The Great Distraction,’ and it’ll sit right between “Tulip Mania” and “That time we all bought NFTs of Monkeys.” The real opportunity isn’t where the hype is. It’s where the silence is. And right now, that's not crypto.
Now, if you’ll excuse me, I’m off to invest in something sensible. Probably tinned goods and shotgun shells. You know, real value.
Community ideas
BTC/USDT - Major Rejection from Supply Zone📝 Description 🔹 Setup Overview WHITEBIT:BTCUSDT
BTC/USDT has faced a strong rejection from the upper resistance / supply zone near the recent highs. Price has broken below the rising trendline, signaling a shift in short-term market structure from bullish to bearish. Failure to reclaim the trendline keeps sellers in control.
📌 Trading Plan📉 Bearish Scenario (Primary Bias )
Sell Zone: Below the broken trendline & previous support
Target 1: 89,030 (1st Support)
Target 2: 87,520 (2nd Support – liquidity area)
Confirmation: Weak bullish candles + rejection from trendline retest
#BTCUSDT #BitcoinAnalysis #CryptoTrading #BTC #PriceAction #TechnicalAnalysis #CryptoMarket #TrendlineBreak #TradingView #Kabhi_TA_Trading #SellBTC
⚠️ Disclaimer
This analysis is for educational purposes only.
Crypto markets are highly volatile — always manage risk and use stop-losses.
👍 Support the Analysis❤️ LIKE if this helped💬 COMMENT your BTC view
🔁 SHARE with fellow traders
Your support keeps the analysis coming! 🙏

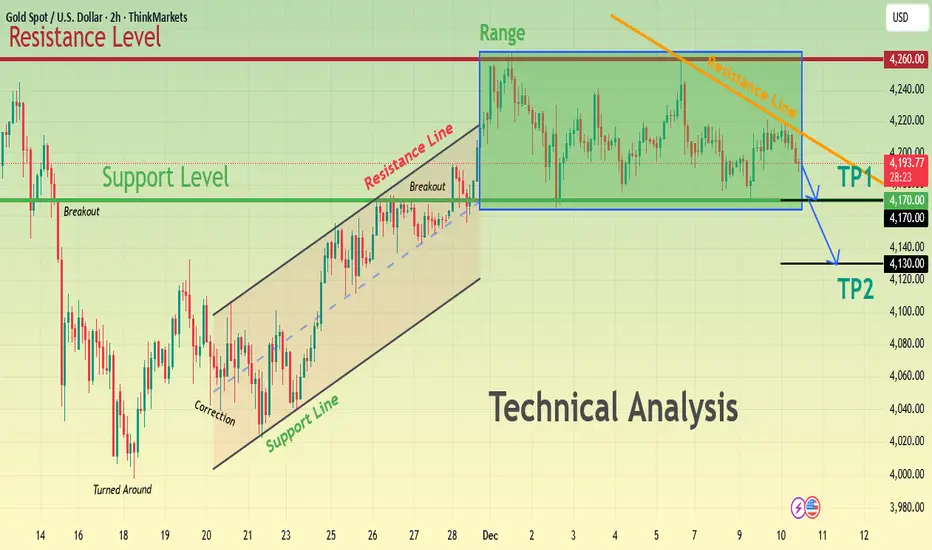
XAUUSD Range Resistance Holds — Pullback Toward $4,170 in FocusHello, traders! Here’s my technical outlook on GOLD (XAUUSD) based on the current market structure visible on the chart. After a strong rebound from the previous lower demand area, price moved into a steady ascending structure, respecting the rising Support Line and forming higher highs and higher lows. This bullish impulse later transitioned into a corrective consolidation, where Gold entered a well-defined range below the major 4,260 resistance level. The repeated rejection from this resistance confirms strong selling pressure at the top of the range, while buyers continue to defend the 4,170 support level, keeping price compressed between these key boundaries.Currently, XAUUSD is trading inside this consolidation box, while also respecting the descending short-term resistance line from the recent swing highs. The market previously broke out from the bullish channel and is now showing signs of weakness beneath the upper boundary of the range, suggesting that upside momentum is fading. As long as price remains capped below 4,260, the risk of a deeper corrective move remains elevated.My primary scenario is bearish as long as Gold stays below the 4,260 resistance and continues to respect the descending resistance line. I expect price to gradually move lower toward the TP1 target at 4,170, which is the first key support inside the structure. If selling pressure accelerates and this level fails to hold, the next downside objective stands at TP2 around 4,120, where stronger demand could emerge. A clear breakdown below TP1 would confirm bearish continuation. However, if price reclaims 4,260 with strong momentum, this bearish setup would be invalidated and the bullish trend could resume. For now, the structure favors a corrective pullback toward 4,170–4,120. Please share this idea with your friends and click Boost 🚀
Gold 30Min Engaged ( Bullish Volume Reversal entry Detected )⚡Base : Hanzo Trading Alpha Algorithm
The algorithm calculates volatility displacement vs liquidity recovery, identifying where probability meets imbalance.
It trades only where precision, volume, and manipulation intersect —only logic.
✈️ Technical Reasons
/ Direction — LONG / Reversal 4211Area
☄️Bullish momentum confirmed through strong candle body.
☄️Structure shifted with higher-low near key demand base.
☄️Volume expanding confirms order-flow alignment upward.
☄️Buyers reclaimed imbalance with sustained clean break.
☄️Algorithm detects rising momentum under low liquidity.
⚙️ Hanzo Alpha Trading Protocol
The Alpha Candle defines the day’s real control zone — the first battle of momentum.
From this origin, the Volume Window reveals where the next precision strike begins.
⚙️ Hanzo Volume Window / Map
Window tracked from 10:30 — mapping true market behavior.
POC alignment exposes institutional bias and breakout potential zones.
⚙️ Hanzo Delta Window / Pulse
Delta window monitors real buying vs. selling power behind each move.
Tracks volume aggression to expose who controls the candle — buyers or sellers.
When Delta aligns with Volume Map, momentum becomes undeniable.

EURUSD Short: Correction Deepens — Market Targets at 1.1590Hello, traders! The current EURUSD price action shows a well-structured reaction between the Supply and Demand zones, with price respecting key levels and channel formations. Earlier, the market traded inside a Range phase, signaling indecision before breaking the range to the upside and forming a clean bullish leg. However, this upward move was capped by the major Supply Zone near 1.16800, where sellers stepped in and pushed price lower. After the rejection from supply, EURUSD broke below the ascending channel, confirming a shift in short-term momentum. The pair then retested the mid-structure area, where another breakout occurred, indicating sustained bearish pressure. With each channel break, sellers strengthened their control, creating a series of lower highs within a corrective structure.
Currently, EURUSD is trading below the most recent ascending channel, aiming toward the 1.15900 Demand Zone, which remains the key area where buyers previously generated strong bullish impulses. This level aligns with the next major liquidity pool and stands as the primary downside target.
My scenario as long as price stays below 1.16800 supply and continues respecting the bearish breakout structure, the expectation is for the market to move lower toward 1.15900 Demand. A clear reaction from demand could initiate a bullish corrective move, but without a confirmed breakout above supply, any upside remains limited. A firm break below 1.15900 would invalidate potential reversal scenarios and open the path for deeper downside continuation. Manage your risk!

XAUUSDHello Traders! 👋
What are your thoughts on GOLD?
As seen on the chart, Gold (XAUUSD) has been trading within a defined range for the past two weeks, showing choppy price action without a clear trend direction.
Short-Term Strategy (Range Bound):
As long as the price remains within this box, the optimal strategy is to trade the boundaries:
• Short: At the resistance zone
• Long: At the support zone
Trend Strategy (Breakout Setup):
For a directional move, we need to wait for a valid breakout from this consolidation structure:
1-Bullish Scenario (Higher Probability ):A breakout above the current resistance zone will likely push the price toward the Previous High.
2-Bearish Scenario: A breakdown below the current support zone will expose the lower Target Support Area.
Always wait for candle confirmation before entering breakout trades.
Don’t forget to like and share your thoughts in the comments! ❤️

Gold 30-Min — Volume Buy Reversal Triggered⚡Base : Hanzo Trading Alpha Algorithm
The algorithm calculates volatility displacement vs liquidity recovery, identifying where probability meets imbalance.
It trades only where precision, volume, and manipulation intersect —only logic.
✈️ Technical Reasons
/ Direction — LONG / Reversal 4185 Area
☄️Bullish momentum confirmed through strong candle body.
☄️Structure shifted with higher-low near key demand base.
☄️Volume expanding confirms order-flow alignment upward.
☄️Buyers reclaimed imbalance with sustained clean break.
☄️Algorithm detects rising momentum under low liquidity.
⚙️ Hanzo Alpha Trading Protocol
The Alpha Candle defines the day’s real control zone — the first battle of momentum.
From this origin, the Volume Window reveals where the next precision strike begins.
⚙️ Hanzo Volume Window / Map
Window tracked from 10:30 — mapping true market behavior.
POC alignment exposes institutional bias and breakout potential zones.
⚙️ Hanzo Delta Window / Pulse
Delta window monitors real buying vs. selling power behind each move.
Tracks volume aggression to expose who controls the candle — buyers or sellers.
When Delta aligns with Volume Map, momentum becomes undeniable.

Lingrid | GOLD Sideways Movement Ahead of FOMC DecisionOANDA:XAUUSD perfectly played out my previous trading idea . Price is holding inside a well-defined consolidation after its prior surge, with price rotating above the rising channel base. The trend remains constructive, but momentum has cooled, suggesting participants are waiting for a catalyst rather than committing aggressively.
If buyers continue to defend the trendline and the lower boundary of the range, gold could attempt another gradual push toward the upper resistance near 4,300. A brief dip toward the channel support may occur to gather liquidity, potentially offering a better positioning point before any renewed upside attempt.
➡️ Primary scenario: support holds near 4,160 → rotation higher toward 4,300.
⚠️ Risk scenario: a sustained breakdown below the channel could weaken the bullish structure.
If this idea resonates with you or you have your own opinion, traders, hit the comments. I’m excited to read your thoughts!

GOLD → Consolidation ahead of the Fed's interest rate decision FX:XAUUSD is rebounding from resistance at the local range of 4220 and heading towards support at the liquidity zone of 4175. Ahead is the Fed meeting on interest rates, where rates are likely to be lowered. What to expect?
The probability of a 25 bp rate cut today is ≈90%. JOLTS job vacancy data reduced the chances of easing in January to ≈20%. Attention is shifting to the Fed's rate forecasts for 2026 and the tone of Powell's comments — the balance of votes in the FOMC (the ratio of “hawks” to “doves”) will determine the further course.
In the current case, it is worth looking not only at the fact of the rate cut, which is most likely already priced in. What is important to us are the regulator's comments and political stance. If they say that the pace of rate cuts will slow down in the future, the dollar may fly up and gold down.
If they support further rate cuts, the dollar will go down and gold up.
Resistance levels: 4220, 4266
Support levels: 4200, 4175, 4165
It would be a shock to the market if rates were cut by 50 points; the chances are slim, but they exist. In this case, gold would soar. However, the most likely scenario is described above.
Technically, I expect a retest of the trading range support; in the worst case, gold may fall to 4140 - 4120 - 4100 before rising. High volatility is possible in the evening!
Best regards, R. Linda!

EUR/USD: Sloping Inverse Head & Shoulders Breakout Toward 1.178Hi!
Let's analyze EURUSD
EUR/USD has completed a sloping Inverse Head & Shoulders formation, a pattern typically signaling trend reversal after a prolonged decline. The left shoulder, head, and right shoulder are well-defined, and price has decisively broken above the descending neckline, confirming the bullish structure. The breakout also aligns with the broader rounded bottom forming since October, adding confidence to the upward bias.
Price is now trending inside a steep ascending channel. As long as the pair respects the channel’s lower boundary and the retest zone around 1.1650–1.1670, bullish continuation remains favored. Short-term corrective dips into this area may offer potential re-entry opportunities.
The measured target of the sloping H&S projects toward 1.1780, which coincides with a significant supply zone. This confluence is likely where the next major reaction may occur.
Overall, the structure is logical and valid: reversal patterns, channel momentum, and neckline confirmation all support a continuation toward the highlighted target. Bulls remain in control unless price falls back below 1.1620, invalidating the upside scenario.
Disclaimer: As part of ThinkMarkets’ Influencer Program, I am sponsored to share and publish their charts in my analysis.

GOLD (XAU/USD): Day Trading Setup for Today📈GOLD is currently consolidating within a horizontal intraday range.
Following a test of the channel's support, the price may continue to ascend towards its resistance.
As a confirmation, I observe a head and shoulders pattern formation.
Target - 4255

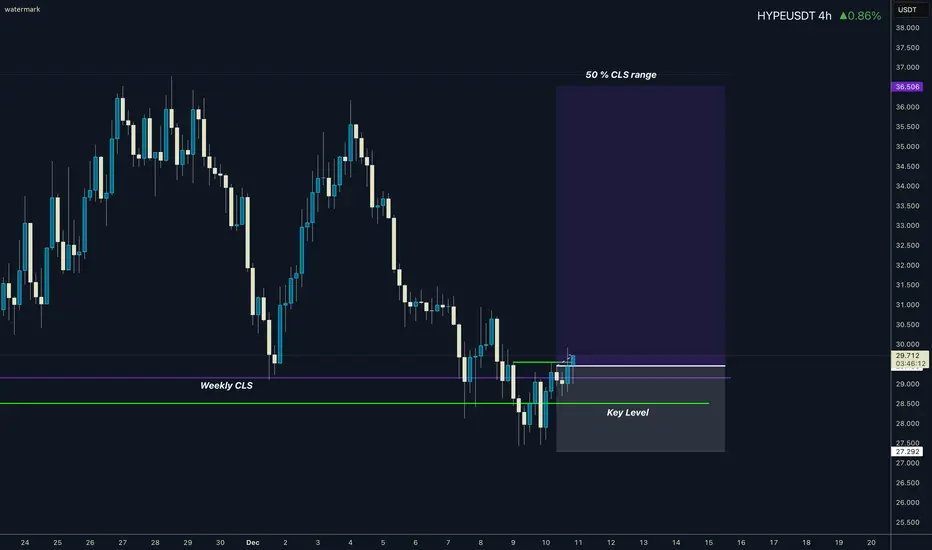
HYPE I Weekly CLS Range I Model 1Hi friends, new range created. As always we are looking for the manipulation in to the key level around the range. Don't forget confirmation switch from manipulation phase to the distribution phase to make the setup valid. Stay patient and enter only after change in order flow. If price reaches Its model 2 we are targeting full range.
🧩 Complete process and Strategy explained 👇 Click Below
I promised myself I’d become the person I once needed the most as a beginner. Below are links to a powerful lessons I shared on Tradingview. Hope it can help you avoid years of trial and error I went thru.
📊 Sharpen your trading Strategy
⚙️ 100% Mechanical System - Complete Strategy
🔁 Daily Bias – Continuation
🔄 Daily Bias – Reversal
🧱 Key Level – Order Block
📉 How to Buy Lows and Sell Highs
🎯 Dealing Range – Enter on pullbacks
💧 Liquidity – Basics to understand
🕒 Timeframe Alignments
🚫 Market Narratives – Avoid traps
🐢 Turtle Soup Master – High reward method
🧘 How to stop overcomplicating trading
🕰️ Day Trading Cheat Code – Sessions
🇬🇧 London Session Trading
🔍 SMT Divergence – Secret Smart Money signal
📐 Standard Deviations – Predict future targets
🎣 Stop Hunt Trading
🧠 Level Up your Mindset
🛕 Monk Mode – Transition from 9–5 to full-time trading
⚠️ Trading Enemies – Habits that destroy success
🔄 Trader’s Routine – Build discipline daily
💪 Get Funded - $20 000 Monthly Plan
🛡️ Risk Management
🏦 Risk Management for Prop Trading
📏 Risk in % or Fixed Position Size
🔐 Risk Per Trade – Keep consistency
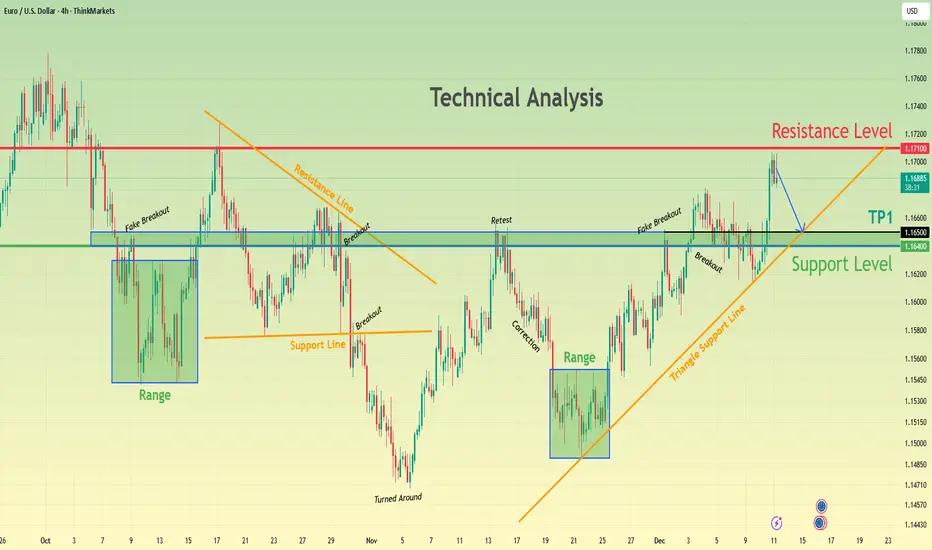
EURUSD Consolidates Below Resistance — Bears Aim for 1.1650Hello traders! Here’s my outlook on the current EURUSD setup. After a prolonged consolidation phase, the pair repeatedly respected the Support Level around 1.1640–1.1650, where buyers have consistently stepped in to defend the zone. This area has acted as a strong demand region, forming multiple ranges and triggering previous upward reversals. Each fake breakout below support confirmed that sellers failed to gain control, allowing price to rebound back into structure. Currently, EURUSD is trading within an ascending structure supported by the Triangle Support Line, which has guided price higher following the major turnaround. Along the way, several breakouts and retests validated bullish momentum as the pair pushed toward the key Resistance Level at 1.1710. This resistance remains the main barrier where price previously rejected and rotated lower. At this moment, EURUSD is approaching the Resistance Level again. If buyers maintain control and continue respecting the rising support line, the primary scenario is a pullback toward TP1 → 1.1650, where a major decision point awaits. This area has proven to be a reliable support level and aligns with previous retests, making it a critical zone for potential bullish continuation. A clean breakout above 1.1710 would open the door for a stronger upward move, signaling renewed bullish strength. However, if price breaks below the Triangle Support Line and falls under 1.1640, the bullish structure becomes invalid, and the market may return to deeper corrective levels. For now, the trend remains moderately bullish as long as price holds above support and stays within the rising structure. Please share this idea with your friends and click Boost 🚀
EURUSD: Price Holds Channel Support, Aiming for 1.1680Hello everyone, here is my breakdown of the current EURUSD setup.
Market Analysis
EURUSD remains in a broader bullish structure, with recent price action developing inside a well-defined ascending channel. After a strong impulsive rally, the pair broke above the previous consolidation zone and confirmed the breakout with a successful retest of the 1.16100 support zone, which now acts as a key demand area. The market then continued higher, forming higher highs and higher lows along the channel structure.
Currently, price is consolidating below the 1.16800 resistance zone, which represents a major supply area and the upper boundary of the current bullish leg. Despite short-term consolidation, buyers continue to defend the support zone, keeping bullish pressure intact.
My Scenario & Strategy
My scenario remains bullish as long as EURUSD holds above the 1.16100–1.16200 support zone and respects the ascending channel structure. I expect the price to continue pressing toward the 1.16800 resistance, which is the next major target for buyers. A clean and sustained breakout above this resistance would open the way for further upside continuation and new highs.
However, if price fails to break the resistance and shows strong rejection, a short-term pullback toward the mid-channel or back into the support zone is possible. Still, the overall bullish structure remains valid as long as the lower channel boundary holds. For now, the market supports a long bias, with the main objective being a retest of the 1.16800 resistance zone.
That's the setup I'm tracking. Thank you for your attention, and always manage your risk.

XAU/USD | Gold Awaits FOMC and Powell to Set the Next Big Move!By analyzing the #Gold chart on the 4 hour timeframe, we can see that price is still moving sideways inside the same range and has not chosen a clear direction yet. Even so, the previous analysis played out and gold dropped about 350 pips before bouncing back to the 4220 supply zone, where it got rejected again. Right now gold is trading around 4197.
Today’s interest rate decision and Powell’s speech will decide the next major trend.
If Powell sounds Hawkish, we could see a heavy drop in gold.
If he sounds Dovish, gold may push toward levels above 4300.
Keep an eye on the demand zones at 4157 to 4169 and 4130 to 4145, and the supply zones at 4225, 4233, and 4241 to 4259. This analysis will be updated soon.
Please support me with your likes and comments to motivate me to share more analysis with you and share your opinion about the possible trend of this chart with me !
Best Regards , Arman Shaban

GOLD → Positive fundamental background. Focus on 4200 FX:XAUUSD is testing the $4,250 level amid news momentum related to interest rate cuts. The fundamental backdrop is improving, with the dollar entering a downward trend...
The Fed cut rates by 25 basis points to 3.75%, as expected. Powell's tone was cautious rather than hawkish, which weakened the dollar and Treasury yields. The market expects two rate cuts next year, compared to one in the Fed's forecasts
- Focus has shifted to US employment data (jobless claims). The next key risk will be next week's NFP data.
The Fed's decision provided support for gold, but for growth above $4250, confirmation of a weakening labor market in upcoming reports will be needed. Technically, the focus is on the 4200-4220 zone.
Resistance levels: 4220, 4250, 4260
Support levels: 4200, 4180, 4175
Consolidation above 4200 will confirm the bullish sentiment, while a breakout and consolidation above 4220 will open up a new chance for growth towards the resistance of the range.
I do not rule out the possibility of a retest the support of the range at 4181 before moving up (the price is still in a sideways trend).
Best regards, R. Linda!

Why Most Traders Misread Trends!!! (Fix It in 10 Seconds)Every trader talks about trends.
Few actually understand how to read them.
Most traders think a trend is defined by:
- a diagonal line
- a moving average
- or a breakout
But the truth is much simpler... and far more powerful:
A trend is defined by the quality of its pullbacks.
📚Here’s the 10-second method professionals use:
1️⃣ Shallow Pullbacks = Strong Trend
When pullbacks barely retrace and reverse quickly,
it means one side is overwhelming the other.
Momentum is healthy.
Continuation is likely.
A shallow pullback tells you:
➡️ “Don’t fade this. Follow it.”
2️⃣ Deep Pullbacks = Weakening Trend
When price retraces deep into the previous leg,
momentum is slowing and imbalance is shrinking.
Buyers are less aggressive.
Sellers are gaining confidence.
A deep pullback tells you:
➡️ “Trend still alive, but the engine is cooling.”
3️⃣ Chaotic Pullbacks = Trend Is Dying
If pullbacks become wide, choppy, overlapping, messy,
the trend is no longer in control.
It’s not a trend anymore.
It’s a negotiation.
A chaotic pullback tells you:
➡️ “Stop trading the trend. Wait for structure.”
📚Final Thought
The market isn’t random ... it’s rhythmic.
And pullbacks are the rhythm.
Once you learn to read that rhythm, you’ll stop fighting trends…
and start flowing with them.
⚠️ Disclaimer: This is not financial advice. Always do your own research and manage risk properly.
📚 Stick to your trading plan regarding entries, risk, and management.
Good luck! 🍀
All Strategies Are Good; If Managed Properly!
~Richard Nasr
Clear Break & Retest: Gold Now Eyes a Push Toward $4,405Hello everyone, Helene here!
Right now, XAUUSD is a textbook example of a market trading inside a well-defined ascending channel, with price consistently respecting both the upper and lower boundaries of the structure.
We’ve just seen price break above a clear resistance zone and successfully retest it. This area also aligns with the “golden pocket” from the recent bullish leg, which makes it a highly critical zone to monitor. If this level continues to hold as support, it will act as a strong bullish structural confirmation, increasing the probability that price will extend toward 4,405, which is the upper boundary of the channel.
As long as price maintains above this support zone, the bullish setup remains valid. If not, then the short-term bullish outlook may be interrupted, potentially leading to a deeper corrective move.
Always remember to apply proper risk management.
Good luck, and trade safely.

ETH Faces Deep Pullback After Liquidity SweepETH has undergone a sharp correction, dropping from the 3,380–3,400 zone directly into the 3,180–3,200 FVG, where price reacted firmly. This move signals a clear liquidity sweep — a deep probe to collect orders before bouncing at a key demand pocket, reinforcing this FVG as short-term support.
To the upside, the 3,300–3,360 bearish FVG remains a major barrier, where ETH previously saw strong rejection. Volume Profile shows thin liquidity in this range, explaining why sellers continue to dominate whenever price retests it. The broader market structure still leans bullish with higher lows intact, but the recent sweep places ETH in a deeper corrective phase. The 3,180–3,200 zone now acts as a crucial pivot: losing it would flip the short-term bias bearish and expose the high-volume 3,000–3,100 region.

Price Compressing Below Trendline, Waiting for a Liquidity SweepGold continues to consolidate inside a narrow range as markets wait for fresh USD flows and upcoming Fed expectations. Sellers are losing momentum, but buyers still haven’t secured a clean breakout as price remains capped beneath the short-term descending trendline.
Current structure suggests a classic “liquidity sweep → bullish reversal” setup, with clear liquidity buildup sitting underneath the market.
📊 MMF Technical Outlook (H1)
1️⃣ Price reacting around a previous POC zone (Volume Profile)
Heavy traded area → easy for fake moves
No clean breakout above 4,218 yet
2️⃣ Key Levels – Main Setup Favors “Dip-Buy”
Important zones:
4,218 – 4,220 → Minor supply + descending trendline; breakout needed for bullish continuation
4,190 – 4,181 → Liquidity sweep zone (ideal buy area)
4,242 → Main upside target if breakout confirms
Structure shows price may dip lower first to clear liquidity before reversing upward.
🎯 MMF Daily Plan – BUY After Liquidity Sweep
▶️ Primary Scenario (High-Probability)
Wait for price to sweep liquidity into 4,190 → 4,181.
🔹 BUY Zone: 4,190 – 4,181
🔹 SL: below 4,172
🔹 TP1: 4,218
🔹 TP2: 4,242
Why this works:
Confluence: liquidity pocket + fib retracement + structural demand
MMF Flow suggests a clearing phase before bullish expansion
▶️ Secondary Scenario (Break & Retest)
If price breaks strongly above 4,218, wait for a clean retest to join the trend.
🔹 Entry: 4,218 – 4,220
🔹 TP: 4,242
🧭 MMF Bias Today
Bias: Neutral → Bullish as long as 4,180 holds
Avoid FOMO buys into 4,218 resistance
Only engage after a sweep or a clear BOS + retest

SOL: Selling Pressure Rises After Fed SignalsHi everyone, Domic here.
The Fed’s decision to cut rates by 0.25% raised hopes for renewed capital inflows into the crypto market, but the Fed’s statement that no further cuts are expected in 2026 keeps sentiment cautious . This caused sharp volatility in Bitcoin and Ethereum, spilling over as selling pressure into altcoins, particularly SOL — which is highly sensitive to BTC corrections. Short-term capital continues to favor AI and meme coins, leaving SOL temporarily lacking momentum, even though its ecosystem remains solid in the medium term.
On the 2H chart, SOL has officially lost its uptrend structure as price closed strongly below both the 34 EMA and 89 EMA. Closing below these EMAs signals that the bullish momentum is broken and the short-term trend has turned bearish. The breakdown of the $134–135 support zone confirms a bearish Break of Structure, accompanied by a spike in selling volume — indicating that this is a real sell-off, not noise.
Currently, price is approaching the $127–129 support zone, seen as the first buffer that could trigger a reaction. However, if selling pressure persists, the $122–124 zone is likely to become the market’s next target.
Wishing you successful trading!

UNH: 50% Inception"All I want to buy in 2025 is Healthcare" has been what I've told people that ask me about this tech stock or that AI company. It is my nature to look for what sector is the most downtrodden and find opportunity there... NOT in what "everyone" is talking about. I still feel that way as 2025 comes to a close.
The big move in this sector this year was $NYSE:UNH. I played this a few ways on the drop. My first entry was on the raw 50% Retracement of the trend from the bottom of 2008 to the All Time High of November 2024. Such a fast and deep retracement on such a high capitalization stock cannot be ignored. These things come around literally once per generation.
The second entry was the Volume Profile level of the pre-COVID years. This was the last possible Support and if price had traded any lower I would have had to cut my position for risk management. However, it was then soon reported that both the GOAT trend trader, Warren Buffet... and the GOAT contrarian Michael Burry... had BOTH taken large positions in the company and price responded bullishly.
I have continued to watch my position and today on my scanner for morning 30m Spikes I saw UNH.
This Spike comes at the near perfect intersection of both the short term (November 19th-December 4th) trend AND the long term generational 50%. It's a "must take" trade so I added it to my short term trading accounts to supplement my long term position.

EUR/USD Rejects Resistance: Bears Setting Up the Next Move📊 EUR/USD Chart Analysis
1. Strong Resistance Hit at ~1.1700
The price made a sharp impulsive rally into the 1.1700 zone, which is marked as a major horizontal resistance.
Wicks at the top suggest rejection pressure, meaning buyers struggled to break higher.
---
2. Possible Pullback Structure Forming
The black “M-shape” sketch on your chart suggests the idea of a short-term distribution pattern forming after the rally:
First drop after hitting resistance
Small corrective bounce
Potential continuation downward
This usually signals exhaustion after a strong move.
---
3. First Support Level: 1.1684 – 1.1670
You marked a key support shelf:
This is the first liquidity pool below current price
Price may retest this area after the rejection at resistance
A break below it could trigger momentum toward deeper support
---
4. Deep Support Zone: ~1.1664
Highlighted in red on your chart:
This aligns with the top of the Ichimoku cloud
Also sits near previous consolidation and structure
If price reaches this level, it may act as a strong reaction zone
---
5. Broken Downtrend Line Re-Test
Earlier in the chart, price broke above the diagonal downtrend line.
It's common after such a breakout for the pair to:
Pull back into the broken trendline
Retest it as support
Then resume upward movement
Your current price action looks like it is setting up for such a retest.
---
6. Ichimoku Cloud Context
Price is well above the cloud, showing:
Current momentum is still bullish
Pullbacks are expected but do not invalidate overall strength
Cloud’s angle is turning upward, reinforcing bullish shift.
---
7. “No Sell” Icon Meaning
The chart includes a crossed-out SELL symbol, implying:
Selling immediately after a breakout is risky
Market may still show bullish continuation despite pullbacks
Bears only gain control if support breaks decisively
---
📌 Summary
Based on the chart:
Strong resistance at 1.1700 rejected price
Short-term pullback is likely toward 1.1684 → 1.1670
Major support at 1.1664 may be the deeper target
Trend remains bullish, but retracements are natural
Key decision zone is the support shelf beneath current price
