An Exhaustive Analysis of Financial Market GapsAn Exhaustive Analysis of Financial Market Gaps: Mechanics, Psychology, and Advanced Trading Applications
● Part I: The Foundational Architecture of Price Gaps
The study of financial markets is, in essence, the study of price action. While much of this action is continuous, with transactions creating a seamless flow of data, there are moments of abrupt discontinuity that appear on price charts as voids or empty spaces. These phenomena, known as price gaps, are not mere charting curiosities; they are powerful signals that reveal profound shifts in the equilibrium between supply and demand, offering a unique window into market psychology and future price direction. Understanding the architecture of these gaps—their definition, their classification, and the complex web of factors that cause their formation—is a prerequisite for any sophisticated market participant seeking to interpret and navigate market dynamics effectively.
• Section 1: Defining the Phenomenon
At its most fundamental level, a price gap represents a range of prices at which no trades have occurred. This visual discontinuity on a price chart signifies a sudden and significant jump in an asset's price, where the opening price of one trading period is markedly different from the closing price of the preceding period.
• 1.1. The Anatomy of a Price Gap: Visual and Technical Definitions
A price gap, also referred to as a "window" in Japanese Candlestick charting, is a term used to describe a discontinuation in a price chart. Visually, it appears as an empty space between two consecutive trading periods, most commonly observed on daily bar or candlestick charts. The formation of a gap indicates that the market's perception of an asset's value has changed so dramatically that it bypasses a range of prices entirely.
• 1.2. A Taxonomy of Gap Formations: Full vs. Partial Gaps
Not all gaps are created equal in their structure or implications. This distinction gives rise to two main categories:
Partial Gap: Occurs when the opening price of the current session is higher or lower than the previous session's close, but still falls within the trading range (high and low) of that previous session.
Full Gap: Occurs when the opening price is completely outside the prior day's entire trading range.
• Section 2: The Genesis of Gaps: Causal Factors and Market Dynamics
Price gaps are the tangible result of a confluence of fundamental, technical, and market microstructure factors.
• 2.1. Fundamental Catalysts
Corporate Earnings Reports: Quarterly earnings reports are the most regular and potent catalysts for individual stocks.
Major News Events: Mergers, acquisitions, product launches, or regulatory changes.
Macroeconomic Data: GDP figures, CPI inflation reports, and interest rate decisions.
• 2.2. Technical Precursors
Support and Resistance Breakouts: A gap through a well-established level is a particularly powerful technical event.
Chart Pattern Completion: Gaps frequently serve as the confirmation signal for patterns like the cup and handle or head and shoulders.
Algorithmic Trading: Automated systems can exacerbate gaps when specific technical conditions are met.
● Part II: A Comprehensive Typology of Market Gaps
The ability to correctly classify a price gap is the most critical step in its analysis. Different types of gaps have vastly different implications for future price action.
• Section 3: The Four Archetypal Gaps: A Deep Dive
• 3.1. The Common Gap (or Trading/Area Gap)
Common Gaps are typically small in magnitude and characterized by normal or below-average trading volume. They usually appear within a sideways trading range and tend to be "filled" relatively quickly, often within a few days.
• 3.2. The Breakaway Gap (or Power Gap)
Signifies a decisive and forceful end to a period of consolidation.
Volume: Must be accompanied by a massive surge in trading volume (ideally 50% or more above the 50-day average).
Significance: Low probability of being filled in the near term; the gap area often transforms into a new support or resistance level.
• 3.3. The Runaway Gap (or Continuation/Measuring Gap)
Occurs in the middle of a well-established trend and signals that the prevailing momentum is strong. It is often driven by "FOMO" (Fear of Missing Out).
• 3.4. The Exhaustion Gap
Occurs near the end of a mature trend. The single most important feature is climactic trading volume . This represents the peak of emotional intensity, often followed by a rapid reversal and a high likelihood of the gap being filled.
• Section 4: Advanced and Specialized Gap Patterns
• 4.1. The Island Reversal
A distinctive and highly reliable chart pattern where a cluster of price bars is isolated by gaps on both sides. It represents a dramatic shift in market sentiment and is one of the strongest reversal signals in technical analysis.
• 4.2. Fair Value Gaps (FVG) and Liquidity Voids
An institutional perspective identifying market inefficiencies. An FVG is a three-candle pattern where the wick of the first and third candle do not overlap. Unlike breakaway gaps, FVGs are viewed as "magnets" that price will likely return to in order to rebalance liquidity.
● Part III: The Human Element and Empirical Realities
• Section 5: The Behavioral Science of Gaps
Irrational Exuberance: Drives bullish exhaustion gaps where optimism overrides fundamentals.
Panic and Capitulation: Drives downside exhaustion gaps at the end of a downtrend.
Herd Behavior: Amplifies price shocks as traders follow the collective crowd, often leading to initial overreactions.
"Breakaway, Runaway, and Exhaustion gaps are foundational technical formations rooted in crowd psychology and trend lifecycle stages. Conversely, the Fair Value Gap (FVG) is an institutional metric designed to identify price inefficiencies. While analytically distinct, these frameworks often converge within the same price action event, providing a dual perspective on market dynamics."
• Section 6: Statistical Analysis of the "Gap Fill"
The popular adage that "all gaps get filled" is an oversimplification.
Common/Exhaustion Gaps: Fill probability of 75-90%.
Breakaway Gaps: Fill probability of 35-65%.
Volume Impact: Gaps on low volume are 85% likely to fill within two sessions.
● Part IV: Application and Strategy
• Section 7: Strategic Frameworks for Gap Trading
Momentum-Based ("Gap and Go"): Trading with the gap. Best for Breakaway and Runaway gaps.
Mean-Reversion ("Fading the Gap"): Trading against the gap. Best for Common and Exhaustion gaps.
• Section 8: The Indispensable Role of Confirmation
Volume Spread Analysis: High volume validates breakaway gaps; climactic volume confirms exhaustion.
Momentum Oscillators (RSI, MACD): Identify divergences that suggest a gap might be exhausting rather than continuing.
Volatility Indicators (ATR): Used to set intelligent stop-losses based on the asset's specific character.
• Section 9: Advanced Risk Management
The single greatest danger in holding positions overnight is Gap Risk—the risk that price opens far beyond a pre-set stop-loss, causing significant slippage.
To manage this risk:
Avoid known catalysts (earnings).
Reduce position size during high-volatility weeks.
Use protective options (hedging).
● Part V: A Cross-Market Perspective
• Section 10: Comparative Gap Analysis Across Asset Classes
Equities: Daily gaps due to session closures; earnings are the primary driver.
Forex: Weekday gaps are rare; weekend gaps are the primary focus.
Commodities: Sensitive to supply shocks and interplay between global exchanges (CME vs LME).
Cryptocurrencies: Spot markets are 24/7 (no gaps), but CME Bitcoin Futures Gaps act as powerful price magnets with high fill rates.
● Part VI: Synthesis and Concluding Insights
• Section 11: Integrating Gap Analysis into a Holistic Market Framework
Effective gap analysis requires that:
Diagnosis Precedes Treatment: Classify the gap before selecting a strategy.
Volume is the Arbiter of Truth: It is the physical manifestation of market conviction.
Analysis is Probabilistic: There are no certainties, only shifts in likelihood based on context.
The study of price gaps remains one of the most compelling disciplines in financial markets, offering a record of collective emotion and a lens into market discovery.
Gaps

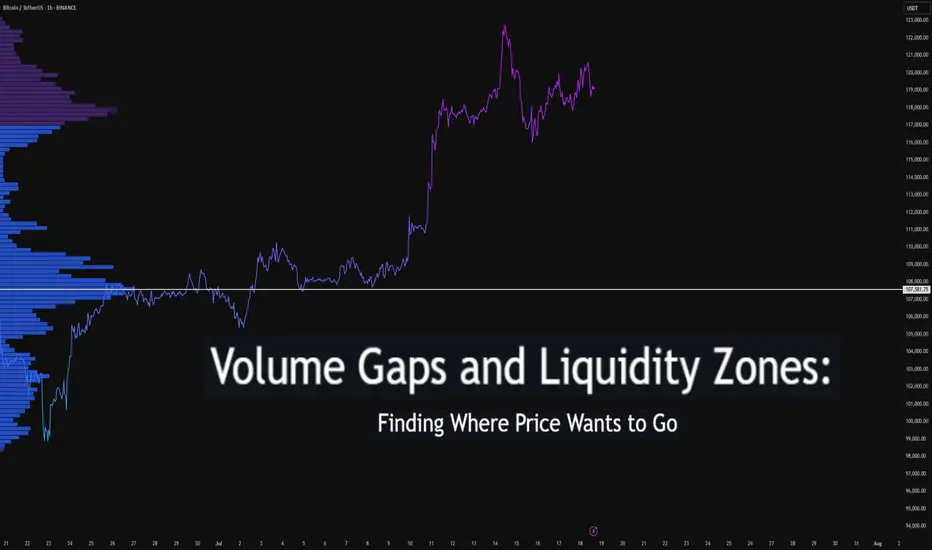
Volume Gaps and Liquidity Zones: Finding Where Price Wants to GoDifficulty: 🐳🐳🐳🐋🐋 (Intermediate+)
This article is best suited for traders familiar with volume profile, liquidity concepts, and price structure. It blends practical trading setups with deeper insights into how price seeks inefficiency and liquidity.
🔵 INTRODUCTION
Ever wonder why price suddenly accelerates toward a level — like it's being magnetized? It’s not magic. It’s liquidity . Markets move toward areas where orders are easiest to fill, and they often avoid areas with little interest.
In this article, you’ll learn how to identify volume gaps and liquidity zones using volume profiles and price action. These tools help you anticipate where price wants to go next — before it gets there.
🔵 WHAT ARE VOLUME GAPS?
A volume gap is a price region with unusually low traded volume . When price enters these areas, it often moves quickly — there’s less resistance.
Think of a volume gap as a thin patch of ice on a frozen lake. Once the market steps on it, it slides across rapidly.
Volume gaps usually show up on:
Volume Profile
Fixed Range Volume tools
Session or custom volume zones
They’re often created during impulsive moves or news events — when price skips levels without building interest.
🔵 WHAT ARE LIQUIDITY ZONES?
Liquidity zones are price areas where a large number of orders are likely to be sitting — stop losses, limit entries, or liquidation levels.
These zones often form around:
Swing highs and lows
Order blocks or fair value gaps
Consolidation breakouts
Psychological round numbers
When price approaches these areas, volume often spikes as those orders get filled — causing sharp rejections or breakouts.
🔵 WHY THIS MATTERS TO TRADERS
Markets are driven by liquidity.
Price doesn’t just move randomly — it hunts liquidity, clears inefficiencies, and fills orders.
Your edge: By combining volume gaps (low resistance) with liquidity zones (target areas), you can forecast where price wants to go .
Volume gap = acceleration path
Liquidity zone = destination / reversal point
🔵 HOW TO TRADE THIS CONCEPT
1️⃣ Identify Volume Gaps
Use a visible range volume profile or session volume. Look for tall bars (high interest) and valleys (low interest).
2️⃣ Mark Liquidity Zones
Use swing highs/lows, OBs, or EQH/EQL (equal highs/lows). These are magnet areas for price.
3️⃣ Watch for Reactions
When price enters a gap, expect speed.
When it nears a liquidity zone, watch for:
Volume spike
Wick rejections
S/R flip or OB retest
🔵 EXAMPLE SCENARIO
A strong bearish move creates a volume gap between 103 000 – 96 000
Below 96 000 sits bullish order blocks — clear liquidity
Price enters the gap and slides fast toward 96 000
A wick forms as buyers step in, volume spikes — the reversal begins
That’s price filling inefficiency and tapping liquidity .
🔵 TIPS FOR ADVANCED TRADERS
Use higher timeframes (4H/1D) to define major gaps
Look for overlapping gaps across sessions (Asia → London → NY)
Align your trades with trend: gap-fills against trend are riskier
Add OB or VWAP as confirmation near liquidity zones
🔵 CONCLUSION
Understanding volume gaps and liquidity zones is like reading the market’s intention map . Instead of reacting, you start predicting. Instead of chasing, you’re waiting for price to come to your zone — with a plan.
Price always seeks balance and liquidity . Your job is to spot where those forces are hiding.
Have you ever traded a volume gap into liquidity? Share your setup below
Earnings HFT gapsThe gaps that form during earnings season on or the next day after the CEO reports the revenues and income for that past quarter are always HFT driven. The concern over the past 2 previous quarters was the fact that the High Frequency Trading Firms were incorporating Artificial Intelligence into their Algos to make automated trading decisions on the millisecond scale. These small lot orders fill the ques milliseconds ahead of the market open in the US and any huge quantity of ORDERS (not lot size) causes the computers of the public exchanges and market to gap up or gap down, often a huge gap.
This can be problematic for those of you who use Pre Earnings Runs to enter a stock in anticipation of a positive to excellent earnings report for this upcoming quarter.
The HFT algos had several major flaws in the programming that did the opposite: The AI triggered sell orders rather than buy order causing the stock price to gap down hugely on good earnings news.
Be mindful that normal gaps due to a corporate event are far more reliable and consistent.
When you trade during earnings season, be aware that there is still added risk of an AI making a mistake and causing the stock to gap and run down on good news.
It is important to calculate the risk factors until it is evident by the end of this earnings season that the errors within the AI programming have been corrected and that the AI will gap appropriately to the actual facts rather than misinterpreted information.

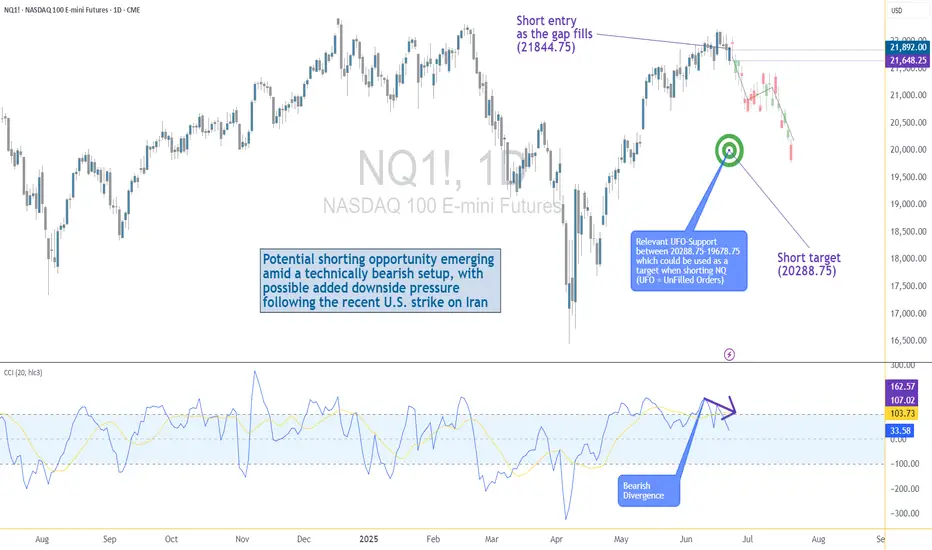
US–Iran Conflict Triggers a Potential Nasdaq Bearish Setup🟣 Geopolitical Flashpoint Meets Technical Confluence
The U.S. weekend airstrike on Iranian nuclear facilities has reignited geopolitical instability across the Middle East. While broader markets often absorb news cycles quickly, high-beta assets like Nasdaq futures (NQ) tend to react more dramatically—especially when uncertainty meets existing technical vulnerability.
Monday’s session opened with a notable gap to the downside, reflecting immediate risk-off sentiment among futures traders. While the initial drop is being retraced intraday, historical patterns suggest that such gap-fills can often serve as ideal shorting zones—particularly when other bearish signals confirm the narrative. The backdrop is clear: this is no ordinary Monday open.
🟣 Bearish Divergence on CCI Builds the Case
From a technical standpoint, the setup gains weight through a clear bearish divergence on the Commodity Channel Index (CCI) using a 20-period setting. While prices recently pushed higher, momentum failed to follow—an early indication that buyers may be running out of steam. This divergence appears just as price approaches the origin of Friday’s gap, a level that frequently acts as a resistance magnet in such contexts. This confluence of weakening momentum and overhead supply aligns perfectly with the geopolitical catalyst, offering traders a compelling argument for a potential reversal in the short term.
🟣 Gap Origin: The Line in the Sand
The origin of the gap sits at 21844.75, a price level now acting as potential resistance. As the market attempts to climb back toward this zone, the likelihood of encountering institutional selling pressure increases. Gap origins often represent unfinished business—zones where prior bullish control was suddenly interrupted. In this case, the added layer of global tension only strengthens the conviction that sellers may look to reassert dominance here. If price action stalls or rejects at this zone, it could become the pivot point for a swift move lower, especially with bearish momentum already flashing caution signals.
🟣 Trade Plan and Reward-to-Risk Breakdown
A potential short trade could be structured using 21844.75 as the entry point—precisely at the gap origin. A conservative stop placement would rest just above the most recent swing high at 22222.00, offering protection against a temporary squeeze. The downside target aligns with a prior UFO support area near 20288.75, where demand previously showed presence. This sets up a risk of 377.25 points versus a potential reward of 1556.00 points, resulting in a reward-to-risk ratio of 4.12:1. For traders seeking asymmetrical opportunity, this ratio stands out as a strong incentive to engage with discipline.
🟣 Futures Specs: Know What You’re Trading
Traders should be aware of contract specifics before engaging. The E-mini Nasdaq-100 Futures (NQ) represent $20 per point, with a minimum tick of 0.25 worth $5.00. Typical margin requirements hover around $31,000, depending on the broker.
For smaller accounts, the Micro Nasdaq-100 Futures (MNQ) offer 1/10th the exposure. Each point is worth $2, with a $0.50 tick value and much lower margins near $3,100.
🟣 Discipline First: Why Risk Management Matters
Volatility driven by geopolitical events can deliver fast gains—but just as easily, fast losses. That’s why stop-loss orders are non-negotiable. Without one, traders expose themselves to unlimited downside, especially in leveraged instruments like futures. Equally critical is the precision of entry and exit levels. Acting too early or too late—even by a few points—can compromise an otherwise solid trade. Always size positions according to your account, and never let emotion override logic. Risk management isn’t a side-note—it’s the foundation that separates professionals from those who simply speculate.
When charting futures, the data provided could be delayed. Traders working with the ticker symbols discussed in this idea may prefer to use CME Group real-time data plan on TradingView: www.tradingview.com - This consideration is particularly important for shorter-term traders, whereas it may be less critical for those focused on longer-term trading strategies.
General Disclaimer:
The trade ideas presented herein are solely for illustrative purposes forming a part of a case study intended to demonstrate key principles in risk management within the context of the specific market scenarios discussed. These ideas are not to be interpreted as investment recommendations or financial advice. They do not endorse or promote any specific trading strategies, financial products, or services. The information provided is based on data believed to be reliable; however, its accuracy or completeness cannot be guaranteed. Trading in financial markets involves risks, including the potential loss of principal. Each individual should conduct their own research and consult with professional financial advisors before making any investment decisions. The author or publisher of this content bears no responsibility for any actions taken based on the information provided or for any resultant financial or other losses.
Price Gap Examples - Bitcoin FuturesSharing for educational purposes only.
█ Three Types of Gaps
There are three general types of gaps:
Breakaway Gap
Runaway (or Measuring) Gap
Exhaustion Gap
█ 1 — The Breakaway Gap
The breakaway gap usually occurs:
At the completion of an important price pattern.
At the beginning of a significant market move
Examples:
After a market completes a major basing pattern, the breaking of resistance often involves a breakaway gap.
Breaking major trendlines signaling a reversal of trend may also involve this type of gap
Key Characteristics:
Heavy volume often accompanies breakaway gaps.
They are typically not filled (or only partially filled).
In an uptrend, upside gaps act as support areas on subsequent corrections.
A close below the gap is a sign of weakness.
█ 2 — The Runaway or Measuring Gap
The runaway gap forms:
Midway through a trend (uptrend or downtrend).
Indicates the market is moving effortlessly, usually on moderate volume.
Key Characteristics:
In an uptrend, it signals strength.
In a downtrend, it signals weakness.
Acts as support or resistance during subsequent corrections.
Why "Measuring" Gap?
It often occurs at the halfway point of a trend.
By measuring the distance the trend has already traveled, the probable extent of the remaining move can be estimated by doubling the amount already achieved.
█ 3 — The Exhaustion Gap
The exhaustion gap appears:
Near the end of a market move.
Key Characteristics:
Occurs after objectives have been achieved and other gap types (breakaway and runaway) have been identified.
In an uptrend, prices leap forward in a final push but quickly fade.
Within a couple of days or a week, prices turn lower.
█ Conclusion
By understanding the types of gaps and their characteristics, traders can better interpret market signals and anticipate potential trends or reversals.
█ Source:
Murphy, John J. Technical Analysis of the Financial Markets: A Comprehensive Guide to Trading Methods and Applications. New York Institute of Finance, 1999. Chapter 4, "Price Gaps," pp. 94-98.

Learning Price Action Through ObservationLearning Happens when you're open and curious and making observations from what you see. From there, you must be mentally balanced to take action on your observations.
In this post, I focus on the price action that happens in the pivot portion of a swing cycle. If you make observations of this area you will see a certain kind of repeating behavior that can help you understand and design methods for trading swings. You will notice that the market likes to wash everybody out of their positions before pivoting to continue its swing.
I have a look at two of the ways this shows up in the price action of a pivot. The first is an engulfing bar that expands and swallows at least 3 of the previous bars. The second is a Gap Swap where there will be a WRB Gap making an effort in one direction just to be followed by another WRB GAP that reverses that effort and direction and shows that the balance of power has shifted.
This is just a small part of what makes up a swing but it factors into my overall methods and trade plan. You can make observations yourself on pivots and see what you can learn.
Shane

QUICK AND EASY WAY TO MAKE A CHART (GAPS) - PLTRIF your an advanced trader and good at charting, you likely won't find this information useful. In the future, I'll have more educational posts that go in depth, but this one is for the newbies.
STEP 1 - Find your gaps (circled in blue) ONLY MARK GAPS THAT HAVE YET TO CLOSE
STEP 2 - MARK your GAPS with a Horizontal Line (alt + h)
STEP 3 - DUPLICATE your Horizontal lines (CTRL + CLICK each line while holding ctrl to multi select lines, CTRL + SHIFT + CLICK AND DRAG to duplicate)
STEP 4 - These are now your long term trading zones (COLOR Lines accordingly, TIP - Try not to pick colors that blend together) red and green do not mean buy/sell, they mean top of the gap, and bottom of the gap, 4.22% or so... It doesn't need to be exact.
STEP 5 - Line thickness (IF multiple lines stack up, you can create a thick line to simplify chart. KEEP IT SIMPLE, REMEMBER, this is not to be exact, this is to create zones to prepare you for future movements based on past gaps)
Why is this useful? Well, if you know a price gap is statistically likely to close, then you can be pretty certain that at some point in the future, that gap will close, meaning price will return to @ or above the price gap.
With this in mind, you can plan ahead and start to realize when your emotions are getting the best of you.
This is also great because you can do this on any time frame with candles.
Why ISNT this useful? Well, this gives you no indication of timing. Past results don't guarantee future results. AND this gives you no indication of current price action. In other words, a GAP could form and close 2 years later, and the entire time before it closes, price keeps going lower and lower.
Good luck, and remember, this is just a quick and easy way for newer users to identify potential price targets, while limiting emotion in decision making.

Tracking The Footprints of WRB GapsThis is the first in a series of posts on Gaps. Gaps are a sudden supply/demand imbalance that shows up in the price bars of a chart, It's the expansion that comes after a contraction. Gaps will show us a significant area of buyers/sellers that take control and when they lose that control.
In the video, I discuss and define a Wide Range Bar (WRB) Gap and show how to mark it out on a chart. A WRB Gap is a bar larger than the last 3 bars with a space between the previous bar and the subsequent bar. We will be marking the base of the gap. If it's an up Gap, mark out the bottom 1/3 of the bar, if it's a down gap, mark out the upper 1/3 of the bar.
We can then make observations about how price interacts with the base of this gap when or if it gets there. Then begin to notice where in the swing process the Gap is happening. Don't make conclusions, just observe and learn.
There are many ways to trade Gaps but first, we must first lay out some foundations and then come up with objective ways to see them. For now, simply look for the biggest ugliest bars on your chart and mark them out and observe. These are footprints that we can follow and track.
Shane

GAP - HOW TO TRADE...This video is for information/education purpose only. you are 100% responsible for any actions you take by reading/viewing this post.
please consult your financial advisor before taking any action.
----Vinaykumar hiremath, CMT

Gaps and How Markets Move In Contraction and ExpansionThere are several ways to trade gaps but first, there should be a solid understanding of what Gaps are and how they show up. Markets aren't that hard to read if we have some simple ways to see them that adhere to the principles of movement.
All markets move in contraction and expansion. A Gap is the sudden supply/demand imbalance that comes out of the contraction and shows up as the expansion. These expansions can even be used to measure how far the next expansion will go.
Start with a simple bar chart and erase everything else off the chart. Look and simply see the dense areas of contraction (Range). Then see the expansion (Gap), followed by another contraction.
Look for same-size contractions and expansion and you will start to see how organized price flow can be. It's no different than swings in that minor contractions and expansions make up the major contractions and expansions.
Shane

The Gap Between What Is and What Will BeThere are 5 basic ways to trade a Gap or any line. In this video, I discuss two ways to enter the market using a Gap before I make the trade plan. The Gap entry techniques by themselves are of little use, but if we make a few distinctions in market structure and the process of a swing cycle, they can become functional.
Swing cycles have a process that they go through. As long as we understand that process we can view Gaps in the light of where they happen in that process. I'm going to focus these two Gap entry techniques in the lower portion of the reaction leg at the bottom pivot of a swing. The Gaps are what make up the pivot portion of the swing.
If you observe markets and swings you will often see this distinct pivot portion of a swing, it looks like a U at the bottom of a reaction leg as the buyers wrestle control back from the sellers.
Shane

Market Gaps: Strategies, Types, Fills and Crypto.Greetings, traders!
If you appreciate our charts, give us a quick 💜💜
In stock trading, gaps can significantly impact market dynamics. They occur when a stock's price makes a sudden leap between two candlesticks, often due to substantial news breaking after market hours.
These gaps can be upward (gap up) or downward (gap down), signifying abrupt shifts in market sentiment.
Understanding Gap Types:
Common Gaps: These gaps appear without any specific underlying event and are often encountered in stocks with low trading volumes.
Breakaway Gaps: Breakaway gaps are akin to a breakout, occurring when a stock price surges above a resistance level or plunges below a support level, breaking established market norms.
Continuation Gaps: These gaps arise in the direction of an existing trend, typically propelled by increased buying or selling activity.
Exhaustion Gaps: Exhaustion gaps signal a potential reversal of the trend, but they usually occur on low trading volumes.
Unpacking the Gap Fill Phenomenon:
Gap "fill" occurs when the stock price retraces to pre-gap levels, offering traders opportunities to benefit from the market's oscillations. However, not all gaps experience this reversion, especially breakaway gaps, as broken support or resistance might hinder the fill.
Trading Gap Fills:
Strategies and Considerations: To navigate the complex landscape of gaps and gap fills, traders should consider several key factors:
Tailored Strategies: Crafting strategies based on the gap type, the prevailing market trends, and trading volumes.
Volume Analysis: High trading volume often indicates a continuation of the gap, while low volume may suggest a potential gap fill.
Patience is Key: Traders should exercise patience, waiting for a confirmed trend to emerge before making trading decisions.
Breakaway Gaps: While many gaps in trading tend to fill over time, breakaway gaps possess unique characteristics that often result in them remaining open.
Breakaway gaps typically stand out due to:
Robust Momentum: These gaps are typically backed by powerful market momentum, making it difficult for prices to retreat quickly.
New Market Perception: They often signal a significant shift in how the market views a stock's value, establishing a new price reality.
Lack of Immediate Resistance: Occurring where trading activity is limited, breakaway gaps find little resistance to their newfound position.
Market-Wide Acceptance: When breakaway gaps respond to widely accepted news or events, the market solidifies the new price level, resisting attempts to fill the gap.
Altered Investor Psychology: These gaps can initiate shifts in investor psychology, leading to sustained buying or selling pressure, reinforcing the gap's persistence.
Navigating Risk and Opportunity in Unfilled Gaps:
Unfilled gaps can present challenges, but they also offer unique opportunities. Traders who understand the enduring nature of breakaway gaps can develop strategies that harness the momentum and trend shifts linked to these gaps. By aligning trades with prevailing market sentiment, traders can leverage the complexities of unfilled gaps to their advantage.
Cryptocurrency Market: An Exception to the Gap Rule:
It's important to note that the cryptocurrency market operates differently from traditional stock markets. Gaps are relatively rare in the crypto realm, primarily due to its 24/7 trading structure. The continuous trading activity minimizes the possibility of significant price gaps.
However, rapid and substantial price changes can result in occasional "gap-like" phenomena. For instance, a sudden surge in buying or selling activity can lead to notable price shifts. Understanding these distinctions is crucial when trading cryptocurrencies.
Recognizing gap types, considering market context, and aligning strategies with prevailing market sentiment can empower traders to navigate the intricacies of gaps and leverage them effectively. In the cryptocurrency market, it's essential to comprehend the unique dynamics that affect gap occurrences.

📊 Liquidity Gaps CheatsheetIn volatile markets, traders can benefit from large jumps in asset prices if they can be turned into opportunities. Gaps are areas on a chart where the price of a stock (or another financial instrument) moves sharply up or down, with little or no trading in between. As a result, the asset’s chart shows a gap in the normal price pattern. The enterprising trader can interpret and exploit these gaps for profit.
📌 What is a gap?
A gap occurs when the price of a security moves quickly through a price level, either up or down, with little trading or pricing available over that time span.
📌 How they are formed
Gaps can be caused by several factors, but they are mostly seen as a result of unexpected news or a technical breach of support or resistance.
🔹 On the fundamental side , the news could be a company beating earnings estimates by a large margin, or a speech by a Federal Reserve (Fed) official impacting interest rate expectations.
🔹 On the technical side, gaps can ensue following the break of a prior high/low, or other form of technical resistance or support, such as a key trend line.
💥 Key Takeaways About GAPS
🔹 Gaps are spaces on a chart that emerge when the price of the financial instrument significantly changes, with little or no trading in between.
🔹 Gaps can occur unexpectedly as the perceived value of the investment changes, due to underlying fundamental or technical factors, such as an earnings disappointment.
🔹 Gaps are classified as breakaway, exhaustion, common, or continuation, based on when they occur in a price pattern and what they signal.
👤 @QuantVue
📅 Daily Ideas about market update, psychology & indicators
❤️ If you appreciate our work, please like, comment and follow ❤️

4 TYPES OF TRADING GAPS Less is more... And this is just a summary of the most common 4 types of Gaps you may see,...
1. Break-away – Breaks out of a current trend
2. Exhaustion – Ends a current trend
3. Runaway – Runs in the direction of the trend
4. Common – Just an ordinary gap
Can you think of any more gaps?

EXPLAINED: Runaway GapLESSON OF THE DAY
Runaway Gap
A Runaway Gap is a continuation move where the price gaps in the middle of a trend e..g Up or Down.
The gap is a void (where no prices overlap between two candles)
And then the price follows the previous trend.
I like to think of a Runaway Gap as a horse that goes from trotting to galloping.
The trend then starts to accelerate and continue in the direction.
Specifics for this example:
· Previous price moves in a downtrend.
· Price then gaps.
· Price then follows the continuous downtrend.
Please react so I know to provide more daily lessons...

Trade so easy with FAIR VALUE GAPS!Hello trader, you look great today! I have a useful trading tool to offer you. If you are experiencing positive feelings towards me, please consider following me and helping to increase my exposure.
FAIR VOLUE GAP
First, go to tradingview and search up Fair Volue Gap . Now, you can see your chart dashed lines, to see levels based on these pages. FVG and to make this set up a lot better though we want to clean this up and only show significant Fair Volue Gaps by going into the settings and selecting the auto threshold. What this does is allows the indicator to detect the average best size of each Fair Value Gap to filter out insignificant ones.

Types of Gaps !!!👨🏫Hello👨🏻🏫, dear traders from all over the world🗺️.
I'm Pejman🙋🏻♂️ & welcome🌸 to one more educational adventure🧭 in Tradingview, but we will not be traders💹 today; We want to look at our charts like a hunter🏹.
We look for every clue🐾 we see so that we can hunt suitable positions💱 like valuable creatures💰 and transfer them to the cages as our accounts💳 or wallets💸.
Although I'm not too fond🙍🏻♂️ of hunting, either legally or illegally.
But I know that hunting good positions in the forests🏞️🌳 of Tradingview is not prohibited😉❗.
So let's get acquainted with these clues🔎 as soon as possible because the price is skittish🙈, and we don't want to waste the hunting time⏳✅.
I said that in Technical Analysis , we look for ways to trade by using the price information, which is recorded on the charts📈. (such as the prey's tracks🔎🐾)
Today I want to introduce one of these clues so that you can become a professional position hunter🏹 by identifying the clues👀;
But don't forget that you should practice🙌🏻, be careful⚠️, and watch your positions👀, so you don't miss them or rush 🏎️💨to the wrong❌ position🙂.
Today's clue is the GAPS . First, let's see what the GAP is🤔.
The gap is nothing. I mean, it is something that is nothing😶🙄.
It is incredibly paradoxical💥! I'm kidding😉, but the space between candles🕯️ or bars is called a GAP.
A gap is created when we see👀 a price gap between two candles🕯️ or bars when the trading volume is high⏫ or low⏬. This difference or space between two candles is called a gap🤏🏻.
It is said that gaps are more valuable✅ in higher time frames among the traders, so much coin, much care👀.
Gaps, or as the Japanese🎌 term "windows," are significant for hunting🏹 positions, so as hunter traders, we should learn these gaps well👌🏻.
The reason🧐 for creating gaps can be factors such as important positive🆒 or negative🙈 news or an increase🔺 or decrease🔻 in supply and demand.
It is interesting to know that gaps are primarily seen in Forex , Stocks , and Commodities (especially when markets close and open).
The space👌🏻 between the candles means that the price has jumped like a rabbit🐰 from one number to the upper☝🏻 different number.
Or, like a monkey🐒, it moved from one number to a lower👇🏻 number.
I tried to make it funny😊 and straightforward👌🏻, but these gaps that move up or down have different types, like the year's seasons🌈☁️.
We have 4️⃣ seasons in a year and also 4️⃣ types of gaps in the charts.
According to personal taste😊, I relate the gaps to the year's seasons and, simultaneously, do not forget the case of hunting positions🏹💰.
So fasten your seat belts💺 because we want to travel in time🧳⏳ to all the year's seasons with this post🚩 and learn about the different price gaps, which are one of our clues🐾 to trap positions🪤.
Let's start with the autumn🍂 season because we are still in it and can understand it better😌.
---------------------------------------------------------------------------------------------------------------------------------------------------------------------------------------------------------------
The name of this type of Exhaustion 🥱 gap.
They are seen at the end🔚 of a process, which means that the process may change🔄 at any moment.
Just like the autumn🍁 season, it may rain☔ anytime after seeing the clouds🌥️.
Another feature of this gap is the increase🆙 in trading volume, so by paying attention👀 to these points and practicing by reviewing the charts📈, you can easily recognize🔎 this gap.
---------------------------------------------------------------------------------------------------------------------------------------------------------------------------------------------------------------
The next💁🏻♂️ gap is the Breakaway 🏃🏻♂️ gap.
The breakaway gap is associated with an increase⤴️ in trading volume.
This gap occurs when a critical range is broken🤞🏻, representing a strong💪🏻 start🏁 trend or a sign of trend change.
Like the blooming🏵️ of some trees🌳 in winter☃️ or the sprouting🌱 of plants from under the snow❄️.
Also, This gap is created when the price starts moving from a limited area, like support or resistance ( I'm going to talk about them in the future😉. )
I have to say that the breakaway gap plays a critical👌🏻 role in some of the classic reversal patterns, such as the Head and Shoulders Pattern , Double Top/Bottom Patterns , etc.
When The breakaway gap is combined with Classic Reversal Patterns, the breakaway gap adds to these patterns' validity✅.
If you want to get acquainted with the most important Classic Reversal Patterns of Technical Analysis , I suggest you read the following post👇.
---------------------------------------------------------------------------------------------------------------------------------------------------------------------------------------------------------------
Now it's time for spring🌸🍀, and I'm going to introduce a gap like spring.
Spring season is a sign✌🏻 of the continuation of life💐, and this gap in technical analysis shows the continuation of a trend📈.
The Continuation gap is also known as a Runaway 🏃🏻♂️ gap, occurring in the middle of a downward↙️ or upward↗️ trend.
This type of gap creates a kind of confidence for traders to enter.
It doesn't occur when the price fluctuates or corrects in a limited area but occurs during a rapid increase or decrease.
So, as a result ☑️, if this gap occurs in an upward trend🔺, it indicates the continuation of the upward movement.
And when it is created in a downward trend🔻, it indicates the entry of more sellers and further price decline.
---------------------------------------------------------------------------------------------------------------------------------------------------------------------------------------------------------------
Now we have reached✌🏻 the last gap🥰.
This gap is Common , but I should introduce it as the summer☀️ season.
These gaps are very common, And considering the time frame it has, it is expected to fill quickly, which is also called "closing the gap."
The filling or closing of the gap means that the price returns🔁 to the same area where the gap was created, like a criminal returning to the crime scene😄.
This can be true✅ for gaps as well.
Time flies in summer🏝️, and Common and Exhaustion 🥱gaps fill as soon as a blink👁️.
You may have heard👂🏻 that gaps are always filled, but this is not permanent🙅🏻♂️ and only a strong possibility🤏🏻.
For example, Continuation 🏃🏻♂️ & Breakaway gaps usually take a long time⌛ to fill.
But what if the gap doesn't close🤷🏻♂️?
Go to any currency pair and examine👀 the recorded data🗄️; You will find that many gaps take a year or more to close.
It is interesting😃 to know that the Japanese🎌 have another interpretation of the price gap.
They use gaps as continuation and reversal trading patterns (as I said, I'll explain them in future posts🔜😉).
It is interesting to know that the combination of gaps can create the Island reversal pattern.
The Island pattern consists of two gaps ; One up⬆️ and one down⬇️.
We will definitely✅ learn more about these patterns in the following posts🔜, but today we are only focusing on the gaps🧐.
---------------------------------------------------------------------------------------------------------------------------------------------------------------------------------------------------------------
Another thing I want to add➕ is about the Heikin-Ashi charts💹 that we learned about in the previous post🔙.
Gaps are filtered❌ in Heikin-Ashi charts.
As I said, in this chart, the average is displayed between two✌🏻 consecutive candles; even candlestick patterns are filtered❌.
So, the type of chart is also essential👌🏻 for finding gaps.
Well, I gave you the basic tips to identify these gaps🤏🏻, and now you can carefully look👀 for them in your charts💹.
Practice this information for a bit, as I will be back soon🔜 with an educational post👨🏻🏫 on how to trade💰 with these gaps.
If you have any questions❓, you can ask me💬.
We will get acquainted with new clues🔎 in new posts, so until that day, take care of your knowledge📊 and increase it every day📈, because according to Kofi Anan:
Knowledge is power💪🏻, and information is liberating. Education📚 is the beginning of progress in every society🏙️, in every family👨👩👧👧.
I hope you become stronger🙌🏻 daily by using your knowledge, and I will also increase your progress by teaching you the introduction.
I wish🙌🏻 you happiness, health😍, and success😎.

Gap TheoryThe gap theory is short and simple. Not everything needs to be lengthy and laborious. "Everything should be simple as possible, but not any simpler"
Break-Away Gap
Once a new cycle has begun and you see a breakaway gap in the STARTING of a move, you get confirmation of this new cycle. HOLD.
Run-Away Gap
Once the trend is continuing for some time and then you see a second gap, this is a confirmation that you are somewhere in the MIDDLE of the move, so you know a further movement in price is expected. HOLD.
There is a possibility that you can get multiple runaway gaps.
Exhaustion Gap
After a move in price had already happened, a gap that signals the END of the move happens. If this is your 3rd gap on the, you should look very closely to distinguish if it is a runaway gap or exhaustion gap. SELL.
How do you tell the difference between the exhaustion gap and the runaway gap?
Easy, if after the gap happens the price shoot straight up without closing the gap in the next few days ---> runaway gap. HOLD.
if after the gap happens the price is closing the gap in the next few days ---> exhaustion gap. SELL.
If you like it, follow and like so it will be saved in your saved ideas for future reference.

Gold Part 17.10.20 Gold: Specifically, I would like to look at presses and gaps. In my videos I try to look at aspects of trading that probably not that typical...in a number of ways. If you listen to me...you probably have to be patient...and forgiving ( for obvious reasons )>>>but I am trying to offer value. I have to do a Part 2....to clean up lose ends...and I want to talk about USDCAD. Please give a thumbs up if you got something from it.

Bitcoin - What is GAP?You may have noticed that I often use the word GAP, after many questions about what it is. I thought I'd tell you.
What is GAP?
If translated verbatim, a GAP (GAP) is a gap, the difference between quotes on Friday and the opening of the market on Monday. And if the difference between the closing price on Friday and the opening on Monday is significant, then a jump will occur. That is, the price is noticeably higher or lower than the price that was on Friday and it is clearly visible on the chart, as in the example below:
We can see that the closing price on Friday was about $9295 and the opening price on Monday was $9705. That is about 410 points higher than the closing price on Friday:
And this gap, which is formed between the market close price on Friday and the opening price on Monday, is called the GAP. Naturally, a GAP is not always formed. On average, it can be seen once a month and is more common in Forex and stock markets. Sometimes more often, sometimes less often, but the fact is that GAPs happen and you can make money on them.
Why do GAPs happen?
GAPs occur because during the time when the market is not active, namely over the weekend, a certain number of sell and buy orders are accumulated. And when the market opens on the night from Sunday to Monday, these very orders collapse and create a jump, as we saw on the chart earlier.
Of course, this does not always happen, but only when there is a significant advantage in Buy or Sell orders accumulated over the weekend. Market makers see a huge number of Buy or Sell orders and, accordingly, we see the price visually above or below the market close values on Friday.
As for the crypt currency: the futures market does not work over the weekend, while the crypt currency exchanges work 24/7, the price during the weekend can be called.
It is worth noting one important point. As a rule, GAPs tend to close.
Let us consider an example:
Why do GAPs tend to close?
The fact is that when the market opens significantly higher or significantly lower than Friday's price, then many orders are activated, many pending orders to buy or sell. Naturally, the stops of these orders are located near the Friday closing price. And thus market makers try to knock out the stops of those guys whose orders have worked at the opening of the market and take their money for themselves.
After the gap was closed, the market can go absolutely in any direction. There are no special regularities here. In general, the gap tends to close, but sometimes it happens that there is a jump in opening prices on Monday, and it continues. It happens only when there is a strong trend movement or some fundamental factors come into play. For example, something could have happened in the economy over the weekend. That is, there is a tendency to close, but not always. You should keep that in mind!
The probability of closing the gap is ≈ 70%
Push ❤️ if you think this is a useful idea!
Thanks for your support!

Runaway gap or Measuring Gap In Technical AnalysisThree types of gaps: Breakaway, Runaway or Measuring Gap and Exhaustion Gap.
Runaway gap or Measuring Gap:
It can be a gap or series of gap in the middle of a trend (uptrend or downtrend) – We can use this gap to measure the remaining move just doubling the amount already achieved since the start of the trend
It moves with moderate volume
It is a sign of strength of the market (weakness for a downtrend)
Runaway gaps can work as support areas for subsequent market corrections
They are generally not filled
If you are interested in Technical Analysis Theory, please subscribe and watch my Lessons
studio.youtube.com

The Importance of Gaps in Technical AnalysisThree types of gaps: Breakaway, Runaway or Measuring Gap and Exhaustion Gap.
Breakaway gap:
1.At a completion of an important price pattern and generally the breaking of a resistance occurs on a breakaway gap
They sign the beginning of a significant market move
2.Breaking of a major trendline, in a reversal signal can also see a breakaway gap
3.They occur on heavy volume
4. Heavier are the volume, less likely the gap will be filled
5.The gap could be filled (generally not all the gap)
6. Upside gap they can work as support areas for subsequent market corrections
7. During an uptrend, it is important that prices do not follow below the gap, otherwise it is a sign of weakness
If you are interested in Technical Analysis Theory, please subscribe and watch my Lessons
studio.youtube.com

