Liquidity ≠ Volume: The Truth Most Traders Never Learn█ Liquidity ≠ Volume: The Truth Most Traders Never Learn
Most traders obsess over volume bars, but volume is the footprint, not the path forward.
If you’ve ever seen price explode with no volume or fail despite strong volume, you’ve witnessed liquidity in action.
█ Here’s what you need to know
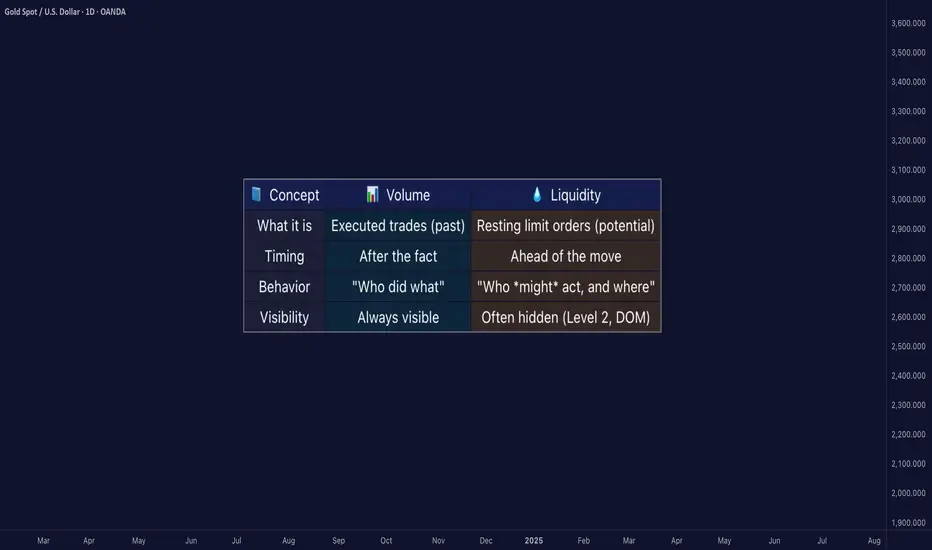
⚪ Volume Is Reactive — Liquidity Is Predictive
Volume tells you what happened.
Liquidity tells you what can happen.
█ Scenario 1: Price Jumps on Low Volume
❝ A price can jump on low volume if no liquidity exists above.❞
⚪ What’s happening?
The order book is thin above the current price (i.e., few or no sellers).
Even a small market buy order clears out available asks and pushes price up multiple levels.
Volume is low, but the impact is high because there’s no resistance.
⚪ Implication:
This is called a liquidity vacuum.
It can happen before news, during rebalancing, before session openings, on illiquid instruments, or during off-hours.
Traders often overestimate the strength of the move because they only see the candle, not the absence of offers behind it.
█ Scenario 2: Move Fails on High Volume
❝ A move can fail on high volume if it runs into a wall of offers or bids.❞
⚪ What’s happening?
There’s a strong surge of aggressive buying or selling (high volume).
But the order book has deep liquidity at that level — large resting limit orders.
The aggressive traders can’t chew through the liquidity wall, and price stalls or reverses.
⚪ Implication:
This is called liquidity absorption.
Market makers or institutions may intentionally absorb flow to stop a breakout.
Many retail traders mistake this for “fakeouts,” but it’s really liquidity defending a level.
⚪ What the Research Says
Cont, Stoikov, Talreja (2014): Price responds more to order book imbalance than trade volume.
Bouchaud et al. (2009): Liquidity gaps, not trade size, are what truly move markets.
Hasbrouck (1991): Trades only impact price if they consume liquidity.
Institutions don’t chase candles — they model depth, imbalance, and liquidity resilience.
⚪ Where the Alpha Lives
Liquidity tells you where the market is weak, strong, or vulnerable — before price moves.
Fakeouts happen in thin books.
Reversals occur at hidden walls of liquidity.
Breakouts sustain when liquidity follows the price, not pulls away.
If you understand this, you can:
Enter before volume shows up
Avoid chasing dead breakouts
Fade failed moves into empty space
█ Final Truth
Volume is the echo. Liquidity is the terrain. Alpha is in reading the terrain. You want to study the structure, because price moves toward weakness and away from strength. Learn to see where liquidity is, or where it’s missing, and you’ll see trading with new eyes.
-----------------
Disclaimer
The content provided in my scripts, indicators, ideas, algorithms, and systems is for educational and informational purposes only. It does not constitute financial advice, investment recommendations, or a solicitation to buy or sell any financial instruments. I will not accept liability for any loss or damage, including without limitation any loss of profit, which may arise directly or indirectly from the use of or reliance on such information.
All investments involve risk, and the past performance of a security, industry, sector, market, financial product, trading strategy, backtest, or individual's trading does not guarantee future results or returns. Investors are fully responsible for any investment decisions they make. Such decisions should be based solely on an evaluation of their financial circumstances, investment objectives, risk tolerance, and liquidity needs.
Liquidationlevels
Liquidation-Level LibraryThis is a follow up information, the function-Library used to create this drawings here is now released.
Feel free to connect whatever indicator you like to create the starts
on the bottom of the library you can see a standard implementation,
a short example:
//define:
var Liquidationline Liqui_Line_L = array.new ()
if Any_alert
f_liqline_add(_Liqui_Line = Liqui_Line_L, linetoadd = set_l,_limit = 250)
f_liqline_draw(_Liqui_Line = Liqui_Line_L, _priceorliq = priceorliq)
f_liqline_update(_Liqui_Line = Liqui_Line_L, _killonlowhigh = killonlowhigh)

Elevate Your Trading | How to Track Liquidity and How to TradeEver thought a price moves because it's on support level or below a resistance level? Or because your favourite indicators show a buy/sell signal and you want the price to see the same and move in you favourite direction? A Big No, dear. That simply won't happen...
The main gyrator of the market is "Liquidity"
What is liquidity?
Liquidity, in very simple terms, is where stops are. And that's (mainly) below relative equal lows or above relative equal highs... So you're now maybe thinking, "well, that's why I get stopped out just before the price moves violently in my previous direction.."
Exactly, that's it... Learn how to see where liquidity is resting and how to to become engaged in a good trade...
That's exactly what I want you to do...
And here is one lesson of many that I will post.. in addition to live calls when I see high-probability setups... I will turn your eyes to it...
Ther are a lot more to come, so don't forget to ▶️ LIKE ▶️ FOLLOW to keep updated with everything I post..
Let me know in the comments what you wanna be the second lesson on..
Good Luck&Be Safe
