Gold Tutorial : How to Trade GOLD with Syndicate Order BlockGold Tutorial : How to Trade GOLD with Syndicate Order Block
🥇 Practical Gold Tutorial (Updated): How to Trade XAUUSD with Syndicate Order Block Finder
✅1) Setup (TradingView)
Step A — Add the script
Open XAUUSD on TradingView
Indicators → search: Order Block Finder | Gold | ProjectSyndicate
Add to chart
Step B — Pick your workflow timeframe
Use this simple map (it keeps you consistent):
H4 / H1 = Zone discovery (major OBs)
M30 = Trading plan + cleaner execution
M10 / M5 = Sniper entries + tight invalidation
🛠️ 2) Recommended Settings by Timeframe
Use these presets as your “Gold defaults”:
M5: Swing Length 5–7, Displacement 1.2–1.4
M10: Swing Length 5–7, Displacement 1.2–1.4
M30: Swing Length 5–7, Displacement 1.2–1.4
H1: Swing Length 7–9, Displacement 1.3–1.6
H4: Swing Length 8–10, Displacement 1.5–2.0
💡 Quick rule:
Want more signals → reduce Swing Length
Want higher quality only → increase Displacement
3) What the boxes mean (fast + practical) 📌
Bullish OB (Demand): last bearish candle before strong bullish displacement + BOS
Bearish OB (Supply): last bullish candle before strong bearish displacement + BOS
Auto-cleanup: zones disappear when invalidated (keeps chart clean)
4) The Syndicate OB Workflow (repeatable daily) 🔁
Step 1 — Find the nearest OBs above & below price
You want two “appointment levels”:
Closest buy OB below price
Closest sell OB above price
Step 2 — Wait for price to return to the OB
No return = no trade. Gold loves fakes.
Step 3 — Use OB boundary as invalidation
Long invalidation = below buy OB
Short invalidation = above sell OB
Step 4 — Target the next opposing OB
Longs target nearest sell OB
Shorts target nearest buy OB
This is how you trade zone-to-zone, not vibes.
5) Real Example from Friday: 4466 Buy OB & 4514 Sell OB
✅ 4466 = Buy Order Block (Demand)
✅ 4514 = Sell Order Block (Supply)
Think of this as an institutional “range.” Price often reacts strongly at these zones.
📈 Sample Trade A — Long from 4466 → Target 4514
Higher timeframe plan (H1 / M30)
Identify 4466 buy OB as demand
Main target = 4514 sell OB
You only execute once price taps the zone
Execution on M10 / M5 sniper mode 🎯
When price hits 4466, drop to M10 or M5 and wait for ONE of these triggers:
✅ Trigger #1 (clean): bullish displacement candle closes away from the OB
✅ Trigger #2 (safe): price reclaims OB midpoint and prints a higher low
✅ Trigger #3 (aggressive): first tap entry at the OB (small position, strict stop)
Stop-loss: a few dollars below the OB low (zone boundary = invalidation)
Take-profit plan:
TP1: first bounce / nearby structure (partial)
TP2: 4514 sell OB (main target)
📉 Sample Trade B — Short from 4514 → Target 4466
Higher timeframe plan (H1 / M30)
Identify 4514 sell OB as supply
Main target = 4466 buy OB
Execute only after price taps 4514 and shows rejection
Execution on M10 / M5
When price hits 4514, drop to M10 or M5 and wait for:
✅ Trigger #1 (clean): bearish displacement candle closes away from the OB
✅ Trigger #2 (safe): price breaks a micro-structure low (M5 BOS down)
✅ Trigger #3 (aggressive): first touch entry at the OB with strict invalidation
Stop-loss: a few dollars above the OB high
Take-profit plan:
TP1: first drop / micro swing low (partial)
TP2: run toward 4466 buy OB (main opposing demand)
⭐ Why M5/M10 helps here:
Gold often “wicks” the OB before moving
M5 structure shift confirms the rejection without you guessing
⚠️6) The #1 Gold mistake (and the fix)
❌ Entering before price reaches the OB
✅ Fix: treat OBs like appointments, not predictions
4466 = long appointment
4514 = short appointment
You don’t trade because you “think” — you trade because price is at the level.
✅7) Quick Entry Checklist
Before clicking buy/sell:
✅ Price touched the OB
✅ You got a trigger on M5/M10
✅ You know exactly where invalidation is
✅ You have a clean target
✅ You’re in a liquid window
If you have 4/5, it’s usually a valid attempt.
🔒8) Turn this into a repeatable edge
Do this daily:
Mark nearest buy OB below + sell OB above
Only trade when price hits them
Use M5/M10 for entries, M30/H1 for targets and context
This is how you trade Gold like a sniper instead of chasing candles.
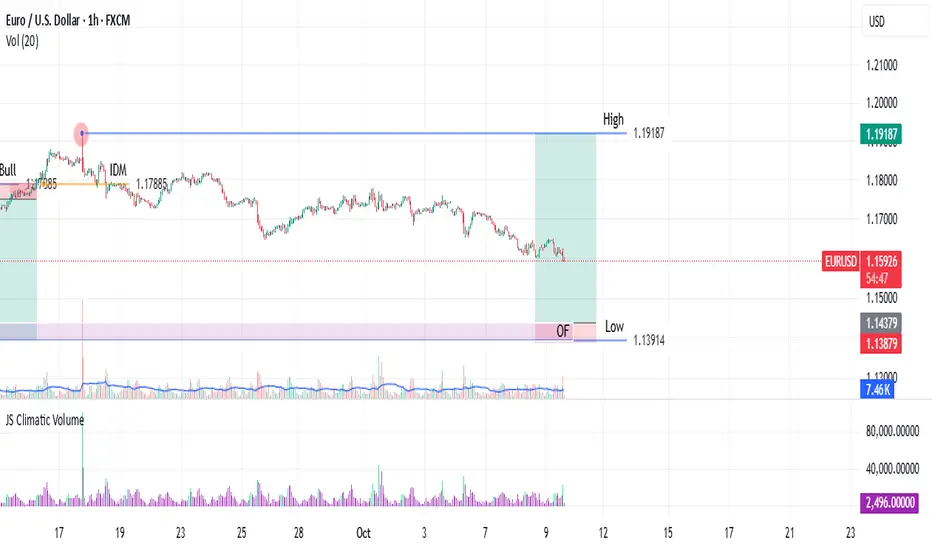
Orderblock

Testing a POI (Point of Interest) & Inducement FrameworkThis script is a visual aid for my personal testing of a systematic trading plan. It is designed to help me manually identify and mark key structural components on the chart. The core concepts I am testing are Trading Ranges, Inducement Levels, and Points of Interest (POI), specifically Order Flows and Order Blocks. (On this chart, an Order Flow)
This is a work in progress and represents my personal learning process. It is not intended as financial advice or a complete trading system.
Key Features I am Testing:
Trading Range Identification: The script helps mark the high and low of a defined trading range, which I identify based on a confirmed break of structure or change of character. In this case what is depicted is a change of character from Bearish to Bullish Sentiment on the EURUSD One-Hour Frame.
Inducement Visualization: It allows for the marking of key inducement levels. In my testing, an inducement is the pullback high (in a bearish move) or low (in a bullish move) immediately preceding the most recent significant low or high. A range is considered valid once its corresponding inducement is traded through.
Order Flow/Block Marking: The tool assists in highlighting potential OFs or OBs. These ranges or candles, located near range extremes, are the Points of Interest I test for potential entries.
My Testing Notes & Disclaimer:
This visual tool is part of my journaling process to build discipline and consistency. I use it to document my hypothesis for each trade setup. The market does not always respect these levels, and a key part of my testing is learning to distinguish between valid and invalid POIs.
My risk management rules are separate and non-negotiable. I always define my stop loss and position size before entering any test trade.
I am sharing this as a documentation of my own testing framework, not as a recommendation.
How to Find Order Block on Any Forex Pair & Gold (SMC Basics)
Order block is easier to find than you think.
I am going to reveal 2 simple price models that will help you find strong bullish and bearish order block zones on any Forex pair.
Discover how to identify OB and how to draw it properly in Smart Money Concepts SMC trading.
To effectively spot Order Block, you will need to learn basic Structure Mapping.
To find a bullish order block, you will need to learn by heart a classic bullish trend model.
According to the rules, that market is trading in a bullish trend if the price consistently updates Higher High HH and Higher Lows HL.
Such a price action confirms an uptrend .
The last higher low in that will be your Bullish Order Block.
Let me share with you a definition of a bullish order block so you could better understand its deep meaning.
Bullish order block is a significant price zone or a level where large market players (banks, institutions, hedge funds) have previously placed a high volume of buy orders, creating a strong imbalance in demand.
And what is a proof of this strong demand?
A consequent break of structure and a formation of a new higher high demonstrate a clear strength of a bullish wave that was initiated because of the activity of Smart Money.
As the market continues updating Higher Highs , remember to update Order Block. It will strictly be based on the LAST Higher Low.
Examine a price action on NZDUSD forex pair on a daily time frame.
The trend is bullish and our Order Block will be based on the last Higher Low.
To properly draw Order Block zone, its low should be based on the lowest low of a Higher Low. Its high should be based on the lowest daily candle close above a low of a Higher Low.
We will assume that huge volumes of buying orders will accumulate within that zone.
That area will provide a safe zone for us to buy the market from.
Alternatively, its violation will signify an important shift in a market sentiment.
To find a bearish order block, you will need to understand a classic bearish trend model.
According to the rules, that market is trading in a bearish trend if the price consistently updates Lower Lows LL and Lower Highs LH.
Such a price action confirms a downtrend .
The last lower high in that will be your Bearish Order Block.
And here is what exactly is a bearish order block.
Bearish order block is a significant price zone or a level where large market players - Smart Money have previously placed a high volume of sell orders, creating a strong imbalance in supply.
And what is a proof of this strong supply?
A consequent break of structure and a formation of a new lower low demonstrate a clear strength of a bearish wave that was initiated because of the activity of Smart Money.
As the market continues updating Lower Lows, remember to update Order Block. It will strictly be based on the LAST Lower High.
Please, check a price action on NZDCHF forex pair.
The market is trading in a downtrend.
Our bearish order block will be based on the last lower high .
The high of this zone will be the highest high of the last lower high.
Its low will be the highest daily candle close below the last lower high.
That zone will be a critical resistance.
Large selling volumes will be distributed within.
Once that area is tested, we can sell the market from that.
Alternatively, its bullish violation will signify a significant shift in the market sentiment.
Of course, these 2 models will not reveal all the order block on a price chart, BUT it will show you one of the most significant ones that you can rely on for safe entries for your trades.
Just learn a structure mapping in smart money concepts and use that you find powerful order block zones on any forex pair.
❤️Please, support my work with like, thank you!❤️
I am part of Trade Nation's Influencer program and receive a monthly fee for using their TradingView charts in my analysis.
What is ICT Order Block and How to Trade it
👉🏻 ICT order block is basically an area on the price chart which indicates the huge institutional orders and signals the strong reversal or continuation of price.
You can use the order block as a confirmation of your trade entry or for the reversal of price.
In this article, we will teach you all about order block trading strategy from definition to its identification and to use along with examples.
You can jump to the part of this guide, you are most interested in or you can continue reading the whole article :
Table of Contents 👇🏻
1 : What is ICT Order Block?
2 : Types of Order Block
3 : Bullish Order Block
4 : Bearish Order Block
5 : Bullish Order Block Trading Strategy
6 : Bearish Order Block Trading Strategy
7 : Final Thoughts
What is ICT Order Block? ⚡️
ICT Order block is the area in the price chart, where a large number of orders are executed by institutional traders in the market and market shows sudden strong move from that area.
Retail traders follow institutional foot prints, so they wait for these order block zones to buy or sell in the market & make profit along with big institutions like banks.
You can see the example of order blocks in the picture given below :
Types of Order Block
As you know market has two price moves bullish & bearish. So on the basis of price moves, order block is divided into two types.
(I) Bullish Order Block
(II) Bearish Order Block
Bullish Order Block
A bullish order block is the last bearish candle before the bullish impulse (strong sudden) move, it typically consist of two candles, with the first candlestick being a bearish and the second candlestick being a bullish one.
How to Identify a Bullish Order Block? ⚡️
To identify a valid bullish order block you need to check following things.
(I) Second candle being a bullish candle, should grab the low of previous bearish candle. Price should go below the low of previous bearish candle.
(II) Second candle being a Bullish candle should close above the high of previous bearish candle.
(III) Imbalance in lower time frame in the order block zone.
(IV) Structure shift in lower timeframe.
To sum it up we can say, second candle should completely engulf the first candle – body to body & wick to wick.
You can see the example of bullish order block in the picture below :
Bearish Order Block ⚡️
A bearish order block is the last bullish candle before the bearish impulse move, it typically consist of two candles, with the first candlestick being a bullish and the second candlestick being a bearish one.
How to Identify a Bearish Order Block? ⚡️
To identify a valid bearish order block you need to check following things.
(I) Second candle being a bearish candle, should grab the high of previous bullish candle. Price should go above the high of previous bearish candle.
(II) Second candle being a bearish candle should close below the low of previous bullish candle.
(III) Imbalance in lower timeframe in the order block zone.
(IV) ICT Market Structure Shift in lower timeframe.
To sum it up we can say second candle should completely engulf the first candle – body to body & wick to wick.
You can see the example of bearish order block in the picture below :
Bullish Order Block Trading Strategy ⚡️
In bullish order block trading strategy you would look for shift of price delivery from bearish to bullish and then execute a buy trade utilizing a bullish order block.
When the trend is bearish and it approaches a demand zone where you would seek reversal of price and at that area price shifts its structure to the buy-side.
Then you will be looking for the order block at the bottom of the impulse move which changed market trend.
When you find the bullish order block in that move, it means it was a move involving institutions so you need to wait for the price to test the bullish order block zone to execute a buy trade.
When price retraces back and tests the bullish order block zone you can execute a buy trade as shown in the picture below :
When tradin bullish Order block trading strategy your stop loss will be 10/20 pips below the low of order block zone.
Bearish Order Block Trading Strategy ⚡️
In bearish order block trading strategy you would be looking for the shift of trend from bullish to bearish and then execute a sell trade utilizing a bearish order block.
When market trend is bullish and it approaches a supply zone where you seek reversal of price and at that area price shifts its structure to the sell-side.
Then you would look for the order block at the bottom of the impulse move which changed price trend.
When you find a bearish order block in that move it means it was a move involving institutions so you need to wait for the price to test the bearish order block zone to execute a sell trade.
When price retrace back and tests the bearish order block zone you can execute a sell trade.
A real market example of bearish order block trading strategy is shown below in the picture.
Final Thoughts⚡️
When trading using bearish Order block trading strategy our stop loss will be 10/20 pips above the high of order block zone.
Order blocks can also be found in a trend after a pull back and these order blocks confirm the strength of trend. We can use these order blocks to trade the trend or to add new positions in the trend.
Like in a bearish trend after a bullish pullback a bearish order block may form, which confirms the strength of bearish trend and we can add a new sell order to enjoy the bearish trend.
Likewise in a bullish trend after a bearish pullback a bullish Order block may form which confirms the strength of bullish trend and we can add a new buy order to enjoy the bullish trend ❤️ .

Best Technical Indicator to Identify Order Block & Imbalance
Your ability to correctly identify Order Blocks on a price chart is essential for profitable trading Smart Money Concept.
In this article, I will show you a great technical indicator that will help you to spot Order Blocks on any financial market.
First, in brief, let me give you my definition of Order Block.
The problem is that in SMC trading there is no one single definition of that and many traders interpret it differently.
To me, an Order Block is a specific zone on a chart from where a strong price movement initiates and where a significant imbalance between supply and demand occurs .
This imbalance should strictly originate from a liquidity zone.
That definition implies that in order to identify an Order Block zone, one should learn to properly identify the imbalance and liquidity zones.
And again, there is no precise definition of an imbalance on a price chart. To me, a bullish imbalance is a formation of a bullish engulfing candle - the one that engulfs a range of previous bearish candle with its body.
Above is the example of a valid Order Block on GBPUSD.
A bearish imbalance is a formation of a bearish engulfing candle - the one that engulfs a range of a previous bullish candle with its body.
Above, you can see the example of an Order Block on USDCAD, based on a bearish imbalance.
There is one technical indicator that will help you to recognize such Order Blocks. It is called " All Candlestick Patterns" on TradingView.
Open settings of the indicator and make it show ONLY Engulfing Candles and choose "No Detection" in "Detect Trends Based on".
After that, hide the indicator and first, Identify the liquidity zones on a chart and wait for a test of one of these zones.
Here is a test of a liquidity zone on NZDUSD on an hourly time frame.
After that, turn on the indicator, and wait for its signal.
You can see that after some time, the price formed a bullish imbalance with a bullish engulfing candle. The indicator highlight that candle.
The Order Block zone will be based on the lowest low of 2 candles and the high of a bearish candle preceding the imbalance.
One more example. We see a test of a significant liquidity zone on EURAUD on a 4H time frame.
We turn on the indicator and look for a signal.
A bearish imbalance is formed and the indicator immediately notifies us.
An Order Block Zone in that case will be the area based on the highest high of 2 candles and the low of a bullish candle preceding the imbalance .
Of course, there will be the rare cases when the indicator will miss the imbalances. But while you are learning to recognize Order Blocks, this indicator will definitely help you a lot!
Thank you for reading!
❤️Please, support my work with like, thank you!❤️
I am part of Trade Nation's Influencer program and receive a monthly fee for using their TradingView charts in my analysis.

FAIR VALUE GAP OR ORDER BLOCK ENTRYA fair value gap (FVG) and an order block entry are concepts used in technical analysis within financial markets to identify potential trading opportunities.
### Fair Value Gap (FVG)
A fair value gap refers to a price range on a chart where there is an imbalance between buyers and sellers, often resulting in a quick movement through this area without much trading activity. This gap can create a zone of interest where price may return to fill the gap, presenting a potential trading opportunity. Traders look for these gaps to predict price movements, expecting that the market will revisit these areas to achieve a fair value.
### Order Block Entry
An order block is a consolidation area where significant buying or selling has taken place, often by institutional traders. These blocks are typically identified by a cluster of orders that create a strong support or resistance level. When price returns to this level, it often reacts due to the presence of unfilled orders, providing a strategic entry point for traders. Order blocks are used to predict where the price might reverse or continue its trend, offering a high-probability entry signal based on historical price action.
Both concepts are used by traders to make informed decisions based on the past behavior of price and volume, aiming to identify areas where significant trading activity is likely to influence future price movements.

ORDER BLOCK CONFIRMATION ENTRY PART 2Sure! Here's another description of order block confirmation with a focus on practical application and detailed examples:
### Understanding Order Block Confirmation:
Order block confirmation is a technique used by traders to identify and validate significant price levels where large orders from institutional traders have been placed. These levels often act as strong support or resistance zones. Confirming an order block helps traders make informed decisions about entry and exit points in the market.
### Detailed Steps for Order Block Confirmation:
1. **Identify Potential Order Blocks:**
- **Bullish Order Block:** Look for a downtrend that ends with a strong bullish reversal, marked by one or more large bullish candlesticks.
- **Bearish Order Block:** Look for an uptrend that ends with a strong bearish reversal, identified by one or more large bearish candlesticks.
2. **Analyze Market Structure:**
- **Trend Context:** Determine whether the market is in an uptrend, downtrend, or sideways movement. This context helps in predicting the likelihood of the order block holding.
- **Key Levels:** Note the order block's alignment with significant support or resistance levels.
3. **Volume Analysis:**
- High volume during the formation of the order block is a strong indicator of institutional activity. Look for volume spikes that coincide with the large candlesticks forming the order block.
4. **Price Action Confirmation:**
- **Engulfing Patterns:** A bullish engulfing pattern at a potential bullish order block or a bearish engulfing pattern at a potential bearish order block can confirm the level.
- **Pin Bars and Rejection Candlesticks:** Candlesticks with long wicks (e.g., pin bars, hammers, shooting stars) at the order block level indicate strong rejection and confirm the presence of significant buying or selling interest.
- **Break and Retest:** Confirmation is stronger if the price breaks through the order block level and then retests it as support (for bullish order blocks) or resistance (for bearish order blocks).
5. **Indicator Confirmation:**
- **RSI (Relative Strength Index):** If the RSI shows overbought conditions at a bearish order block or oversold conditions at a bullish order block, it provides additional confirmation.
- **Moving Averages:** The interaction of price with moving averages (e.g., 50 EMA, 200 EMA) near the order block level can confirm its validity. A bounce off or crossover can be significant.
6. **Confluence of Factors:**
- Multiple confirmations such as Fibonacci retracement levels, pivot points, and trend lines aligning with the order block increase its reliability.
### Practical Examples:
1. **Bullish Order Block Confirmation:**
- Suppose the price of a stock is in a downtrend and reaches a level where it forms a large bullish candlestick, followed by increased volume.
- The RSI indicates oversold conditions.
- The price breaks above the identified order block and later retests this level, forming a bullish pin bar.
- This confluence of signals confirms the bullish order block, suggesting a potential entry point for a long position.
2. **Bearish Order Block Confirmation:**
- Consider a forex pair in an uptrend that hits a resistance level, forming a large bearish candlestick with a volume spike.
- The RSI shows overbought conditions.
- The price breaks below the identified order block and retests it, forming a bearish engulfing pattern.
- This setup confirms the bearish order block, indicating a potential entry point for a short position.
### Trade Execution and Management:
1. **Entry:** Based on the confirmed order block, place a buy order at the bullish order block or a sell order at the bearish order block.
2. **Stop-Loss:** Set stop-loss orders just below the bullish order block or above the bearish order block to manage risk.
3. **Take Profit:** Identify potential take-profit levels based on historical price action, nearby support/resistance levels, or using risk-reward ratios.
By following these detailed steps and examples, traders can effectively use order block confirmation to enhance their trading strategies and improve their chances of successful trades.

"The Bodies Tell The Story.. The Wicks Do The Damage" - ICTIn this video I'm going to go through one of ICT's most famous sayings, which is "The bodies tell the story, and the wicks do the damage". If haven't taken the time to understand what he means, then you are seriously putting yourself at a disadvantage if you are using his concepts. This is one of the most crucial and useful pieces of the ICT puzzle. You often hear him say that the wicks are painting outside of the lines, which he sees as permissable when he is trading his PD Arrays. So without further ado, I'll try my best to provide some insight.
For illustrative purposes I'll use his Market Maker Sell Model. Just to note that this is not a video teaching about his market maker models, so the focus will not be on that or his other concepts. If you don't understand a certain term or concept, please check out ICT's YouTube Channel or the countless other resources online. This video will be predominantly shedding some light on candle bodies and wicks.
I urge you to go into your own charts and do your own study. This will truly be something eye opening if it is the first time you've actually decided to take notice.
- R2F

ES Morning Shorts From Last Nights IdeaGood Afternoon everyone,
I will show in depth order entries in this post, read the updates to see.
This idea was formed last night around 10PM NY Time. I originally was hoping to trade up into the most recent Order Block (green path arrow) during the London session and end at the Terminus -4 around 8:00AM NY time. I then would've liked to see accumulations followed by a Turtle Soup or sweep of that low at the Terminus -4 during market open. I wanted to take countertrend longs in that area into the Order Block resting above the Liquidity Void, this move is denoted by the orange path arrow.
However we ended up going straight to Terminus -4 during London and we rallied above Asia accumulation into the Bearish Order Block sitting right above (green path arrow). We took shorts from this area and we were looking to target the Sellside Liquidity below to complete our MMSM (Market Maker Sell Model) on the 15M chart. We were able able to bank 2.1% off the move just by taking profits at the short term low 4507.5 and holding a few more contracts to a slightly lower price once we noticed price wasn't wanting to break the low at the Terminus -4 just yet. The Sellside Liquidity is still a viable target, we have just been choppy since right after open so taking profits is worth the time spent waiting for price.
Hopefully this was more insightful on how to form an idea for the next trading day. I will commit to making more informational posts like this. Please read the updates for a 5M look at the entries and a reference to the MMSM.

A loss for me a lesson for you- Trading a bearish FVGReview this first to see the fair value gap:
(1)Trades inside the -FVG
(2) Rejects -FVG(MT)
(3) Holds -FVG(L)
Note: This is a high probability sign for moves higher, price trades inside the 4H-FVG. Once price is inside, the price trades to the 4H-FVG(MT) and trades back down to the 4H-FVG(L) and price holds for a continuation inside.
(4) Prices trades through -FVG(MT)
(5) Trades and rejects the -FVG(H) and -OB
Note: This is where, and only where I should have entered for the sells that I attempted near the midpoint. We had already traded pass 4H-FVG(MT). After the failed entry, you should wait for price to reach the 4H-FVG(H) and in this case the -OB as well.

ICT Power of 3 & Afternoon Session 2022 Mentorship ModelHere is a good example of power of 3 and how to trade the afternoon model according to ICT. Of course this is not to the tee, as I would not have traded the afternoon session until 1:30 if I followed it exactly. Nonetheless, nice profits and I hope this was helpful!

E-Book Gift + TRADABLE VS NON-TRADABLE ORDER BLOCKSABBREVIATIONS & DEFINATIONS
ORDER BLOCK
OB is a Down/Up Candle at/near Support or Resistance before the move Up/Down, respectively.
Down Candle is a Bearish Candle
Up Candle is a Bullish Candle
Bullish Order Block is Down candle at/near Support level, before the move up
Bearish Order Block is Up Candle at/near the Resistance level, before the move down
IMBALANCE
This is Insufficient Trading in the market. Sometimes called Liquidity Void .
When there is insufficient trading in the market, the price often comes back to fill out the orders
that were left.
Imbalance is created by 2-3 or more Extended Range Candles
ERC candle often closes at 80% of the candle range
Assumptions;
When the Market Maker want to move price up at a certain level, it is assumed that, there should
be enough sell orders to pair their buy orders with (this is how they make profit).
So, when the MM moves away from a given level with strength and magnitude, leaving behind a LV
(IMB), we can use this to assume that sell orders that were available at that level were not enough to pair
with their Buy Orders.
Therefore, the MM will, often, come back at this level for mitigation
MITIGATION
Mitigation means; to reduce risk.
When the MM moves price away from a level with strength and magnitude, say they are buying; it is
assumed that this is used to entice retail traders to join the move.
And because most retail traders are price chasers, they join the ride with their Stop Loses set. This is
the reason (assumed) that the MM will come back to clear retail traders SL. When their (Retail Traders)
SL are hit, they are knocked out of the move, hence MM mitigating their risk (THEY WILL RESUME
THE INITIAL TREND HENCE MOVING ALONE).
you can download that E-book from below URL

Everything you need to know about order block 5 RULES | TUTORIALToday we're going to talk about orderblocks. Very simply, an orderblock is the support and resistance of big players. It is stronger and more important than what you draw on a chart expecting a price reaction by classical technical analysis.
This works absolutely everywhere in cryptocurrency, forex, and the stock market.
I have deduced for myself 5 rules of confirmation, and now we will go over each of them. Let's start with schemes and end with an example on a chart.
Orderblock is a candlestick that shows purchases or sales of large capital. When a bullish orderblock is formed, an accumulation or reaccumulation takes place in order to further markup the asset. When a bearish orderblock is formed, a short position is accumulated or reaccumulated. With the purpose of further asset markdown.
The first rule is liquidity.
We have a zone from which the price gets a reaction and goes in the opposite direction. This forms a support zone for those who trade classic technical analysis. Traders place their orders in this zone, which is what the big capital hunts for.
Accordingly, this level is pierced by the flow of orders, which activates these stops.
This is how liquidity is removed from the area.
The last bearish full-body candle will be our orderblock. It is important that it updates past lows. An analogy would be the wicks of candle, which removes liquidity from past lows. The wick of a candle in this case is an orderblock on a lower TF.
The second rule is confirmation
After withdrawal of liquidity we expect confirmation of this orderblock - that is absorption and movement in the opposite direction.
The confirmation should be impulsive. That is, we should not see how the price is stuck in this confirmation. It concerns the absorption (updating) of the order block. It is possible inside the candle (orderblock). But personally, I try to take the "book variant".
Local consolidations can indicate the weakness of the movement. It doesn't mean that the orderblock will not work out in the end, but the probability decreases.
The third rule is structure breaking (bos)
One of the key points is the breakdown of structure that this orderblock provides. This is how we can understand the mood of the market and the intentions of big capital.
In this example, we can highlight the main structure with the yellow line. It is after updating a significant structural element that we can be almost sure of the truth of our orderblock.
If we don't see a break in structure, then this movement may just be a correction within a downtrend. So keep an eye on this one.
The fourth rule is the law of force (momentum)
After confirming our orderblock, we can see a prolonged correction in the OTE (make a Fibo). That is, we should see an impulse and after it a slow sluggish movement downwards, which will also form liquidity behind each local high. This is not a necessary factor, but if it is present, the probability of a trend reversal will increase many times over.
The fifth rule - the volume and spread of candles
The candlesticks should be full-bodied with increased volumes. It will be important to monitor the "distance" that the price has done. All these factors will also indicate the veracity of the movement. This recommendation concerns more about swing trading, moments when the price is in a trend for a long time without a serious correction and test of the formed order block.
Examples on the chart
On the daily TF I marked a Sell to Buy move. I marked it this way because there were no warrant blocks to satisfy me on the higher timeframe. This area will act as a zone of interest.
The structure on the Hourly TF looks like this. Consequently, we expect a confirmation of our orderblock through a break of the structure. The price entered the sell to buy zone and tested the order block, which was formed from the wick of the candle.
We saw an impulse exit and watch the price go up sluggishly, forming liquidity behind each low. Therefore, we expect an orderblock test.
I recommend backtesting on chart history to better understand how order block works. Thank you for your attention, I hope it was useful

What is OrderBlock ⁉️ ‼️ Order Blocks are candles where Market Makers (Banks) have placed their positions, generally, the market returns to those candles and they are never violated.
There're 2 types of Order Blocks:
1. The Bullish Order Block is the last bearish candle before the bullish movement, that Break The Market Structure Higher. Represents a high possibility of holding the price, when the price returns to it.
2. The Bearish Order Block is the last bullish candle before the bearish movement, that Break The Market Structure Lower. Represents a high possibility of holding the price, when the price returns to it.

Smart Money Concepts versus Long Money ConceptsFor the past 2 years I'd say I endowed myself in the study of a few technical approaches, and I have to say the most flawed is using smart money concept annotations to build a trade bias, as each annotation from a BOS, to order block can be subjective on every time frame.
I feel the overlying goal for any trader is to first align themself with the trend.
As you see on this chart, I have a refined, untapped order block on this 15 minute chart succeeding a bleed off in the previous session followed by what most traders perceive as a dead range but it isn't. I've come to notice in these ranges, price tends to scatter interest using a series of corrections
on lower timeframes. Flats, Running Flats, and Diagonals are scattering price movements, but nowadays they call them complex pullbacks. Shaking my head. It's complex because the language you are trying to codify the price movements with does not align with the environment.
Now order blocks in line with the trend are high probability, but is usually succeeding a correction.
I think ever since liquidity became a focal point of most traders as now it is a buzzword, most traders only look for nuances such as CHOCH, which is simply an ABC, with order flow being extending and clear intentions made in the C leg.
I mean it sounds cool, but its all buzzwords, and have no relation to the true nature of pricing.
Price does not just move, reverse, or stop. It fluctuates in what may seem as unpredictive nature but in all reality its all mathematical and involves keeping a study of price action and the models you build using the same predictive format. Of course with the addition of granularity into the lower timeframes,
trying to trade order blocks may seem incomprehensible, because at most times it is.
Understanding Price cannot be done with SMC alone, and I feel most traders who do employ the idea of SMC are looking for marketability factors for their trading and more or less uses ICT concepts to overlay their own trading understanding,
ICT even said himself that Order blocks are just visual representations. Visual representations of price activity at specific point in time. But what did the order block accomplish? Why are you positioned within the order block itself?
This is why I don't trade SMC and removed it from my trading understanding and rather I u
It doesn't build enough context.
Now lets add context to this bearish order block at (C)5 on the 15M.
We can make assumption that the strong order flow in the sell to buy includes the 3rd wave extension as price made a sub minor correction in the 47 percent area of the sub impulse (C)5, which is the (A) wave.
At the print of the A wave, the bullish sub impulse was so weak, it didn't shift any order flow on the 4H chart, but in contrast, the correction back into order flow gave print to wider range bear candles in comparison to the previous bullish order flow.
Although corrective, price made clear objective to extend price downward over time with a definable 3rd wave extension and impulse back into the untapped supply to demand flip which is another SMC concept. This if course brought in many traders of this concept, and with it trade stops just below the order block which was eventually ran as you can see.
Now for everything else. Ill just update the idea if requested. Im tired of typing at this point. Thank you though and feel free to comment.

⁉️ What is OrderBlock? ‼️ Order Blocks are candles where Market Makers (Banks) have placed their positions, generally, the market returns to those candles and they are never violated.
There're 2 types of Order Blocks:
1. The Bullish Order Block is the last bearish candle before the bullish movement, that Break The Market Structure Higher. Represents a high possibility of holding the price, when the price returns to it.
2. The Bearish Order Block is the last bullish candle before the bearish movement, that Break The Market Structure Lower. Represents a high possibility of holding the price, when the price returns to it.

How to use the fibonacci retracement tool for confirmationsWatch this clip to learn the 3 types of fibs that I use to refine POIs, create extra confirmation tools along with locating Premium and Discount areas. ENJOY!

Different Perspectives for Managing RiskWatch this clip to learn different ways you can look at when it comes to managing your risk and risk management in general.

EURUSD.... SEE WHY MANY PEOPLE LOST THIS TRADE... AVOID ITHello Traders,
So today I am doing a trade recap on a trade I lost due to lack of detail. Note, in trading, after knowing how trading works, every thing comes down to the level of attention/detail you give to your chart.
Detail, detail, detail... never forget.
I have labelled the chart accordingly so your understanding can be seamless. But if you still need clarity let me know.
I use my weekend to analyse why my trade won or lost. And this is an approach to trading that people should undertake. This should come after journaling your trade.
The thing is, you will make mistakes, you will not see everything (detail) but continue. Reduce the number of pairs you trade, reduce the indicators, reduce the trendlines and every other thing... Your chart should be clear and easy on the eyes. I only look at 10 markets (the 7 majors and AUDNZD, CADCHF & EURGBP). I add the 3 crosses only because I want to have alternative for all the currencies excluding JPY. I don't use indicators (not saying it is bad but reduce it), I don't use trendline (because price is moves horizontally - unpopular opinion).
When you have just a few pairs, you are able to understand the moves better and you can free your brain from analysing so many pairs. Just imagine using indicators, lines upon lines, and the market changes form... now you need to start all over again your analysis on all your multiple markets, looking at so many things. Trust me, you are bound to miss the obvious details not to talk of the hidden ones and its a lot of work. I am sure you must have experienced it.
I am still very bullish on EURUSD and right now, I am not looking for an entry, I am waiting for a break of the 4H high then I will look for an entry which I will share on my page.
If you would like to see it, all you need to do is click on follow.
I will also link my previous analysis on EURUSD, AUDNZD, USDJPY
Stay tuned for more.
BR.
David

[Candlestick Patterns] Just need to know these three!#Candlestick #CandlePattern #Tocademy #Tutorial
Hello traders from all over the world, this is Tommy =)
I was unexpectedly surprised by many of you who liked and supported my last post about the basic concept of TA(Technical Analysis). Today I prepared a brief lecture about the Candlestick Pattern, one of the most fundamental phenomenon and behaviors that traders must be well-informed. In fact, we should be very familiar with these textbook contents and interpret it in a glimpse on the technical chart unconsciously. Just like we don't pay direct attention about each breathes when breathing, like we don't care each and all of the alphabets when we speak, or like we don’t perceive location of each keyboards every moment as we type, this very technique should be performed automatically and quickly by observing dominant formations of candlestick bars.
As a matter of fact, comprehending market trends and price actions only by referring to the candlesticks is yet too spurious. It should be used in such a way to weight on certain scenarios in a macroscopic view, rather than deriving precise and specific PRZ(Potential Reversal Zone)s and distinguish the accurate market trend. It’s never like ‘The price must go up because this pattern just appeared’. Furthermore, I strongly believe that the reliability of the candlestick pattern strategy is declining especially in recent financial market, where we encounter countless non-traditional and abnormal situations that were not very common in the past. Hence among the existing ‘Textbook’ candlestick pattern strategies that can easily be found on Google, there are particular patterns that are still very reliable on current market and there are ones that are not as reliable as it used to be. So here, I will organize everything very clearly for you guys.
The technical chart is well known as sort of a map tracing the mob-psychology of all the stakeholders in the market. Investors’ sentiments such as FUD(Fear, Uncertainty, and Doubt) and FOMO(Fear of Missing Out) that often cause panic buy/sell are visualized as data. Those with a clear understanding of the fundamental nature of how candlesticks are being formed, don’t even need to memorize these patterns one by one. As I emphasized at my previous post, candlesticks should be interpreted as a whole structure, unlike the line chart expressed in one-dimensional. Candlesticks are newly formed in each time interval and we can choose the timeframe for the chart that we are about to analyze. For instance, each candlestick in a daily chart is formed every day while each candlestick in a 5minute chart is formed every 5 minutes. Higher the timeframe of the chart is, longer-term the scope within the chart is. It is important as a TA analyst to start from macro-perspective with higher timeframe first, then go deeper to lower timeframe and find short-term factors.
There are four independent prices composing a candlestick: open, high, low and close price. Open price indicates the starting point while close price indicates the ending point of a candlestick. Just like the wording, high/low prices are formed at the highest/lowest price during the time period of candlestick being formed. A bullish candlestick is when the closing price is above the opening price (i.e., when the price rises), while a bearish candle is when the closing price is below the opening price (i.e., when the price is falling), and the two are expressed in different colors (green & red or red & blue). The thick part between the opening and closing price is called the ‘Body’, and the thin part is called the ‘Tail’ (Wick or Shadow).
Typically, the length of the body implies the strength of an ongoing trend. We learned from the textbook that the candlesticks with a longer body means stronger trend and those with shorter tails mean clearer trend. Back in the days, there was time when we could detect if whales are involved and deduct impulsiveness of ongoing trend when distinctly long bodied candlesticks with relatively high trading volumes take places. I am afraid to tell you that it is better to erase that memory. First of all, it is too obvious and cliché to announce that the long candlesticks with high volumes mean strong market trend. This criterion itself is quite vague and not 100% reliable to identify future trends or find insightful signals. Moreover, in recent days (especially in Crypto), whales like to deceive retail traders with a strong faith of trading volumes and since the future markets are becoming bigger, giving too much weight on trading volume paired to each candlestick is not as effective as it was when textbook used to work very well. I am not saying textbook is wrong. It just needs slight updates since the market we are dealing with keeps changing over time.
In TA world, closing price of a candlestick carries a great meaning and thus closing prices at higher timeframes should very well be monitored to become a successful trader. Sometimes whales even battle aggressively right before a major closing time often causing a weird ‘scam’ moves with a high volume. As shown below, we usually find the price and time when certain TA variables (such as top/bottom of trendline, channels, pivot levels, and other indicators) are broken, meaning if the price has penetrated those variables successfully, in order to find breakout entries, stoplosses, and target prices, etc. This whole concept of breaking above or below is quite vague, subjective, and relative idea. So, what we traders refer to as a reliable criterion is confirming whether the candle closed above and below the factors. For instance, let’s say that we are seeking and waiting for the breakout of the downward trendline. Well sometimes it’s not as easy as expected to precisely spot and determine whether the price has successfully pierced through the trendline. There are times when price breaks the trendline, but ends up coming back below leading close price of the candlestick to be formed below the trendline like the case 2 below. In this very case, it’s difficult to determine whether the breakout happened successfully or not. Nevertheless, like case 3, when both closing and high prices are formed above the trendline, we can clearly confirm and weight more on the breakout scenario, expecting more bullish rally.
Okay let's get to the point. In recent financial trading market, it's enough to know just these three.
1. Engulfing
2. Doji
3. Long Tailed Candlestick
As mentioned above, there’s nothing hard if you understand the essential concepts and principles of the above patterns and phenomena. The engulfing candlestick is a phenomenon in which the body of the previous candle is consumed by the body of the next candle, that is, a larger body than the previous one comes out. In other words, if a new bullish candle closes higher than the previous open price or if a new bearish candle closes lower than the previous open price, we say ‘the new candlestick engulfed the previous one’. If we look closely, this pattern implies the circumstance where the new candle completely overwhelms the trend of the previous candle and reverses it into a new trend despite closing the price from above or below. However, the appearance of an engulfing candle does not mean that the trend is unconditionally reversed. It is often the case that engulfing candles take place consecutively, with the second candle taking over the body of the first candle, the third’s taking over the second’s, the fourth’s taking over the third’s and so on. As the price fluctuates up and down, it creates a Widening or Broadening pattern also known as expanding sort of shapes, making it difficult for traders to figure out the current trend. In this circumstance, the entry prices, stop loss prices, target prices, or average prices of many participants in the market tend to be located relatively nearby. This price range or region is called a HVP(High Volume Profile or Peak) or an Orderblock and I will cover details about this concept later on another post. Anyway, there are numerous methods to derive Orderblock and one of them is to spot bodies of the consecutive engulfing candlesticks.
The tail(wick) of a candlestick can be interpreted as a sign of the fierce battle between the bulls are bears. Longer tail signifies bigger collision between buying and selling forces. The longer the upper tail, the more the bulls trying to raise the price up but the bears rejecting them eventually sellers ending up being dominant and vice versa for the longer the lower tail. Generally, when the long upper/lower tails are formed at a relative higher/lower part of the wave structure or at a distinctive pullback as a PRZ this can be a possible signal of trend reversal. Due to my personal trading experience, it doesn't matter much in recent TA market whether the long-tailed candlestick is a bullish or bearish. In other words, regardless of the color of Hammer or Shooting star (which are both long-tailed candlestick pattern), it’s better to check if the next following candlesticks are being formed opposite direction of the tail. Personally, I don't think the Inverted Hammer and Hanging Man are not as necessary as it used to be in the old days.
When the length of the candlestick’s body is relatively short meaning if the open and close prices are very close, forming a cross like shape, it’s called a Doji. Since Doji has a short body, the upper and lower tails tend to come out longer and thus can be considered as evidence of a tense confrontation between the bulls and bears that eventually ends up reaching a balance. Similar to the long-tailed candlestick, Doji is also known as a sign of a PRZ depending on the next appearing candlesticks. When Dojis are observed after swing high or low, it can be a possible indicator that the on-going trend is overheated and you might want to anticipate some pullbacks. However, it is too risky to directly assume that the top or bottom is near just because of Doji. Especially in the market these days, Dojis also appear frequently in sideways and sometimes confuses traders searching for a clear trend.
As emphasized above, as with other technical techniques, theories, and indicators, always remember to weight more to the emergence of patterns in higher timeframes and longer-term perspectives. The higher timeframe people globally refer to, the more the reliability the TA will be. Just think about it for a second. Which timeframe do you think that people consider more significantly about the closing price, a 5 minutes chart or a daily chart? I would obviously say that the price signals from the daily cart is relatively more representative and reflect longer-term than those of the 5 minutes chart. Keep in mind is that you also need to understand market trends from a macro perspective before approaching towards short-term perspective. It is always recommended to recognize long-term trends or situations in advance from the candlestick of a higher timeframe, and then look at more detailed and microscopic elements step by step.
All right. I will wrap up now. Thanks for reading my post.
Your subscriptions, likes, and comments are a huge inspiration for me to write more posts!

THE ICT BREAKER!hello, so you want a model that will get you profits? LOOK NO FURTHER!!!!
this is the ICT BREAKER, this mode (and other confluences) is ALL, YOU, NEED.
if you confluence the BREAKER with...
- BMS
- OTE
- PREM /DISC RANGE
- INTERNAL LIQUIDITY
WHAT. MORE. COULD. YOU. WANT.
what is labelled, as the purple box, THAT IS YOUR BREAKER BLOCK, YOU TRADE IN HERE WITH THE RIGHT FRAMEWORK AND CONFLUENCES.

ICT IMBALANCE / FVG / LIQUIDITY VOIDLiquidity void, Fair Value Gap, Imbalance... These terms are interchangeable.
As a Charter Member ill tell you what I've shown here, is a basic depiction, as I got asked a question on what is an imbalance?
An imbalance, is an imbalance in price, where price has NOT efficiently delivered orders in the market, price will like to revisit these areas, of imbalance, as seen here. The diagram on the left depicts the ideal model of what an imbalance is, the chart on the right is an in time example.
if you notice one of these getting filled, at a place where you are bearish/bullish... well.... there is your trade!

Chart Analysis is not a gambling! Reason why TA is greatHello traders. This is Tommy.
Today, I prepared the most basic and at the same time essential materials that every trader should know. Trading is literally the act of exchanging or trading something with a certain value. If we look at the history, we humans have always traded something within the social community from the Neolithic Age to develop into a better civilization or for individual survival when we have enough food or assets. When the surplus accumulation and self-sufficiency economy due to food production was formed, even before the concept of currency or money, buying and selling (trading) was always with us.
But when we trade, it is not a reasonable thing to do if we lose money when you buy or sell something, right? We humans have always traded at a value or price that is commensurate with supply and demand, within this immutable fence. And we, who are full of greed, have been trading in such a way as to somehow benefit ourselves a little bit more. In a way, I think this is the basic idea of capitalism.
Anyway, our ancestors naturally oriented trades for profit, sometimes seeing losses and sometimes profits through these transactions. And suddenly realized. “Ah, the quantity demanded, and the quantity supplied change over time. Because of this, all objects in this world, even abstract ones, change in value over time. Oh, I can make money if I use this well?”
A culture of profit taking has naturally been formed thanks to those who possess the temperament of smart entrepreneurs. In this way, the economy and financial markets were eventually born, and several market participants came in for the sole purpose of generating profits, that is, for investment purposes. People who have properly understood the market principle of supply and demand have been trading with certain standards to make money with it. Some people can trade by the weather (buy when it's sunny, sell when it's raining), some by rolling the dice (buy when it's high, sell when it's low), and someone just by feeling. Of course, economists studied after realizing that trading on unreliable and absurd standards would eventually destroy them. And realized it. “Ah, let’s find the right standard to set the standard. From what I've seen so far, does it make money by trading based on the information about the product and the value of the product that changes every moment? Let’s dig into it properly!”
And they created a great science. Analysis through information, Fundamental Analysis (FA), analysis through charts, that is, past transaction data, and Technical Analysis (TA: Technical Analysis).
FA is an analysis method that determines whether a product's current intrinsic value is overvalued or undervalued. For example, when we want to invest in a company, that is, if we want to buy shares or stocks in that company, we must first estimate the company's growth potential and potential, right? To do this, you must make a final investment decision by referring to the company's financial indicators, good news/bad news, past asset/revenue growth rates, etc.
On the other hand, TA is a method of making investment decisions by referring to various theories and indicators with meaning in charts that intuitively show past price movements and momentum.
Of course, it would be the best to do both FA and TA, but in these days, retail traders and individual investors, like us, have time/technical limitations to receive information, analyze it, and immediately reflect it in investment. It is not enough that there are various kinds of false information to deceive the traders, and even if it is reliable information, it is highly likely to start at a loss even if it is received a little later than others. It is useful to spot large market trends in the long run, but when this information reaches the public, it is likely that it has already been priced in by institutions (Big Parties). Without huge information power or a computer that can perform FA quickly and accurately, it is difficult to survive in this market with only FA. There is a risk that is too great to carry out an investment with only one FA standard.
Therefore, to make a successful investment decision, you need to find a more precise trading position through TA, and in the end, if you are a skilled investor, you must learn TA.
The dictionary meaning of TA is known as a technique for predicting future market trends by examining a tool called a chart that digitizes the overall price volatility and momentum of a product. I'm someone who doesn't fully agree with this meaning. The term “prediction” itself is a very dangerous word. Even the most talented investors in the world cannot predict future prices unless they are gods. Technical analysis is closer to the realm of response than prediction. For this reason, our traders look at the charts and always have various possible scenarios in mind and come up with appropriate countermeasures accordingly.
With less than 10 years of trading experience, if I dared to define the meaning of the term technical analysis, I would like to say: Personally, all TAs are based on historical data, and through various theories (or methodologies) and technical indicators, first, probabilistically identify the market trend, that is, whether the price is an upward trend or a downward trend, and then determine the price action, that is, support resistance. I think it is an analysis technique that derives the sections with high probability.
Some of you may have questions like this. “No, how do you find a trend and price action interval by looking at only historical data?”
This is the reason I fell in love with market analysis. This study called technical analysis is a technique that statistically patterned and quantified the psychology of investors (greed, doubt, fear, etc.) with a lot of data from the past. Surprisingly, external variables that can affect the market, such as good news/bad news, are also reflected in this probabilistically. There have been many times when I have felt the greatness of technical analysis, and there were many times when good news/bad news came out amazingly at just the right timing in situations where there was no choice but to rise or fall referring to the chart. Of course, there are situations where Big Parties leak news to the media to take advantage of popular psychology, but even the pattern, timing, or frequency of such good news and bad news is reflected in the study of technical analysis.
Anyway, once you have probabilistically derived the market trend and price action section through TA, you need to design a trading strategy according to the situation. There are words that I keep emphasizing like nagging. Just looking at the charts doesn't mean you're good at trading. This trading strategy includes how to structure the portfolio, how to design the profit/loss ratio/range, how much seed to enter, high/low multiplier, and how to set up profit/loss response strategies.
In addition, a well-designed principled strategy is essential to prevent non-thinking trading. This principled strategy is easy to design, but incredibly difficult to follow and implement. No matter how well technical analysis and trading strategies are formulated, these principles are of no use if they are not well designed or adhered to. There are individual differences, but honestly, I don't think there is an answer to the principle strategy other than learning or mastering it through long-term practice or entrusting your own technical analysis/trading strategy to a machine/computer/algorithm. The fewer human emotions are involved, the higher the success rate, but how can you trade without emotions when your money is at stake? It's hard. One tip is to start trading with a small amount that you don't mind losing if you want to learn principle trading well. It doesn't matter if you lose it, so you'll be less empathetic that much, and you'll be able to increase a seed little by little.
We must become traders who always think of risks (losses) before rewards (returns). Please keep this word in mind. For example, in a trading setup that costs 10 million dollars if you make a profit and 10 million dollars if you lose, rather than a mindset like “Oh, I want to win 10 million dollars quickly~”, “I may lose 10 million dollars. You must trade with the mindset of “Let’s be prepared.” This will naturally match the seed to your bowl.
Then I'll wrap up for today.
Until now, this was Tommy of the Tommy Trading Team.
Your subscriptions, likes, and comments are a big help to me.
Thank you.
