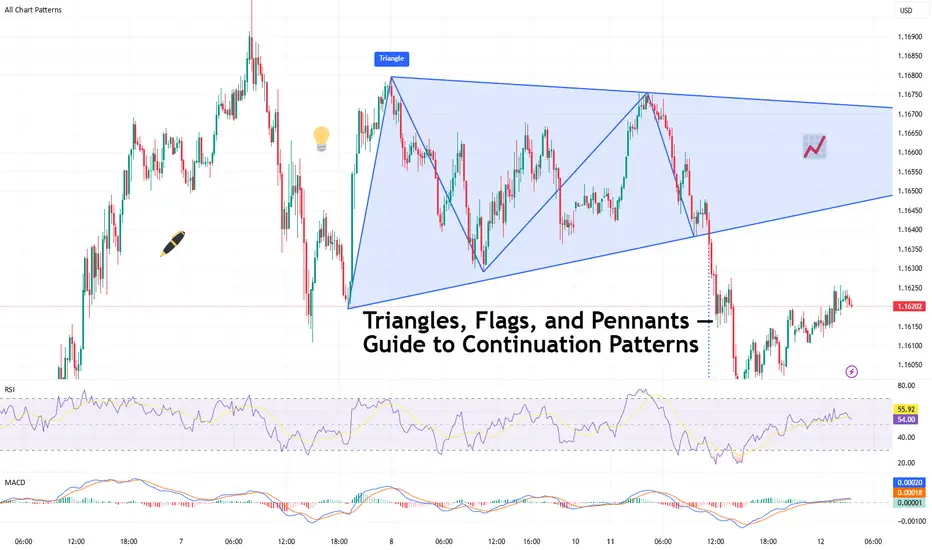
Triangles, Flags, and Pennants — Guide to Continuation PatternsChart patterns can be mysterious — until they’re not. Let’s break down the technical trio that tells you when a trend’s just taking a breather before it flexes again.
So your chart’s been pumping higher for weeks, and then… nothing. Price starts scribbling sideways. Cue panic? Maybe. But more likely, you’re staring at a continuation pattern.
Triangles, flags, and pennants are the subtle “hold my beer before I try to pull a move” signals of technical analysis. They show up when markets pause — not reverse. That pause could mean your trend is catching its breath, not dying in a ditch.
In other words: don’t close your longs just because things go quiet. Sometimes the market is just stretching before it sprints again.
⚠️ Symmetrical, Ascending, Descending
Let’s talk triangles, the Swiss Army knife of consolidation. These shapes come in three stylish varieties:
● Symmetrical triangle: Higher lows, lower highs. Traders call this the indecision pattern, but don’t get it twisted — it may just be winding up for a breakout. Wanna see how these look in practice? Dive into our community’s symmetrical triangle ideas .
● Ascending triangle: Flat top, rising bottom. Buyers are aggressive, their patience is running out. Resistance looks like it’s begging to be broken. Check the ascending triangle ideas for your viewing consideration.
● Descending triangle: Flat bottom, falling top. This one’s more bearish than your boomer uncle who knows zero about Bitcoin BITSTAMP:BTCUSD , and yes — it’s often a precursor to a breakdown. Follow the descending triangle ideas and make sure you DYOR.
Key tip : Wait for the breakout. Don’t front-run triangles unless you like volatility surprises and emotional damage.
🚩 Flags: Fast Moves, Tight Consolidations
Flags form after a sharp price move — the “flagpole” — followed by a tight, slightly sloping channel that moves against the prevailing trend. They’re short-term patterns that act like pit stops during a race.
● In a bull flag, price rallies sharply, then consolidates lower in a downward-sloping rectangle. If price breaks above the upper boundary, the uptrend is likely to resume. Jump straight into the bullish flag ideas .
● In a bear flag, price crashes, then drifts higher or sideways, forming an upward-sloping consolidation. A breakdown below the lower support hints at a continuation lower. What goes up must go down — bearish flag ideas for thought.
Flags are prized for their reliability and tight risk-to-reward setups. The breakout is typically swift, and traders often use the length of the flagpole as a projected target.
🎏 Meet the Pennant: The Flag’s Cousin
Pennants are like mini-triangles that form after a strong price move, usually in high-volume conditions. Unlike regular triangles, they’re smaller and more compressed — a tight consolidation in the shape of a tiny symmetrical triangle.
What makes a pennant different from a flag? The structure. While flags are rectangular, pennants are more pointed — a converging pattern rather than parallel lines.
Pennants are often seen in high-momentum environments, and when price breaks out of the consolidation zone, it often does so with force. Get some pennant ideas straight from our community.
🧐 How to Actually Trade These Patterns
Spotting a continuation pattern is one thing. Trading it with discipline is another.
Here’s a basic checklist:
● Identify the trend. Continuation patterns only work when there’s a clear preceding move. If the chart is a sideways mess, maybe skip it.
● Draw your levels. Use trendlines or horizontal support/resistance to outline the pattern. Keep it clean — if you’re forcing a pattern, it probably isn’t there.
● Wait for the breakout. Don’t jump in too early. Let the price confirm your bias. Breakouts are more credible with a volume spike.
● Set your stop wisely. Most traders place stops just outside the opposite side of the pattern — below the lower trendline in an uptrend, or above the upper trendline in a downtrend.
● Target projection. Many use the height of the pattern or the flagpole to estimate a target price, though market conditions should influence your approach.
🤔 So, What Could Go Wrong?
Glad you asked. Plenty.
● Fakeouts: Just because it looks like a breakout doesn’t mean it’s real. Wait for confirmation — volume, a close outside the pattern, or your favorite indicator giving the green light.
● Shaky patterns: Not every triangle-looking pattern is a triangle. Sometimes it’s just noise. Don’t make up patterns. The market doesn’t care about your geometry.
● Overleveraging: Continuation patterns look reliable, but no pattern is bulletproof. Position sizing still matters. Don’t bet the farm because a pennant gave you butterflies.
💡 Pro Tips from the Chart Trenches
● Set alerts on trendline breaks so you’re not glued to the screen like a caffeinated hawk.
● Use pattern recognition tools if you’re a newer trader — but verify manually. No software is a crystal ball.
● Trade continuation patterns in the direction of the trend. Countertrend flags are usually bear traps in disguise.
📌 One Last Thing: Pattern ≠ Prediction
Chart patterns don’t tell the future. They tell a story about buyer and seller behavior. Continuation patterns? They’re just the market saying, “Yeah, we’re still into this trend. Just grabbing some break first.”
Use them as one part of a system. Combine them with momentum indicators, volume, or good ol’ fashioned risk management.
Because in the end, it’s not about how many triangles you find — it’s about how many fakeouts you avoid.
Off to you : Spotted any textbook triangles or sneaky flags this week? Or caught a pennant fakeout that wrecked your stop loss?
Drop your best (or worst) continuation pattern story below. You never know who might learn something from your chart scars.
Pennant
Pennant — Trend Is Your Best Friend 🚩 Pennant — Trend Is Your Best Friend 📈
drive.google.com
🔍 Introduction
The Pennant is a trend continuation pattern, resembling a small triangle that forms after a strong initial move (known as the “flagpole”). It is similar to the Flag pattern, but with one key difference: the body of the Pennant is formed by two converging trendlines, rather than parallel ones.
📐 Pattern Description
The Pennant forms after a strong, impulsive price move, indicating that the trend is likely to continue after a short pause.
Like the Flag, the Pennant consists of two main components:
The flagpole — a sharp, directional move (either bullish or bearish)
The Pennant body — a brief consolidation shaped like a symmetrical triangle 🔺
🟢 A bullish pennant forms after a strong upward move
🔴 A bearish pennant follows a strong downward move
🧠 Market psychology behind the pattern:
After a big move, many traders expect a reversal and begin taking counter-trend positions. But when the breakout occurs in the direction of the original trend, it triggers a wave of new orders, pushing price even further. That’s why the Pennant is often used to enter trades in the direction of the dominant trend.
📉 Volume behavior is also key:
High volume during the initial move
Low volume during the Pennant’s consolidation
Rising volume on the breakout
This volume pattern reflects renewed trader interest and often leads to a more explosive breakout compared to a Flag, due to the tightening nature of the consolidation.
⚠️ A weak or sloppy move before the Pennant weakens the signal and increases the risk of false breakouts.
🎯 Entry & Stop-Loss Strategy
📥 Entry: After a confirmed breakout above the Pennant’s resistance (or below it for bearish setups)
🛑 Stop-loss: Placed just below the last local low before breakout
💰 Profit Target:
Partial take profit at the top of the flagpole
Full target = the height of the flagpole projected from the breakout point (aka the Measured Move)
Always account for key support/resistance levels to define the potential range
💡 The Pennant often offers great risk/reward due to its tight structure and explosive potential.
💡 My Pro Tips for Trading Pennants
✅ Pennant Pattern Criteria
Trend continuation pattern
A strong, nearly vertical move preceding the Pennant
Triangle-shaped consolidation (two converging lines)
The Pennant body must be shorter than the flagpole
The lowest point of the Pennant should not exceed half the length of the flagpole
Breakouts should happen in the direction of the initial trend
Tight range before breakout increases accuracy
📈 What Strengthens the Signal
Sharp, clean, directional initial move (strong flagpole) ⚡
High volume on the initial move, and volume surge on breakout 💥
⚠️ What Weakens the Signal
Choppy or weak price action before the Pennant 🫤
Lack of volume during the flagpole or breakout 💤
✅ Examples of My Winning Pennant Setups
🔗 EURUSD Bearish Pennant — Ready to Drop
❌ Examples of My Losing Setups
🔗 XAUUSD Bullish Pennant — Failed Follow-through
💬 Do You Trade Pennants?
They’re one of the most powerful continuation patterns when paired with clean price action and volume confirmation. What’s your experience with Pennants? Share your wins — and fails — below 👇👇

MASTERING SYMMETRICAL TRIANGLES: A GUIDE FOR TRADERS👀See the first 3 items on the chart👆
🔰Other details:
⭐D:
⭐E:
⭐F:
⭐G:
🔰Additional Considerations for Triangles:
⭐H: Number of Points: To construct a triangle, we need at least two HIGHS and two LOWS. Occasionally, triangles are formed using six points instead of the usual four.
⭐I: Validity Criterion: The BREAKOUT point (exit point) of a triangle should not be too close to the intersection of its upper and lower sides; otherwise, the triangle loses its validity.

Flag and Pennant Chart Patterns🎲 An extension to Chart Patterns based on Trend Line Pairs - Flags and Pennants
After exploring Algorithmic Identification and Classification of Chart Patterns , we now delve into extensions of these patterns, focusing on Flag and Pennant Chart Patterns. These patterns evolve from basic trend line pair-based structures, often influenced by preceding market impulses.
🎲 Identification rules for the Extension Patterns
🎯 Identify the existence of Base Chart Patterns
Before identifying the flag and pennant patterns, we first need to identify the existence of following base trend line pair based converging or parallel patterns.
Ascending Channel
Descending Channel
Rising Wedge (Contracting)
Falling Wedge (Contracting)
Converging Triangle
Descending Triangle (Contracting)
Ascending Triangle (Contracting)
🎯 Identifying Extension Patterns.
The key to pinpointing these patterns lies in spotting a strong impulsive wave – akin to a flagpole – preceding a base pattern. This setup suggests potential for an extension pattern:
A Bullish Flag emerges from a positive impulse followed by a descending channel or a falling wedge
A Bearish Flag appears after a negative impulse leading to an ascending channel or a rising wedge.
A Bullish Pennant is indicated by a positive thrust preceding a converging triangle or ascending triangle.
A Bearish Pennant follows a negative impulse and a converging or descending triangle.
🎲 Pattern Classifications and Characteristics
🎯 Bullish Flag Pattern
Characteristics of Bullish Flag Pattern are as follows
Starts with a positive impulse wave
Immediately followed by either a short descending channel or a falling wedge
Here is an example of Bullish Flag Pattern
🎯 Bearish Flag Pattern
Characteristics of Bearish Flag Pattern are as follows
Starts with a negative impulse wave
Immediately followed by either a short ascending channel or a rising wedge
Here is an example of Bearish Flag Pattern
🎯 Bullish Pennant Pattern
Characteristics of Bullish Pennant Pattern are as follows
Starts with a positive impulse wave
Immediately followed by either a converging triangle or ascending triangle pattern.
Here is an example of Bullish Pennant Pattern
🎯 Bearish Pennant Pattern
Characteristics of Bearish Pennant Pattern are as follows
Starts with a negative impulse wave
Immediately followed by either a converging triangle or a descending converging triangle pattern.
Here is an example of Bearish Pennant Pattern
🎲 Trading Extension Patterns
In a strong market trend, it's common to see temporary periods of consolidation, forming patterns that either converge or range, often counter to the ongoing trend direction. Such pauses may lay the groundwork for the continuation of the trend post-breakout. The assumption that the trend will resume shapes the underlying bias of Flag and Pennant patterns
It's important, however, not to base decisions solely on past trends. Conducting personal back testing is crucial to ascertain the most effective entry and exit strategies for these patterns. Remember, the behavior of these patterns can vary significantly with the volatility of the asset and the specific timeframe being analyzed.
Approach the interpretation of these patterns with prudence, considering that market dynamics are subject to a wide array of influencing factors that might deviate from expected outcomes. For investors and traders, it's essential to engage in thorough back testing, establishing entry points, stop-loss orders, and target goals that align with your individual trading style and risk appetite. This step is key to assessing the viability of these patterns in line with your personal trading strategies and goals.
It's fairly common to witness a breakout followed by a swift price reversal after these patterns have formed. Additionally, there's room for innovation in trading by going against the bias if the breakout occurs in the opposite direction, specially when the trend before the formation of the pattern is in against the pattern bias.
🎲 Cheat Sheet

What do you do when your trading plan fails? Yesterday I wrote about a beautiful chart pattern that was forming on the Bitcoin daily time frame that ended up failing not long after I wrote the post. That kind of thing will shake a trader to their core, especially if they thought it was going to play out, but ended up losing their shirt.
This is why it is important to set stop losses, so that if the trade does go the other way, you will be out of the trade before it gets too bad. This is simply called risk management, and is one of the biggest things that any trader, especially new traders need to master.
Trading is a business of statistics and probabilities. Just because something has worked for you in the past, doesn't mean it is going to work for you every time. So when something like a bullish pattern that you have traded many times fails, you have to reassess and move on to the next trade. Out of 100 trades, that pattern may only work 6 or 7 times which gives you a 60-70% chance of it working in your favor. That's how it works, nothing is ever 100% in this game. So you always have to be ready for things to not work out the way you think they should.
If they don't work out, don't freak out! Just learn from your mistakes, readjust your plan, and move along to the next trade! Hopefully things like this will help you better understand the importance of a good risk management plan.
Be safe out there everyone and trade logically!

What is a Bearish Pennant Patterns?Imagine a rollercoaster: first, a steep drop (downtrend), then a brief pause (consolidation) before another drop.
💜 If you appreciate our charts, give us a quick 💜
This pause creates a symmetrical triangle of highs and lows, indicating market uncertainty. When prices break out below this triangle, it signals a likely continuation of the downtrend.
1️⃣ The Downward Journey:
A clear, steep downtrend sets the stage, indicating prices are likely to fall. Think of it as the initial dive on the rollercoaster.
2️⃣ The Pennant Pause:
Consolidation forms a triangle, showing market indecision. This is akin to the rollercoaster momentarily leveling out before the next plunge.
3️⃣ The Breakout Moment:
A swift breakout below the triangle confirms the downtrend. It's like the rollercoaster taking a sudden, sharp drop.
🚀 How to Ride the Bearish Pennant:
Step 1: Spotting the Pattern
Look for a well-defined downtrend followed by consolidation forming a triangle. The triangle's upper line is resistance; the lower one is support.
Step 2: Timing the Breakout
Be patient; wait for a rapid breakout below the triangle. High trading volume confirms the breakout's strength.
Step 3: Making Your Move
Enter a short position right after the breakout or when the breakout candle closes. This aligns your trade with the downtrend momentum.
Step 4: Planning Your Exit
Set a profit target based on your risk tolerance. Implement a stop loss above the breakout candle's highs to guard against false breakouts.
Pro Tips for Success:
✅ Stay in the Downtrend Lane:
Only trade bearish pennants within a downtrend. Avoid it during uptrends or sideways markets for optimal results.
✅ Don't Jump the Gun:
Wait for the breakout confirmation to avoid falling for false signals. Patience pays off!
✅ Volume: Your Secret Weapon:
Strong breakouts occur with high volume. More participation means stronger market conviction.
✅ Plan Your Exit:
Have a clear exit strategy. Acknowledge that breakouts might fail, and be ready to exit if the trade goes south.
Mastering the bearish pennant pattern requires a blend of technical expertise, patience, and disciplined execution. Think of it as your guide to mastering market dips and making strategic moves.
Happy trading!

Bullish Pennant PatternIn this guide, we unveil the secrets of Bullish Pennant pattern, exploring its psychology, identification, and trading strategies.
If you appreciate our charts, give us a quick 💜💜
Understanding the Bullish Pennant Pattern:
The bullish pennant emerges post an uptrend, forming a small symmetrical triangle (the pennant) during consolidation. This pattern signifies a battle between bulls and bears, ultimately leading to a breakout, usually upward, signifying the continuation of the uptrend.
Components of the Bullish Pennant Pattern:
An Uptrend: A prerequisite for this pattern, characterized by higher highs and higher lows.
A Pennant: A small symmetrical triangle forming after the uptrend, indicating consolidation.
A Breakout: The essential phase, marking the continuation of the uptrend, often occurring upwards.
Trading the Bullish Pennant Pattern:
Psychology Behind Bullish Pennant: A reflection of market consolidation after bullish momentum, highlighting the buyers' dominance.
Bullish Pennant vs. Bearish Pennant: Bullish pennants signal uptrend continuations, while bearish pennants suggest downtrend extensions.
Bullish Pennant vs. Bull Flag: Bull flags form after sharp rallies, while bullish pennants appear after extended uptrends, marked by converging trendlines.
Stop Loss Placement: Consider placing your stop loss at the pennant's resistance line for risk management.
Profit Target Setting: Customize your profit target, aligning with the pattern's flagpole height or a conservative approach, harmonizing with your risk management strategy.
Trade Wisely!
Follow us for expert trading tips and strategies!

Chart Patterns Cheat SheetHey guys!
Today we'll have a look at chart patterns - which ones are the most popular, what do they look like, and how you can leverage them in your own trading!
Chart patterns are technical analysis tools used to predict price movements based on chart formations. There are two main types of chart patterns - reversal patterns and continuation patterns . Reversal patterns suggest a shift in the prevailing trend, while continuation patterns suggest that the trend is likely to continue.
How to trade these chart patterns effectively using trendlines on Tradingview?
Draw the chart patterns you see on the cheat sheet.
Create alerts for your drawn trendlines. Set the alarms when the price crossing up/down of the trendline you draw.
Click on the "Alert" icon in the menu. This will bring up the alert creation window. You can select whatever conditions you want, I usually just use crossing up/down, and change the message to something I recognize.
Click "Create" to save the alert.
Setting alerts allows you to act quickly on the trading opportunities that the chart patterns indicate. This is a super-effective way to manage these chart patterns.
The Triangle pattern
It can be both a continuation and reversal pattern. It consists of three types of triangles:
Symmetrical Triangle
Ascending Triangle
Descending Triangle
Symmetrical Triangle
The symmetrical triangle is a classic sideways pattern where the market consolidates, creating lower highs and higher lows that look like a squeeze. Neither the bulls nor the bears have control over the current movement during the pattern.
Ascending Triangle
The ascending triangle pattern forms when the price creates a series of higher lows within a clear resistance level. This indicates that buyers are unable to break through the resistance, but selling pressure from bears is weakening with each attempt. The bulls may take control and drive a breakout.
Descending Triangle
The Descending Triangle is an inverse formation of the ascending triangle and is a bearish continuation pattern that typically forms in a downtrend. To identify this pattern, look for a clear support level followed by a series of lower highs. This indicates that buyers are unsuccessful in pushing the price higher and each attempt weakens, potentially leading to a bearish breakout.
Pennant Chart Pattern
A pennant pattern is a continuation pattern that forms when the price makes a significant move in either direction and then consolidates in a sideways movement.
Bullish Pennant Pattern
Bearish Pennant Pattern
Bullish Pennant Pattern
A bullish Pennant Pattern is where the price is likely to move in the same direction it was trading before entering the consolidation period. It forms after a sharp move higher, followed by a pennant, and then a continuation breakout. To trade this pattern, traders typically place a long order above the pennant and set a stop below the bottom of the pennant to avoid false breakouts.
Bearish Pennant Pattern
The Bearish Pennant Pattern is the inverse of the Bullish Pennant Pattern. It forms after a sharp move lower, followed by a pennant, and followed by a breakout to the downside, signaling a continuation of the overall downtrend. Traders often take advantage of bearish pennants by placing a short order at the bottom of the pennant and a stop loss above the pennant to limit their losses in case the price moves against them.
Wedge Chart Pattern
Wedge Patterns can be both continuations and reversals based on the market trend.
Rising Wedge Pattern
Falling Wedge Pattern
Rising Wedge Pattern
The Rising Wedge Pattern is identified by upward-sloping support and resistance levels in which the support level is steeper than the resistance level and creates a wedge. If the Rising Wedge Pattern forms during a downtrend, it is often used as a continuation. On the other hand, if it is formed during an uptrend, it could indicate a potential reversal. Traders typically place their entry orders when the price breaks out of the wedge formation.
Falling Wedge Pattern
The Falling Wedge Pattern is characterized by a downward-sloping resistance level and a steeper upward-sloping support level. This pattern is usually a continuation if it forms during an uptrend. And it could signal a possible reversal if it forms at the bottom of a downtrend.
Flag Pattern
The flag pattern is a continuation pattern and is useful for price action analysis.
Bullish Flag Pattern
Bearish Flag Pattern
Bullish Flag Pattern
The Bullish Flag Pattern is formed during a strong uptrend when the price makes a sharp move higher creating the pole, followed by a sideways consolidation which forms the flag. it can be formed by two rallies separated by a brief retracement period, with the first rally creating a sharp spike known as the flagpole.
Bearish Flag Pattern
The Bearish Flag Pattern is formed during a downtrend when the price pauses sideways to create the flag form after a sharp moving lower. Price often consolidates or rebounds slightly higher before continuing with the trend. The flagpole forms on an almost vertical panic price drop and is followed by a bounce that has parallel upper and lower trendlines to form the flag.
Channels
A channel chart pattern is a continuation and it consists of two parallel lines that act as zones of support and resistance.
Bullish Channel
Bearish Channel
Horizontal Channel
Bullish Channel
Bullish Channel is a continuation pattern with a positive slope. The previous uptrend will likely continue if prices break through the upper channel line. There is no theoretical price objective on this chart pattern, and the movement is bullish, which can continue as long as the bullish channel support line is not broken.
Bearish Channel
The Bearish Channel is a continuation pattern with a negative slope. The previous bearish trend will likely continue if prices break through the lower channel line. It's not recommended to go long when the price touches the lower band as the trend may continue moving along it. Corrections towards the upper band in a downward trend are usually weaker.
Horizontal Channel
Horizontal Channel forms when the price moves sideways or when it is in a consolidation phase. A line is said to be "valid" if the price line touches the support or resistance at least 3 times. The horizontal channel pattern is considered valid if the price touches the support line at least 3 times and the resistance line twice (or the support line at least twice and the resistance line 3 times).
That is the end of part one, hope you found it useful! - Don't forget to follow us for more

📊 Chart Pattern CheatsheetChart patterns are visual representations of a stock's price movement over time. These patterns can provide traders with information about the stock's trend, momentum, and potential future direction. Continuation and reversal patterns are two types of chart patterns that traders use to identify potential entry points. When considering entry points for both continuation and reversal patterns, traders often use a combination of technical indicators and price action analysis. They may use tools such as moving averages, oscillators, and trendlines to confirm a pattern's validity and identify potential entry points. Additionally, traders may set stop-loss orders to manage risk and limit potential losses.
🔹 Continuation patterns
Continuation patterns are chart patterns that suggest that the current trend will continue. They occur when the stock price consolidates in a certain range, showing a temporary pause in the trend. Some common continuation patterns include triangles, flags, and pennants. Traders may look to enter a long position when the stock price breaks out of the pattern, typically on higher than average trading volume.
🔹 Reversal patterns
Reversal patterns, on the other hand, suggest that the current trend is likely to reverse. These patterns occur when the stock price has reached a high or low point and is likely to move in the opposite direction. Some common reversal patterns include head and shoulders, double tops and bottoms, and the "V" pattern. Traders may look to enter a short position when the stock price breaks below a support level or the neckline of a pattern.
👤 @AlgoBuddy
📅 Daily Ideas about market update, psychology & indicators
❤️ If you appreciate our work, please like, comment and follow ❤️

📈 4 Common Bullish Patterns🟢 RISING THREE
"Rising three methods" is a bullish continuation candlestick pattern that occurs in an uptrend and whose conclusion sees a resumption of that trend.
This can be contrasted with a falling three method. The first bar of the pattern is a bullish candlestick with a large real body within a well-defined uptrend.
🟢 FALLING WEDGE
The falling wedge pattern occurs when the asset’s price is moving in an overall bullish trend before the price action corrects lower.
Within this pull back, two converging trend lines are drawn. The consolidation part ends when the price action bursts through the upper trend line, or wedge’s resistance.
🟢 BULL PENNANT
A pennant is a type of continuation pattern formed when there is a large movement in a security, known as the flagpole, followed by a consolidation period with converging trend line.
Pennants, which are similar to flags in terms of structure, have converging trend lines during their consolidation period and last from one to three weeks.
🟢 ASCENDING TRIANGLE
An ascending triangle is a chart pattern used in technical analysis. It is created by price moves that allow for a horizontal line
to be drawn along the swing highs and a rising trendline to be drawn along the swing lows. The two lines form a triangle.
Traders often watch for breakouts from triangle patterns. The breakout can occur to the upside or downside
👤 @AlgoBuddy
📅 Daily Ideas about market update, psychology & indicators
❤️ If you appreciate our work , Please like, comment and follow ❤️

Human vs MachinesChart patterns detection needs an extensive learning process and experience, no matter if you are a human or a machine!
Machine Learning Workflow:
There are five core tasks in the common ML workflow:
1. Get Data
2. Clean, Prepare & Manipulate Data
3. Train Model
4. Test Model
5. Improve
Since the chart patterns, beta version indicator has been released, I started working with it to find out how it works.
In the following examples, you will see the comparison between my pattern (left side) and platform pattern (right side)!
I activate the triangle, pennant, and wedge pattern indicator..!
1- Daily chart: machines did not detect anything:
2- 4 hours chart: machines did not detect anything:
3- 4 hour charts: I changed the regular time to extended hours!
Finally, the machine detects something..!
Educational point:
There are hundreds of thousands of indicators and oscillators out there, some work, some don't!
The question is:
Are you able to use them correctly and increase their performance???
Think about it..!
Best,
Moshkelgosha
DISCLAIMER
I’m not a certified financial planner/advisor, a certified financial analyst, an economist, a CPA, an accountant, or a lawyer. I’m not a finance professional through formal education. The contents on this site are for informational purposes only and do not constitute financial, accounting, or legal advice. I can’t promise that the information shared on my posts is appropriate for you or anyone else. By using this site, you agree to hold me harmless from any ramifications, financial or otherwise, that occur to you as a result of acting on information found on this site.

Triangles, Flags, Pennants.Chart patterns, are becoming one of my favorites points of view in the market.
Using this tools i become more aware of where i am in the market, the trend and where i can place correct entry's
Lets consider the difficulty of this structures. First i am not using individual lines in this chart, i am using tool bar channels. That means that the line above has to be the same as the line below, that been said. the patterns showed in this chart are just made for expert traders. Simple and clean.
We can force some structures, but when we use tool bar patterns its very hard to find structures that make sense in the market.
Thanks fo the support traders.
And keep rocking in the free world.

Triangle Patterns - Advanced AnalysisChart patterns describe distinct structures in financial time series. Their occurrence helps technical analysts predict future price variations.
Triangle patterns form a part of the most studied patterns by technical analysts and have been well documented over the years, with some even applied to climate time-series data (1). In this post, we perform an analysis of ascending, descending, and symmetrical triangles patterns.
We provide a description of each pattern and its implications, as well as a model of the price variation within each described pattern. We also review the literature in order to find their deterministic cause.
To knowledgeable investors, chart patterns are not squiggles on a
price chart; they are the footprints of the smart money.
- Bulkowski (2)
1. Ascending Triangles
Ascending triangles are characterized by a series of rising local minima (higher lows) and a series of local maxima staying at a relatively fixed level. A line is drawn from the rising minima, forming an upward sloping support line. Another line is drawn from the maxima, forming a horizontal resistance line. The apex represents the point where both lines intersect.
Ascending Triangles have a bullish bias. Once the price breaks the resistance line we can expect a rapid increase of the price. This breakout is often accompanied by an increase in volume, while the volume prior to the breakout was declining. Note that this is not a pre-requisite.
Example of ascending triangle on CALX daily.
2. Descending Triangles
Descending triangles are characterized by a series of declining local maxima (lower highs) and a series of local minima staying at a relatively fixed level. A line is drawn from the declining maxima, forming a downward sloping resistance line. Another line is drawn from the minimal, forming a horizontal support line.
Descending Triangles have a bearish bias. Once the price breaks the support line we can expect a rapid decrease of the price. Like ascending triangles, this breakout is often accompanied by an increase in volume, while the volume prior to the breakout was declining.
Example of descending triangle on CORN daily.
3. Symmetrical Triangles
Symmetrical triangles are characterized by a series of declining local maxima (lower highs) and a series of increasing local minima (higher lows). A line is drawn from the declining maxima, forming a downward sloping resistance line. Another line is drawn from the minima, forming an upward sloping support line. Both support and resistance lines should have an approximately equal slope.
Symmetrical triangles do not have a particular bullish or bearish bias, and are sometimes used to indicate market uncertainty. The expected outcomes depend on where a breakout is occurs. If the price breaks the resistance, we can expect an increase of the price, while a breakout of the support can be followed by a decrease of the price.
Example of symmetrical triangle on PFO daily.
4. Pattern Modelling
Describing price variations within patterns with a general mathematical formulation can help us describe more complex occurrences of the patterns.
Consider the price within a valid triangle as y'(t) , with support S(t) and resistance R(t) . We can describe y'(t) as follows:
y' = S + A × (R - S ) + e
with A(t) approximately periodic and in an approximate range (0,1) and e(t) as noisy component.
We can see that A(t) is subject to linear damping (the amplitude of price variations within the triangle tend to reduce linearly over time).
This model is very general and can be further developed, but it can be used as the basis for assessing the validity of triangle patterns in the next section.
5. Pattern Validity
The validity of a triangle pattern can depend on a wide variety of factors and can change from analyst to analyst.
The price concentration around the support/resistance should be relatively even, that is price should fill the triangle (as described by Bulkowski).
Bulkowski strongly suggests at least two minor highs and two minor lows should be inside the triangle formation. An additional filter is introduced by Bulkowski, the 5% failure , suggesting that a breakout should have a relative distance superior to 5% from the broken line in order to avoid reversals.
Our previous model can be used to determine the validity of a potential triangle pattern. The apex angle is directly related to the magnitude of A(t) and e(t) , with lower angle values returning a lower signal to noise ratio. This is bad since A(t) is an essential component for the structure of the triangle. If A(t) ≈ e(t) then we cannot validate the presence of a triangle pattern, since it is more likely to have been the result of noise.
6. Measure Rule
The measure rule allows anticipating the magnitude of a breakout. This allows the trader to easily set take profit/stop losses, which enables a higher control over the risk a trader would be taking trading a triangle pattern.
For ascending triangles the predicted magnitude of a breakout is equal to the value of the resistance minus the first local minima inside the triangle.
For descending triangles the predicted magnitude of a breakout is equal to the value of the first local maxima inside the triangle minus the support value.
For symmetrical triangles, the predicted magnitude of a breakout is equal to the highest local maxima inside the triangle minus the lowest local minima inside the triangle.
We can see that for ascending and descending triangles, a breakout of the non-horizontal line would imply a weaker breakout the closer the price is to the apex. In fact, the breakout magnitude would decay linearly. This is also true for symmetrical triangles. This is mentioned by Fisher (3):
- The more the price moves to the very end of a triangle, the weaker will be the breakout in either direction.
7. Theoretical Explanation Of The Occurrence Of Triangle Patterns
Explaining the presence of patterns in financial time series is a challenging task. Under a purely efficient market the presence of patterns would simply be the realization of random fluctuations.
A more challenging question would be: "how could market participants cause triangle patterns?"
If we assume that market participants cause the patterns, we know from the pattern descriptions that a mechanism inducing damped oscillatory variations exists. This oscillation is explained by Caginalp and Balenovich by two groups having asymmetric information/opinions (4).
Certain analysts describe triangle patterns as a temporary control switch between sellers and buyers, with scenarios being determined by the amount of energy exhausted by buyers and sellers.
8. Conclusion
In this post, we provided a description of triangle patterns. We highlighted the link between the signal-to-noise ratio and the apex angle of a triangle in order to determine its validity, as well as the measure rule for predicting the magnitude of a breakout.
We finally briefly mentioned the theoretical explanation behind the occurrence of triangles patterns in the market. This subject is complex and lacks further research, we highly recommend reading Caginalp & Balevonich on the subject.
Bulkowski offers an extensive number of statistics regarding triangles in his encyclopedia of chart patterns.
9. References
(1) Kaiser, J. (2016). Chart Pattern in Climate Time Series Data . Urban & Regional Resilience eJournal.
(2) Bulkowski, T. N. (2021). Encyclopedia of chart patterns . John Wiley & Sons.
(3) Fischer, R., & Fischer, J. (2003). Candlesticks, Fibonacci, and chart pattern trading tools: a synergistic strategy to enhance profits and reduce risk (Vol. 209). John Wiley & Sons.
(4) Caginalp, G., & Balevonich, D. (2003). A Theoretical Foundation for Technical Analysis . Capital Markets: Market Microstructure eJournal.

Symmetrical Triangle Traded On EURCHF Currency Pair (2021APR29)Trading the Symmetrical Triangle on EURCHF Currency Pair using the H4 Chart. Wait for a close below diagonal support level. After the candlestick closed below the level, diagonal support turned resistance. Next, wait for price pull back to the resistance line for the retest. Watch for a pin bar or rejection candle to form. The ideal condition is to have a pin bar form on the retest of the diagonal resistance line. The pin bar will form on the EMA 10, EMA 20, and diagonal resistance line for perfect ideal condition.
Here are the three ways to enter.
Enter at closing price of the pin bar, break of the pin bar nose with a sell stop order, or 50% Fibonacci Retracement of the pin bar with a sell limit order.
Stop Loss is place 5-10 pips above the pin bar tail. Or stop loss is placed above the break out candle.
Take Profit is the first point of the trend line. In this case, the take profit level is 1.09756
Pin Bar is date 29 April 2021 time 16:00.

Pennant Pattern On The H4 Chart (2021 April 28 ; 20:00)Trading the Pennant (Symmetrical Triangle). Wait for a close above/below the diagonal level. In this case, wait for a close below diagonal support resistance level. After the close, diagonal support turned resistance. Next, watch for a pin bar to form at the Resistance Line, EMA 10, EMA 20 in a Pull Back.
Enter at closing price of the pin bar, break of the pin bar nose with a sell stop order, or 50% Fibonacci Retracement of the pin bar with a sell limit order.
Stop Loss is place 5-10 pips above the pin bar tail. Or stop loss is placed above the break out candle.
Take Profit is the first point of the trend line. In this case, the take profit level is 0.94906.
Pin Bar is date 28 April 2021 time 20:00.

Guideline of Diagonal with Elliot WavesCan you spot this beautiful pattern from gold recent weeks movement? Follow us and get the latest update about this pattern later in the day!

How to Trade Diagonal Like a ProHere you find some guidelines for entry and initial protective stops for ending diagonal. We will publish more about how to integrate diagonals in Elliot Waves if we get 50 likes!
Hint: Can you spot this pattern in gold now? Check out our ideas if you don't!

EURGBP - What Is a Pennant?What Is a Pennant?
In technical analysis, a pennant is a type of continuation pattern formed when there is a large movement in a security, known as the flagpole, followed by a consolidation period with converging trend lines—the pennant—followed by a breakout movement in the same direction as the initial large movement, which represents the second half of the flagpole.
Pennants are continuation patterns where a period of consolidation is followed by a breakout used in technical analysis.
It's important to look at the volume in a pennant—the period of consolidation should have lower volume and the breakouts should occur on higher volume.
Most traders use pennants in conjunction with other forms of technical analysis that act as confirmation.
Understanding Pennants
Pennants, which are similar to flags in terms of structure, have converging trend lines during their consolidation period and last from one to three weeks. The volume at each period of the pennant is also important. The initial move must be met with large volume while the pennant should have weakening volume, followed by a large increase in volume during the breakout.
Here's an example of what a pennant looks like:

What is a pennant?A pennant is a continuation pattern.
Statistics of pennant patterns
- In 75% of cases: a pennant’s continues in the same direction.
- In 15% of cases: a pennant’s continues tries to continue in the same direction but pulls back.
- In 55% of cases, a pennant continues in the same direction and reaches his target.
Notes on pennant patterns
- pennants with a narrow base perform better
- A pennant is stronger if there are no false breaks (false pattern exits).
- If their are pullbacks after exit from the pennant: its bad for its performance.

Why I decided to change my trading style and method after years Why I decided to change my trading style and method after years:
First of all, I am not here to bash and talk negative on other traders who are consistent traders who do use these methods to their success.
I am sharing my on personal journey and opinions, based on past experiences and past journal/history.
By no mean I am saying my current style or strategies are better. I am creating this post for educational purpose only, no offense/criticize is done here to anymore.
1. I actually used to trade with S/R, supply/demand zone, and small number of indicators (MACD, EMA, RSI...etc), you can look back at my tradingview post years ago.
2. I have been somewhat consistent with those strategies and methods, and do generate profits within the years that I have adapted those type of strategies.
3. The time when I decided not to implement those methods anymore, is because when I back test and look back at my trading journals and history, I find out ways that I could improve my trading potential.
4. I realized many of these S/R, indicators are actually acting as an invisible barrier for me when I trade.
5. Many of my trades in the past have been short lived due to me sticking to my trading plan and exit a trade when the price hits a certain "criteria" such as 50 EMA, some S/R zone, or fibs level...etc..
6. While its good to follow and stick to my trading plan and risk management, but when I do self reviews on past trades, I begin to find out there is a lot of profit I am leaving on the table.
Or, poor trade management due to similar issues.
7. I begin to do in depth research on these topics and come to my personal conclusion.
8. The true is, I dont need any of those indicators and S/R level/zones on my chart. Simply remove all of them and see how the price is on a raw level.
9. I fully understand when the price is in its impulsive phrase, none of these indicators or levels can "resist" or "support" the price. The price simply breaks them or "impulse" through them.
When the price is in its corrective phrase, this is when those levels or indicators work since price is in a correction nature and allowing those levels or indicators to "catch up" to the price.
10. When I dig deeper and more research and analysis, I begin to see the market on a totally different level. I realized how the market moves, and why it moves.
11. There is a saying, "Dont just believe what the others are telling you", or "Try it yourself before saying it out loud". I certainly put in time and effort into this and have done substantial amount of work to be confidence to express here.
I hope this brief post is helpful for those traders who are still trying to identify how to trade and what to adapt in their trading plan. I welcome any positive/constructive comments, feedback, suggestions or opinions.
Thank you

India Cements - Pennant PatternNSE:INDIACEM is currently forming Pennant Pattern.
The stock is in uptrend. In case of breakdown, that can be used to buy the dip.


How to Trade Bull & Bear Pennant Pattern | Pennant Tutorial !Pennant Chart Patterns Tutorial !
Pennant Pattern : Pennant Patterns are continuation chart pattern, forms when price of a security or asset makes strong upward or downward movemnt followed by a consolidation period with converging trendlines which forms a pennant before continuing to move in the same direction. Bullish pennant forms in a bullish trend market and Bearish pennant forms in a bearish trend market.
Bullish Pennant : Bullish Pennants are bullish continuation pattern that occurs in strong uptrends and it forms after a sharp climb in price then a consolidation period with converging trendlines. After formation of the pennant, price breaks above the upper trendline of the pennant and continues the bullish trend.
Bearish Pennant : Bearish Pennant is the opposite of a bullsish pennant. Bearish pennant forms after a sharp drop in price then a consolidation period with converging trendlines after that price makes a brekout below the lower trendline of the pennant and continues the bearish trend.
(* Key things to know : In a pennant pattern the period of consolidation should have low volume and the breakout should occur on higher volume like most pattern. Above average volume confirms the breakout. You can also use other indicators like MACD or RSI to know the strength of the breakout. Look at below detailed examples - )
Please Like & Comment and Stay Tuned ! 👍
Thank You-
