The Hidden Power of Timeframes – Part 2 🔮 The Hidden Power of Timeframes – Part 2 Connection Confluence” – The Invisible Architecture of Precise Trades
Seeing the Invisible
Welcome to Part 2.
If Part 1 gave you clarity on how timeframes interact, we now go one level deeper — into the unseen forces that move beneath the surface of every chart.
🧠 The question is:
“How can I recognize where structure is headed — before it even forms?”
🧠 It’s Not Just About Alignment – It’s About Multi-Timeframe Confluence
The magic doesn’t lie in one indicator or one pattern.
It’s born in the interplay of powerful concepts:
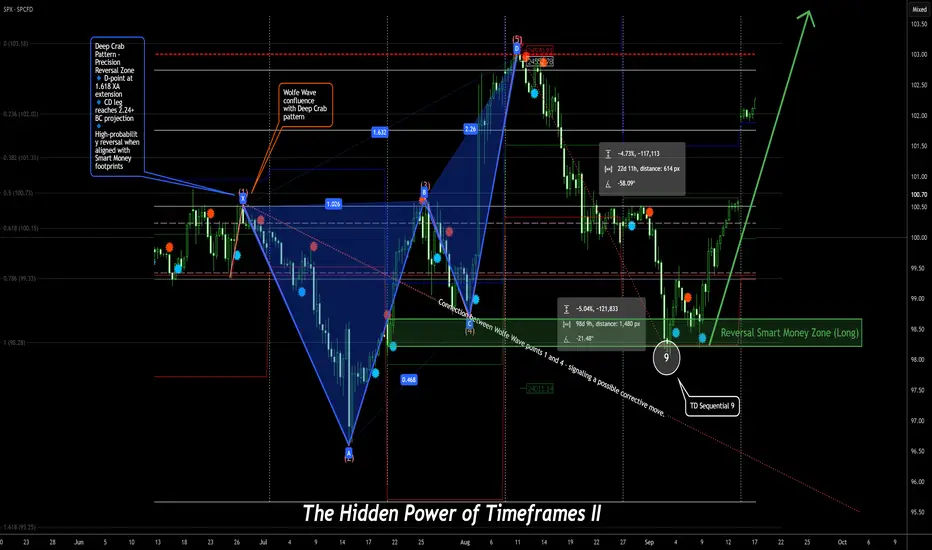
🌀 Wolfe Waves forming at the edges of Order Blocks
🧬 Harmonic Patterns merging with RSI or MACD divergences
🔢 TD Sequential counts signaling exhaustion at precise turning points
🕯️ Japanese Candlesticks confirming what orderflow already whispers
🔐 Smart Money footprints revealing where the crowd dreams — and where those dreams get crushed
This is more than technical analysis.
This is about reading intention — before it becomes visible.
⏳ Multi-Timeframe Fractals – The Echo of the Market
The market is fractal.
What unfolds on a 15-minute chart can mirror the Daily — and often previews the next big move on the Weekly.
📌 Example Scenario:
✅ Bullish divergence on the 4H chart
✅ Aligns with a Gartley pattern on the Daily
✅ Completes just as a TD9 count signals exhaustion on the Weekly
✅ While retesting a monthly liquidity pool
That’s not coincidence — that’s Signal Confluence.
And those who read it are always one step ahead of the market.
🛰️ Smart Money & Orderflow – Trade the Why, Not Just the What
Smart Money doesn’t chase candles.
It trades intent, imbalance, and psychology.
🛠️ Tools of the Trade:
Fair Value Gaps (FVG)
Order Blocks
Liquidity Sweeps
Breaker Blocks
Displacement & Inducement
Retail traders chase patterns.
Smart Money chases the dreams of retail.
🔗 The Real Edge: Seeing Connections Others Miss
A Wolfe Wave is just a shape
An Elliott Wave is just a count
A TD9 is just a number
But when…
🌀 A Wolfe Wave forms during the 5th Elliott Wave
🔢 Ends with a TD9 at a liquidity high
🔐 Inside an Order Block...
💥 That’s not just technicals — that’s chess on the chart.
That’s how real precision is born.
That’s how you anticipate moves weeks — or even months — in advance.
🧭 The Meta Skill: Navigating Confluence Across Timeframes
You don’t need to know everything.
You just need to:
✔️ Recognize when timeframes align
✔️ Feel where systems converge on one idea
✔️ Avoid forcing trades when there’s no synergy
✔️ Only act when the market’s story is consistent across all levels
A true edge doesn’t come from more tools —
It comes from clarity in complexity.
🧩 Bonus Insight: Alignment Within a Single Timeframe
Timeframe confluence is powerful.
But don’t underestimate the strength of multiple high-probability signals inside just one timeframe.
Example:
In a 4H chart:
Wolfe Wave
Harmonic Pattern
Orderflow Zone
Divergence
…all pointing to the same reversal area.
That’s not clutter — that’s weighted confluence.
These moments often deliver the most decisive trades.
💬 Comment below – or share this with someone who’s always fighting their own timeframes.
🚀 Let’s trade with precision — not prediction.
Timeframe
Master Horizontal Lines on Trading Charts | Signal & Structure 2In this second episode of the Signal and Structure series, we dive deep into one of the most fundamental yet powerful tools in technical analysis - horizontal support and resistance lines. This practical tutorial demonstrates a systematic approach to identifying and marking key price levels across multiple timeframes.
What You'll Learn:
Color-Coded Line System for Multiple Timeframes:
Monthly (Black, thickness 4) - The strongest levels from monthly candle closes
Weekly (Maroon/Brown, thickness 3) - Key weekly support/resistance zones
2-Day (Red, thickness 2) - Intermediate term levels
12-Hour (Orange, thickness 1-2) - Short-term trading levels
3-Hour (Yellow, thickness 1) - Day trading reference points
Key Concepts Covered:
Why monthly candle closes often matter more than wicks (with live examples)
How previous resistance becomes new support - demonstrated on Bitcoin's chart
Identifying distribution and accumulation ranges using horizontal levels
The importance of avoiding chart clutter - when NOT to add more lines
Using transparent candles to see through to your levels and indicators
Practical Techniques:
Live demonstration on TradingView using Bitcoin/USD charts
How to identify the most significant levels from each timeframe
Creating "boxes" to visualize trading ranges and distribution zones
Brief introduction to Wyckoff theory concepts (spring patterns)
Tips for maintaining clarity when working with multiple overlapping levels
Chart Setup Tips:
Why exchange charts (KuCoin, Gate.io) provide better volume data than index charts
Continuing emphasis on logarithmic scale for crypto analysis
How to organize your workspace for multi-timeframe analysis
This 20-minute tutorial walks you through the exact process of building a professional-grade support and resistance framework on your charts. The presenter demonstrates each concept in real-time on TradingView, making it easy to follow along and implement these techniques immediately.
Perfect for traders who want to move beyond random line drawing and develop a systematic, color-coded approach to identifying key market levels. Whether you're scalping on the 3-hour or position trading on the monthly, this hierarchical system helps you see exactly where the important levels are at a glance.
Next episode preview: Diagonal trend lines, channels, and Fibonacci levels - including a unique approach to stacking channels that provides an edge in the markets.

How To Customize The 1 Minute Scalping IndicatorThis tutorial explains each setting of the 1 Minute Scalping Indicator in detail so you understand exactly how to adjust your settings to get the results you would like from the indicator.
Here is a list of the details we discuss:
How to fix loading errors
Tooltips that explain each setting for your reference
Trade modes and how they are affected by other settings
Average candle size rejection parameters
Higher timeframe candle filters, settings and levels
External indicator trend filtering capabilities and how to set them up correctly
Stoploss and take profit calculations and settings you can adjust
Signal arrow customization options
Candle coloring adjustments
Visual/styling options
Make sure to watch the whole video so you fully understand how each setting affects the indicator for best results.

[Strategy] Trend Re-Entry Strategy using a Stoch and Zero Lag MATrend re-entries can be hard. The difficult part is knowing if price will continue to pull back or will it shift back into the original direction.
This is a strategy with some extra notes to help you understand
1. The Original entry
2. The Re-Entry
3. Is my trend ending
For this you'll need two indicators:
The Zero Lag Multi Timeframe Moving Average
and The Stocashi + Caffeine Crush
In the video I show you how to adjust the settings for a 5 minute chart on both indicators.
Long Entry rules:
You have 3 MAs. The longest one is your support and resistance
The other two are your "trading" and "trending" MAs
If price is above your support and resistance, your trading and trending should be right side up.
If price close in between trading and trending, the stocashi should be at a low point.
It needs to arrive at this low point by previous crossing down through its midline.
**If it did not cross down through its midline, there is no entry here**
Once price closes above the trading MA, you should have a rising stocashi from its valid low point.
During this uptrend, each time price pulls back in between the trading and trending MAs, the Stocashi should be at a valid low point.
Re-enter your long trade as long as:
Stocashi made a valid low
Price is closing above the trading MA
Trading MA is above Trending MA
Trending MA is above Support and Resistance MA.
You can reverse all of these instructions for taking short trades.
Potential Market Flip
If you are getting consistent invalid lows on Stocashi while price is in a correct position, this means you are losing your trend, and you should wait for your price to close below the Support and Resistance MA.
At this point your Trading and Trending MAs should be upside down. They do not always have to be BELOW the Support and Resistance MA.

The Power of Higher TimeframesIn the ever-volatile world of trading, confidence is a trader’s most valuable asset. However, confidence isn’t about bravado; it’s built on understanding the market’s broader narrative, recognizing manipulation, and adhering to a disciplined plan. Ill try to explore the keys to confident trading by leveraging higher timeframes, understanding candlestick patterns, and exploiting market inefficiencies.
The Importance of Higher Timeframe Narrative
One of the most fundamental aspects of confident trading is aligning your trades with the direction indicated by higher timeframes—daily, weekly, and monthly charts. These timeframes provide a macro perspective of the market’s overall trend, filtering out the noise of intraday price action, which is often volatile and misleading.
Intraday moves, while tempting, can cause traders to act impulsively. Without the context of the broader trend, these short-term fluctuations frequently result in losses. By staying aligned with higher timeframes, traders can avoid these pitfalls and make informed decisions rooted in the market’s overarching direction.
Candle Formation and Market Manipulation
Beyond signaling potential price movements, candles formation reveal how markets manipulate traders. A common manipulation tactic involves candles opening with a move against the overall trend, inducing traders to take positions on the wrong side before the market reverses direction.
For example, monthly candles often open with an initial move that creates a false sense of direction. During the first week or two, the price may appear bearish, enticing traders to short the market. However, this move typically serves as an accumulation phase for long positions, setting the stage for a strong upward move that forms the candle’s wick. I saw so often when M candle open and in next week form manipulation like crazy bullish or crazy bearish direction! but at the end of month we close candle absolutely in another direction)
Identifying and Exploiting Market Inefficiencies
Successful traders know how to identify and leverage market inefficiencies. These include concepts such as:
Fair Value Gaps: Price imbalances that often get filled, presenting potential trade opportunities.
Order Blocks: Zones where significant buying or selling activity occurred, marking areas of interest for future price action.
Liquidity Runs: Movements designed to trigger stop-losses or lure traders into positions, creating opportunities for savvy traders.
These inefficiencies often reveal the footprints of “Smart Money,” the institutional players whose actions drive the market. By understanding these concepts, traders can anticipate high-probability setups and align their strategies with the broader market narrative.
Discipline Through a Defined Trading Plan
Confidence in trading isn’t just about market knowledge; it’s about discipline. A well-defined trading plan grounded in a higher timeframe bias is essential for consistent success. This plan should guide every decision, ensuring that intraday fluctuations don’t provoke emotional or impulsive trades.
Traders must resist the urge to deviate from their plan unless new information invalidates their higher timeframe analysis. By sticking to their strategy, traders build confidence and consistency in their approach.
The “Judas Swing” and Smart Money Footprints
A recurring theme in market manipulation is the “Judas Swing,” an initial move against the trend designed to mislead traders. Recognizing these swings can save traders from falling into traps set by “Smart Money.”
Institutional players often position themselves within the wicks of candles, accumulating or distributing positions before driving the market in their desired direction. By identifying these footprints, traders can align their actions with the market’s true intent rather than its deceptive moves
Mastering the art of confident trading requires more than technical analysis or market knowledge. It demands a disciplined approach rooted in higher timeframe narratives, an understanding of market manipulation, and the ability to exploit inefficiencies. By following a well-defined trading plan and aligning with the broader market direction, traders can increase their chances of long-term success.
Remember, confidence in trading isn’t about always being right. It’s about having a plan, sticking to it, and learning from the market’s movements. By adopting these principles, you can trade with clarity, precision, and resilience in the face of market volatility.
Hope you enjoyed the content I created, You can support with your likes and comments this idea so more people can watch!
✅Disclaimer: Please be aware of the risks involved in trading. This idea was made for educational purposes only not for financial Investment Purposes.
---
• Look at my ideas about interesting altcoins in the related section down below ↓
• For more ideas please hit "Like" and "Follow"!

Timeframe Trap: How to Trade Stress-Free and Avoid OvertradingChoosing the Right Timeframe for Trading: A Beginner's Guide to Reducing Stress and Avoiding Overtrading
Choosing the right timeframe for trading is one of the most crucial decisions any trader can make. Yet, for beginners, it can be confusing and overwhelming. From day trading to swing trading to long-term investing, each approach comes with its own set of challenges and opportunities. The wrong choice can lead to unnecessary stress, overtrading, and ultimately, financial losses. This guide will help you navigate through different trading timeframes and styles, so you can reduce stress, avoid overtrading, and find the strategy that best fits your lifestyle and goals.
Understanding Timeframes: A Foundation for Your Strategy
Timeframes in trading refer to the amount of time that each candlestick or bar on a chart represents. Whether you're looking at 1-minute, 5-minute, or daily charts, your timeframe choice will significantly affect how you approach the market. Timeframes can generally be categorized as:
Short-Term: Timeframes from 1 minute to 1 hour, typically used by day traders.
Medium-Term: Timeframes from 4 hours to daily, ideal for swing traders.
Long-Term: Weekly or monthly charts used by position traders or long-term investors.
Your trading style will determine which timeframe you should focus on. For instance, day traders require constant attention to short-term charts, while long-term investors can take a more hands-off approach by analyzing weekly or monthly trends.
Trading Styles and Timeframes: Which One Is Right for You?
1. Day Trading: High-Speed and High-Stress
Day trading involves buying and selling securities within a single trading day, meaning no positions are held overnight. Day traders often use extremely short timeframes, such as 1-minute or 5-minute charts. The goal is to capitalize on small price movements, and the strategy requires constant attention, quick decision-making, and deep market knowledge.
From my personal experience, I found day trading to be the most stressful style of trading. The need to stay glued to the screen all day can be exhausting, both mentally and physically. It also led me to overtrade frequently, jumping in and out of positions without fully thinking them through. For beginners, this can quickly lead to burnout and financial losses.
Pros : Potential for quick profits; no overnight risk.
Cons : Extremely stressful; requires constant monitoring; high potential for overtrading.
2. Swing Trading: Capturing Medium-Term Price Swings
Swing trading involves holding positions for several days to a few weeks, aiming to profit from market "swings." Swing traders typically use 4-hour, daily, or weekly timeframes. This style allows for more flexibility than day trading since you don’t need to constantly monitor the market. It’s a good balance between active trading and giving yourself some breathing room.
When I transitioned to swing trading, I immediately noticed a reduction in stress. I was able to plan trades in advance and hold positions longer, which also helped me avoid the common trap of overtrading. By focusing on larger trends, I wasn’t tempted to react to every small price movement.
Pros : Less time-consuming than day trading; potential for larger profits per trade.
Cons : Overnight and weekend risks; still requires active market analysis.
3. Position Trading: Playing the Long Game
Position trading is more akin to long-term investing. It involves holding positions for months or even years, based on long-term trends rather than short-term price movements. Position traders often use weekly or monthly timeframes and rely heavily on fundamental analysis, such as company earnings reports or macroeconomic trends.
For those who don’t have the time or desire to monitor the markets daily, position trading can be an excellent choice. It allows you to participate in the market without the constant pressure of short-term fluctuations. In my case, using a longer timeframe for certain investments helped me maintain a broader perspective, which reduced the emotional rollercoaster that comes with shorter timeframes.
Pros : Minimal time commitment; less emotional stress; long-term profit potential.
Cons : Requires patience and discipline; slower gains; exposure to long-term market volatility.
4. Long-Term Investing: Set It and Forget It
Long-term investing isn't technically "trading" in the traditional sense. Instead of actively buying and selling, long-term investors focus on building wealth over time by holding assets for years or even decades. Investors typically use monthly charts and focus less on short-term price movements.
This approach is ideal for those who want to minimize trading-related stress entirely. By investing in fundamentally strong assets and holding them for the long haul, you can build wealth gradually without being swayed by daily market noise. This strategy also helped me maintain a more balanced work-life relationship, as I didn’t have to spend every day analyzing charts.
Pros : Low-maintenance; less stress; ideal for long-term wealth building.
Cons : Slow returns; requires significant capital and patience; exposed to long-term risks like market downturns.
How to Choose the Right Timeframe for You
Now that we’ve discussed the different trading styles and timeframes, how do you decide which one is right for you? Here are some critical factors to consider:
1. Your Schedule
How much time can you realistically dedicate to trading? If you have a full-time job or other commitments, day trading may not be the best choice, as it requires constant attention. Swing trading or long-term investing can provide more flexibility, allowing you to check the market once or twice a day instead of every minute.
In my experience, moving to a swing trading strategy helped me find a better balance between trading and my personal life. I didn’t have to stress about missing out on trades while at work, and I still had the opportunity to make profitable moves.
2. Your Personality
Are you someone who thrives on fast-paced action, or do you prefer to take your time analyzing and making decisions? Day trading can be exhilarating but also incredibly stressful, especially if you're prone to making impulsive decisions. On the other hand, swing trading or long-term investing allows for more thoughtful analysis and less emotional turmoil.
Personally, I found that my personality was better suited to swing trading. I could still make timely decisions but without the emotional exhaustion that comes with day trading. For beginners, it’s crucial to choose a style that fits your temperament to avoid unnecessary stress.
3. Avoiding Overtrading
Overtrading is one of the most common pitfalls for beginners, and I’ve fallen into this trap myself. Constantly jumping in and out of positions can lead to financial losses and emotional burnout. By choosing a longer timeframe, like swing or position trading, you can become more selective with your trades, reducing the temptation to overtrade.
One strategy I used to combat overtrading was setting specific entry and exit points based on my analysis and sticking to them. This discipline helped me avoid the emotional ups and downs of the market.
Managing Stress Through Proper Timeframe Selection
Stress is a major issue for traders, and it can often be tied to your choice of timeframe. Day traders experience constant pressure to make quick decisions, while long-term investors have the luxury of time. By choosing a timeframe that aligns with your lifestyle, you can greatly reduce the stress involved in trading.
For me, finding the right timeframe made trading more enjoyable. Instead of feeling rushed or pressured to act, I could analyze the market at my own pace, which ultimately led to better decision-making and improved results.
Tools to Help You Choose the Right Timeframe
Once you’ve identified your preferred trading style, it’s essential to use the right tools to maximize your strategy. Here are a few key indicators and methods that can help:
Moving Averages : Use these to identify trends across different timeframes. Moving averages are particularly useful for swing and position traders.
Support and Resistance Levels : Crucial for identifying potential entry and exit points, no matter the timeframe.
Economic Calendars : For position traders and long-term investors, keeping track of major economic events is essential.
Technical Indicators (e.g., RSI, MACD) : These can help you identify overbought or oversold conditions, which are useful for both day and swing trading.
Conclusion: Trade Smarter, Not Harder
Choosing the right timeframe for your trading style is essential for success, reducing stress, and avoiding overtrading. Whether you’re drawn to the fast-paced world of day trading or the slower rhythm of long-term investing, there’s a timeframe that will suit your needs.
Take the time to assess your personality, lifestyle, and goals before committing to a particular approach. And remember—trading smarter, not harder, is the key to long-term success in the markets. By selecting the right timeframe, you’ll not only improve your trading performance but also enjoy a more balanced, stress-free experience.

WHY SHOULD YOU UNDERSTAND TIMEFRAMES ? ITS ALL ABOUT PERSPECTIVEGood evening traders
I created a video for the more the beginner traders who are just getting into trading. However for those more seasoned this could give you a little insight on how to obtain more clarity and perspective when trading.
My goal here is to educate you on time frames in understanding the micro and macro of the charts you are looking at. Without the layers of perspective one can get lost in the chaos and not know where to start or what the trend is actually doing.
If you like this video please boost, if you dont like this video or want me to touch base on our trading concepts let me know in the comments below
Have a great weekend everyone
MB Trader

How I Use Multi Timeframe Analysis to Capture LARGE Price SwingsDISCLAIMER: This is not trade advice. Trading involves real risk. Do your own due diligence.
TUTORIAL:
Today, I demonstrate the thought process and mechanical steps I take when trading my Multi-Timeframe strategy. We take a look at US Treasuries, which have offers a classic lesson in how to apply this approach.
As you will see, throughout the year, this approach took some losses prior to getting involved in the "real" move which we anticipated. No strategy is perfect, and I do not purport this to be perfect. It is a rules based and effective way to read price. This strategy is great for people who don't have a lot of time to spend at the charts. I would classify this more as an "investing" strategy when utilizing the 12M-2W-12H timeframe.
If you have questions about anything in this video, feel free to shoot me a message.
I hope you have all had a great week so far.
Good Luck & Good Trading.

Revealing My Top Gold Trading Secrets for Huge Profits!In this video, I reveal my top trading secrets for making huge profits in gold trading (XAU/USD). This educational content will cover key technical analysis techniques and strategies that I frequently use in my charts, as well as valuable insights into trading mindset and proper risk management. Let's unlock the potential of your trading skills together!
Technical Approach:
In this educational segment, we'll focus on the core technical analysis principles that I use to make informed trading decisions. Here's a detailed breakdown of my approach:
Identifying the Trend:
Uptrends and Downtrends: Learn how to recognize market trends using higher highs and higher lows for uptrends, and lower highs and lower lows for downtrends.
Trendlines: Use trendlines to connect the highs and lows of price movements, helping to identify the direction of the trend and potential reversal points.
Support and Resistance Levels:
Support Levels: Identify areas where the price tends to find support as it falls, acting as a floor preventing further decline.
Resistance Levels: Identify areas where the price tends to find resistance as it rises, acting as a ceiling preventing further ascent.
Historical Price Action: Use past price movements to pinpoint key support and resistance levels that the market respects.
Liquidity Zones (LQZ):
Definition: Liquidity zones are areas on the chart where there is a high concentration of trading activity, often leading to significant price movements.
Identification: Learn how to spot these zones using volume profiles, order flow analysis, and historical price action.
Trading Strategy: Use liquidity zones to identify potential entry and exit points, as they often precede major price moves.
Volume Analysis:
Volume Spikes: Understand how volume spikes can indicate strong buying or selling interest, confirming the validity of price movements.
Volume Trends: Analyze volume trends to gauge the strength of a price trend and anticipate potential reversals.
Entry and Stop Loss Strategies:
Breakouts and Pullbacks: Enter trades on confirmed breakouts above resistance or below support, or on pullbacks to key levels within a trend.
Trailing Stop Loss: Implement a trailing stop loss to lock in profits as the trade moves in your favor, adjusting the stop loss level as the price progresses.
Mini Lessons: Mindset:
Patience and Discipline:
Patience: Wait for the right trading setups that meet your criteria, avoiding impulsive decisions.
Discipline: Stick to your trading plan and rules, even when the market becomes volatile or unpredictable.
Emotional Control:
Stay Calm: Keep your emotions in check to avoid making irrational decisions based on fear or greed.
Mindfulness: Practice mindfulness techniques to remain focused and calm, especially during stressful trading situations.
Proper Risk Management:
Position Sizing:
Risk Per Trade: Limit the amount of capital you risk on any single trade, typically 1-2% of your trading account.
Position Size Calculation: Calculate your position size based on the distance to your stop loss and your risk tolerance.
Risk-Reward Ratio:
Target Ratio: Aim for a risk-reward ratio of at least 2:1, meaning your potential profit should be at least twice your potential loss.
Trade Evaluation: Evaluate each trade based on its risk-reward ratio before entering, ensuring it aligns with your trading strategy.
By incorporating these technical strategies and mindset principles, you can enhance your trading performance and increase your chances of success in the gold market. Stay tuned for more educational content and trading insights!

Market Overview Me Going Over My Full Robin Trap Strategy In Deep Detail. And What Trades I Will Get Into This Week!

the science behind timeframes + correct timeframe sequencingtimeframes are the unit of time in which trading activity/session takes place.
timeframes are an essential tool to traders/investors because there is a direct association between the right trading style and timeframe of choice for each individual trader depending on what works or does not for them.
timeframes are often structured in forms of minutes, hours, days, weeks and months and in some cases seconds.
there are 4 main trading style : scalping, day trading, swing/position trading, this might not be the topic of discussion but like i earlier mentioned there is a mutual correlation between trading style and timeframe.
1.SCALPERS(scalping ) - these type of traders capitalize of small market movements by buying/selling in large volumes, holding those positions for a short period on time. the ideal timeframes for scalpers is 1minute to 15minutes.
2.INTRA DAY - these traders have a short-term approach to the market, buying/selling financial assets not more than 24hours/within a full trading day. their ideal timeframes are 4 hours down to 15 minutes timeframes.
3.SWING/POSITION - these traders capitalize on long-term price movements and macro trends holding positions from a couple days to a few months. their ideal timeframe range from 4hours to monthly timeframe
it also important to note that the timeframe a traders depends on how efficiently they work and other factors like, patience levels, discipline, risk management strategy and lifestyle.
MULTIPLE TIMEFRAME ANALYSIS
most traders use this science behind timeframes also called "top-down analysis" to gain a broad understanding when studying price charts.
this involves using several different time periods at the same time to form a bias when analyzing charts. similar to taking a big complex task and cutting it into smaller simpler activities still without losing sight of the bigger task.
large timeframe(complex) -> small timeframe(simple) = trade bias.
to use multiple timeframe analysis you need 3 different timeframes with the next timeframe being 4/3 times smaller than the one before it.
the first timeframe is the trend timeframe is used to identify the long term trend, the second timeframe is used to identify significant price levels, identify market structure, chart patterns and the last timeframe is the entry timeframe
scalping sequence = 15MINUTE -> 5MINUTE -> 1MINUTE
intraday sequence = 4HRS -> 1HRS -> 15MINUTE
swing/position sequence = 4HRS -> DAILY -> WEEKLY + MONTHLY.
i hope this information helps/improves your trading in a positive way.
put together by Pako Phutietsile ( @currencynerd )

This is My Favourite ICT Day Trading ModelHello traders,
This is the complete breakdown of my favourite ICT Day Trading Model.
This is so easy to replicate on any two time frames. One must be higher, while the second one which is for entry should be lower.
The higher time frame is for market direction, orderflow, trend.
Identify your discount and premium levels on higher time frame.
above 50% of your fib is premium, while below 50% is your discount.
If price is bearish, you are to look for sell opportunities when price retrace back to your premium levels.
Then go to your lower time frame to look for selling opportunities.
Your entry should be taken mostly within London kill zone.
For you to have a quality A+ trade setup, time and price must align together with your trade idea.
Your trade idea have a high probability of working out if you take your entry within London Kill Zone.
Look at my chart diagram to understand the model.

Learn What Time Frame to Trade
If you just started trading, you are probably wondering how to choose a trading time frame . In the today's post, I will go through the common time frames , and explain when to apply them.
1m; 5m, 15m Time Frames
These 4 t.f's are very rapid and are primarily applied by scalpers.
If your goal is to catch quick ebbs and flows within a trading session, that is a perfect selection for you.
30m, 1H Time Frame
These 2 are perfectly suited for day traders.
Executing the analysis and opening the trades on these time frames,
you will be able to catch the moves within a trading day.
4h, Daily Time Frames
These time frames are relatively slow.
They are mostly applied by swing traders, who aim to trade the moves that last from several days to several weeks.
Weekly, Monthly Time Frames
These time frames reveal long-term historical perspective and are mostly used by investors and position traders.
If your goal is to look for buy & hold assets, these time frames will help you to make a reasonable decision.
📝When you are choosing a time frame to trade, consider the following factors :
1️⃣ - Time Availability
How much time daily/weekly are you able to sacrifice on trading?
Remember a simple rule: lower is the time frame, more time it requires for management.
2️⃣ - Risk Tolerance
Smaller time frames usually involve higher risk,
while longer-term time frames are considered to be more conservative and stable.
3️⃣ - Your Trading Goals
If you are planning to benefit from short term price fluctuations you should concentrate your attention on lower time frames,
while investing and long-term capital accumulation suite for higher time frames.
Time frame selection is nuanced and a complex topic. However, I believe that these simple rules and factors will help you to correctly choose the one for you.
❤️Please, support my work with like, thank you!❤️

Patience: How Higher Time Frames Can Save You from False SignalsHello TradingView Community! I know it's been a little bit since we have posted any content, but we are back after a brief hiatus to bring you more in-depth trading education! Today we want to cover a topic that we consistently see when helping traders who are trying to improve their results. That topic involves patience and leveraging time frames to improve your entries and chances for successful trades.
In the fast-paced world of trading, it's easy to get caught up in the excitement of chasing quick profits, almost every trader has done it. However, successful traders understand the value of patience and the importance of using higher time frames to avoid false signals. Today we are going to broadly cover how incorporating higher time frames into your strategy can improve your long-term results.
The Power of Higher Time Frames: Unveiling the Big Picture
By zooming out and analyzing higher time frames, traders gain a broader perspective on market trends and patterns. This allows them to identify major support and resistance levels, significant price movements, and long-term trends that may be invisible on a shorter time frame. Understanding the big picture helps traders avoid getting trapped in false signals and make more accurate predictions.
Avoiding False Signals: The Benefits of Confirmation on Higher Time Frames:
One of the biggest challenges traders face is distinguishing actual market signals from noise. By patiently waiting for confirmations on higher time frames, traders can filter out the false signals that often plague shorter time frames.
In this reversal example on the 15-minute time frame, it is nearly impossible to ascertain where an entry might be. If we zoom out several time frames, we get a much better idea of a possible entry signal that has taken days to develop.
Trading with higher time frames allows you to filter out false signals and make more informed trading decisions. Don’t get me wrong, lower time frames have their place in the trading world. However, they should be complemented with an analysis of higher time frames to obtain a better understanding of market conditions. Traders can use higher time frames to get their broader entry signal and fine-tune that entry with lower time frames. A well-timed trade can make a world of difference in your profits or losses.
Developing Patience in Trading:
Trading with higher time frames requires patience and discipline. It helps you overcome the urge to make impulsive trades based on short-term fluctuations. Here are some broad examples of how you can develop patience in trading:
Set longer-term goals: Instead of focusing on daily or weekly gains, set goals based on monthly or yearly returns. This shift in perspective allows you to take a more patient approach and avoid getting swayed by short-term market movements.
Practice delayed gratification: Instead of constantly checking your trades and obsessing over every small price movement, take a step back and give your trades more time to develop. Adopting a "set it and forget it" mindset can help you avoid making premature decisions based on short-term fluctuations. If you are constantly monitoring low time frame price fluctuations you risk getting analysis paralysis, which can lead to impulsive decisions that may negatively impact your mindset and your hard-earned money.
Adopting a systematic approach: Developing a trading plan or strategy that outlines clear entry and exit criteria can help traders maintain discipline and patience. By following a systematic approach, traders can avoid impulsive decisions and stick to their predetermined rules, which ultimately leads to better trading outcomes. A well-developed systematic approach often naturally forces our hand to be patient and lets the price action play out.
Practice self-reflection: Take the time to analyze your trading decisions and outcomes. Look for patterns, identify areas where impatience may have led to poor choices, and learn from your mistakes. By reflecting on your trading journey, you can gain valuable insights and make adjustments to improve your patience in future trades. A very undervalued way to accomplish this is to maintain a trading journal. We highly recommend keeping even a basic trading journal for anyone we work with.
Conclusion:
Trading with patience and using higher time frames is a proven strategy for avoiding false signals and improving trading accuracy. By taking the time to analyze the big picture, patiently waiting for confirmations, and blending different time frames, traders can make better decisions and increase their chances of success. Remember, in the world of trading, patience truly is a virtue.

High vs Low in Time-frame Decisions🕒🚀🕒 Big Timeframes: Imagine looking at a painting from a distance – that's the essence of big timeframes. Daily, weekly, and monthly charts offer a broader view of an asset's performance over extended periods. They help you identify long-term trends and major price movements.
📊 Small Timeframes: Now, picture examining a single brushstroke – that's small timeframes. Hourly and minute charts provide granular details of short-term price action. They're useful for spotting quick trading opportunities and assessing market sentiment in the moment.
💡 Investment Approach: When it comes to investing, consider your goals and risk tolerance. Big timeframes are great for long-term investors who prioritize stability and are willing to ride out market fluctuations. Small timeframes suit traders looking to capitalize on short-term price movements.
🚀 Finding Balance: There's no one-size-fits-all answer. Many investors use a combination of both big and small timeframes. Large timeframes provide context, while small timeframes offer insights into entry and exit points.
So, what's the takeaway from this timeframe comparison? 📈 It's about understanding that different timeframes offer unique insights. Whether you're a patient investor or an active trader, the key is to align your timeframe with your investment strategy.
Stay curious, stay adaptable, and remember – the art of investing involves choosing the canvas that best suits your artistic vision! 🎨🚀

The importance of using different TimeframesWhen visualizing the market and conducting technical analysis, it is crucial to interpret different timeframes.
Multi-timeframe analysis can enhance the probability of success in our trading by utilizing support and resistance levels from higher timeframes than our base timeframe.
It is also useful for identifying candlestick patterns in other timeframes and assessing their alignment with other signals observed in our analysis.

Learn Why You Should Study Multiple Time Frame Analysis
In my daily posts, I quite frequently use multiple time frame analysis.
If you want to enhance your predictions and make more accurate decisions, this is the technique you need to master.
In the today's post, we will discuss the crucial importance of multiple time frames analysis in trading the financial markets.
1️⃣ Trading on a single time frame, you may miss the important key levels that can be recognized on other time frames.
Take a look at the chart above. Analyzing a daily time frame, we can spot a confirmed bullish breakout of a key daily resistance.
That looks like a perfect buying opportunity.
However, a weekly time frame analysis changes the entire picture, just a little bit above the daily resistance, there is a solid weekly resistance.
From such a perspective, buying GBPUSD looks very risky.
2️⃣ The market trend on higher and lower time frames can be absolutely different.
In the example above, Gold is trading in a bullish trend on a 4h time frame. It may appear for a newbie trader that buyers are dominating on the market. While a daily time frame analysis shows a completely different picture: the trend on a daily is bearish, and a bullish movement on a 4H is simply a local correctional move.
3️⃣ It may appear that the market has a big growth potential on one time frame while being heavily over-extended on other time frames.
Take a look at GBPJPY: on a weekly time frame, the market is trading in a strong bullish trend.
Checking a daily time frame, however, we can see that the bullish momentum is weakening: the double top pattern is formed and the market is consolidating.
The sentiment is even changing to a bearish once we analyze a 4H time frame. We can spot a rising wedge pattern there and its support breakout - very bearish signal.
4️⃣ Higher time frame analysis may help you to set a safe stop loss.
In the picture above, you can see that stop loss placement above a key daily resistance could help you to avoid stop hunting shorting the Dollar Index.
Analyzing the market solely on 1H time frame, stop loss would have been placed lower and the position would have closed in a loss.
Always check multiple time frame when you analyze the market.
It is highly recommendable to apply the combination of at least 2 time frames to make your trading safer and more accurate.
❤️Please, support my work with like, thank you!❤️

🕰️ The 4 Pillars of Trading Timeframes🔷Scalping:
Scalping is a trading strategy that involves making multiple quick trades within a short time frame, typically holding positions for just a few minutes. Traders who employ this strategy are referred to as scalpers. The main objective of scalping is to capitalize on small price movements and accumulate small profits that can add up over time. When engaging in scalping, traders focus on short-term charts, such as 1m,5m,15m charts, to identify rapid price fluctuations. They often use technical analysis such as order flow and volume , to spot entry and exit points. The key is to identify highly liquid instruments with tight bid-ask spreads and sufficient volatility. Scalpers must closely monitor their trades and maintain discipline, as the rapid pace of trading can be mentally demanding. Risk management is crucial in scalping and it is advised towards experienced traders that backtest their strategy before taking on scalping.
🔷Day Trading:
Day trading involves executing trades within a single trading day, with all positions closed before the market closes. Day traders aim to profit from intraday price fluctuations and take advantage of short-term trends. This style of trading requires active participation and constant monitoring of the market. Day traders typically use charts with shorter time frames, such as 15m,1h,4h to identify patterns and trends.
🔷Swing Trading:
Swing trading is a medium-term trading strategy that aims to capture price movements over a few days to several weeks. Swing traders seek to profit from short-term price fluctuations within the context of a larger trend. This approach allows traders to participate in more significant market moves while avoiding the need for constant monitoring. Swing traders typically use 1H,5h or daily charts to identify potential trade setups. They focus on technical analysis tools, such as trendlines, chart patterns, and indicators like moving averages or the Relative Strength Index (RSI). The objective is to enter positions when there is a high probability of a trend reversal or continuation.
🔷Positional Trading:
Positional trading, also known as long-term trading or investing, involves holding positions for weeks, months, or even years. Position traders aim to capture larger market trends and ride significant price movements. They often base their decisions on fundamental analysis, considering factors like macroeconomic data, company financials, and market trends.
Position traders primarily use higher time frame charts, such as weekly or monthly charts, to identify long-term trends. They rely on fundamental indicators, news events, and market sentiment to make informed trading decisions.
👤 @QuantVue
📅 Daily Ideas about market update, psychology & indicators
❤️ If you appreciate our work, please like, comment and follow ❤️

Developing a Trading Plan: 7 Key Aspects to Consider
Becoming a successful trader requires more than just simply buying and selling assets. To be consistently profitable, traders must create and stick to a well-designed trading plan. A trading plan is a detailed document that outlines a trader's approach to the market and establishes rules for each step of the trading process. The following are seven key aspects that a trading plan should include.
✅Timeframe
The timeframe determines the length of time each position will be held open. Traders can choose a long-term, medium-term, or short-term trading strategy. Long-term strategies may require holding a position for several months, while short-term strategies require closing a trade within a day, or even just a few minutes.
✅Risk Management
Risk management is the process of identifying, assessing, and prioritizing risks or uncertainties that may affect trading outcomes. A trader's risk management strategy may involve using a fixed lot size or a percentage of the account for each trade. With proper risk management, traders can reduce their losses and maximize their profits.
✅Market Conditions
Market conditions refer to whether the market is trending or ranging. A trending market is one in which prices move persistently in one direction, while a ranging market is one in which prices move sideways between a range of support and resistance levels. A trader should have different strategies for each type of market condition.
✅Choosing the Market to Trade
Traders must choose which market they want to trade, based on their trading plan, resources, and experience. Forex, stocks, commodities, and cryptocurrencies are some of the markets that traders can choose from. It is advisable to trade in markets that a trader understands and has experience in.
✅Where to Enter
Traders can use different methods to enter a trade, such as pullbacks, breakouts, or crossovers. A pullback is a temporary reversal in the direction of an asset's price movement. A breakout occurs when an asset's price moves through a support or resistance level, and a crossover is when two moving averages cross over each other.
✅Stop Loss
A stop loss is an order placed with a broker to buy or sell a security when it reaches a certain price. Traders can use percentage-based or market structure stop-losses. A market structure stop-loss is set at a support or resistance level and is based on the analysis of market structure.
✅Targets
Traders can have fixed or trailing targets. Fixed targets are predetermined profit objectives that are fixed in advance. Trailing targets are profit targets that move along with the price of the trade as it goes in the trader's favor.
In conclusion, developing a trading plan is an essential step for every trader. It allows traders to make informed decisions based on their analysis, experience, and personal risk tolerance. It's important to review and adjust the plan regularly based on market conditions and changes in personal goals and financial conditions. By adhering to a trading plan, traders can improve their chances of success in the market.
I hope this post was helpful to some of our beginner traders😊
Dear followers, let me know, what topic interests you for new educational posts?

Daily Time Frame is The MAIN Time Frame to Trade! Learn WHY:
Hey traders,
You frequently ask me what is the most important time frame to analyze and follow.
And even though I must admit that multiple time frames must be taken into consideration for successful trading like weekly/daily/4h/1h. Among them, there is the one that is universally considered to be principal. That is a daily time frame.
There are a lot of reasons why so many traders rely on a daily time frame:
1️⃣ - Daily time frame shows a global market trend at the same time reflecting a mid-term and short-term perspective letting the trader catch trend following moves and spot early reversal signs.
2️⃣ - Covering multiple perspectives, daily time frame is the foundation of the majority of the trading strategies being the main source of key levels & pattern analysis.
3️⃣ - Daily time filters out news events that happened during the trading day. It shows the composite reaction of the market participants to all the data posted in the economic calendar.
4️⃣ - Daily time frame reflects all trading sessions. Within one single candle, we see the outcome of the Asian, London, and New York Sessions.
5️⃣ - Daily candle filters out all the noise from lower time frames & intraday price fluctuations and sudden spikes & rejections.
6️⃣ - Covering all the trading sessions, daily time frame mirrors the activities of big players like hedge funds and banks. Showing us the flow & direction of big money.
⚠️Being so important for analysis, do not neglect other time frames.
The most accurate trading decision can be made only relying on a combination of intraday and daily time frames.
What is your favorite time frame to trade?
❤️Please, support my work with like, thank you!❤️

How to know where you areThe markets are fractal.
Fractal : each part of which has the same statistical characteristics as the whole.
This means that there are patterns within patterns on all degrees which can look identical from the macro to the micro. Just like the veins on your hands, to the rivers on earth.
Although in terms of trading with take profits and stop losses, you need to know exactly which degree/fractal you are trading on because it can get confusing if you don't know where you are.
The best way to learn how to approach this situation is to start from the macro and work your way down to the micro. My favorite way is,
Daily
4hr
1hr
15min ( I personally stop here )
5min
1min
This is the easiest way to start and then once you find your time frame for setups, you will get flexible with these principles and use them in alignment with your time horizon for trading.

The unknown obvious: resolution vs timeframeChart resolution and chart timeframes are the synonyms, true, but the difference between resolution based mindset and timeframe based mindset is huge.
As it is in reality, pure charts are just tick charts that then get aggregated, mostly by time. So it's all the same data, just different amount in different detail.
If you operate manually you free to scroll through all the resolutions, generally from lower to higher to gain all the information you need in best possible way.
So you mindset is this, "I need more info ima be scrolling through resolutions and be gaining it".
The term "timeframe" is much more applicable for automated trading.
There, it's very complicated to use multiple resolutions at the same time for many reasons, instead it's easier to use multiple data ranges within one resolution.
For example, you run a bot (not robot) on 1 minute chart, this bot executes & fine tunes the signals based on very short window of 4 datapoints, generates the actual signals based on 16 datapoint window, chooses a signal generation method based on 64 last datapoints, and chooses between competing assets based window length 256.
Then you ran an ensemble of these bots on every 'timeframe', this way you can emulate but never achieve a proper manual operation.
And it's good to use common but different methods on each of data windows to reduce correlations inside the ensemble, not like it's shown on my chart (disregard the levels).

Multi-Timeframe-Structure ExplainedHello traders
- In this example, we will explain why focusing on the multi timeframe structure is important.
- It is crucial to observe the chart on multiple timeframes. If we consider several time frames and they match, we will be able to have more confirmation for entry.
- How can multi timeframe structure help us in our analysis?
-Multi-time frame analysis is simply utilizing both higher and lower time frames together. Lower time frames become higher time frames; for example, one 1D candle has 24-1H candles or 6-4H candles. When we are using LTF and HTF, we should focus on the major trend direction as it is very easy to get lost in the lower time frame.
-The following example will help you better understand the importance of multi timeframe structure.
- For example, follow the chart on the 1H timeframe. At that moment, you see a bullish trend, but if you look at the chart on the 1D timeframe you can see that we are in a bearish trend, and that the bullish trend on the 1H timeframe is actually a pullback to the supply zone on the 1D timeframe.
- That is why it is important to follow the multi timeframe structure in order to have more confirmations.
-We hope this post helped you to better understand multi timeframe structure, if you have any questions, you can ask below in the comment.
