How to assess an altcoinWhen doing fundamental analysis into a stock or in this case a coin – you need to appreciate, it is still a company after all. So, your fundamental analysis should include, taking a deep dive into the available information. You might want to review the project use case, the team, and the money the project has raised so far.
As you can’t really do technical analysis with limited data available on the charts.
Your goal is to reach a conclusion on whether the asset is overvalued or undervalued. At that stage, you can use your insights to inform your trading positions. In other words, have we had a major hype & can a dump be expected?
Trading assets as volatile as cryptocurrencies requires some skill. You will need to define a strategy – otherwise, you are Gambling & not trading or investing.
As for Technical analysis, some expertise can be inherited from the legacy financial markets. Many new crypto traders use the same technical indicators seen in Forex, stocks, and commodities trading.
You often see tools such as the RSI, MACD, and Bollinger Bands which seek to predict market behavior, the issue with this is the lack of data mentioned above. Yet, these technical analysis tools are also extremely popular in the cryptocurrency space.
Slightly harder to read a moving average when the price is in a 90-degree move up.
With cryptocurrency fundamental analysis, though the approach is similar to that used in legacy markets, you can’t really use tried-and-tested tools to assess crypto assets. To conduct a proper analysis, what we need is to understand where they (the company/Coin) derive value from.
====================================================================================================================================
For you newer traders…
“What is fundamental analysis (FA)?”
Fundamental analysis (FA) is an approach used by investors and traders to establish the "intrinsic value" of an asset or business or in this case, crypto. By looking at a number of internal and external factors, their main goal is to determine whether said asset or business is overvalued or undervalued. They can then leverage that information to strategically enter or exit positions.
The goal of this article is not to dive into the methods of FA as a whole, rather just to highlight where you should begin.
====================================================================================================================================
However, there are problems with crypto fundamental analysis (in the traditional sense)
Cryptocurrency networks can't really be assessed through the same lens as traditional businesses. If anything, the more decentralized offerings like Bitcoin (BTC) are closer to commodities. But even with the more centralized cryptocurrencies (such as those issued by organizations), traditional FA indicators can't tell us much.
So now we are stuck between a rock and a hard place…
A quick step would be to identify strong metrics, these should not really take into account things like Twitter or Facebook followers. It’s so easy these days to buy several thousand followers for social media sites.
One method could be; the number of active addresses on a blockchain and see that it has been sharply increasing? For example…
Are we seeing Company actors transferring money back and forth to themselves with new addresses each time? This is the level of info you can go down to – we are on the Blockchain after all.
A little more TECHNICAL
If you want to get a bit more technical – you can look at “On-Chain” metrics in depth. On-chain metrics are those that can be observed by looking at data provided by the blockchain itself.
By running a node for the desired Crypto and examining the data, this can be time-consuming and expensive. Particularly if you are only considering the investment, and don't want to waste time or resources on this process.
A simple way to do this (in some instances) is to use API-based solutions, plug into exchanges, and see third-party tools such as Binance-research's project reports.
Look for info such as;
1) Active Addresses
2) Transaction value
3) Fees – this will give an idea of the demand…
Other areas as mentioned above
You are looking to ‘invest’ in a tech company, which is the longs and shorts of it. So go and read through the whitepaper. Assess use cases, do they make sense to you?
Review the team, do they have experience or have they already raised finance enough to keep the project going – you can now use the chain metrics – to see money flow, you could go and look at the companies register, in the UK all companies are set up under “companies house” this will show shareholders, early account info, company directors.
Other factors
How about competition in the space? What projects are offering similar solutions, are the other companies further along? Does the company you are looking at, have some kind of USP over their competitors?
Supply Mechanisms – Liquidity and volume – Market Cap.
These are all things to take into consideration .
And Finally - Initial distribution and Tokenomics as a whole
A lot of projects have created tokens as a solution looking for a problem. Doge on the other hand created a meme for the market, which is turning into a solution.
Understanding the use case, cannot be stressed enough. As such, it's important to determine whether the token has real utility. And, will it have decent adoption?
Consider how the funds were initially distributed. Was it via an ICO or IEO, or could users earn it by mining?
The whitepaper should outline how much is kept for the founders and team, and how much will be available to investors. If it was mined, you could look to evidence of the asset's creator pre-mining (mining on the network before it's announced).
We have a live stream Monday at 3:30 GMT with @Paul_Varcoe
📺 www.tradingview.com 📺
As I said, this is only to give you a starting point - especially for you newer traders. There are several other factors & methods but start here.
TRON

Theories of the Dow Types of trends Phase TRON Still a little)According to the Dow theory, there are 3 types of trends. When the market moves in a certain direction, it never makes it a straight line. The market always moves like this: a new peak; rollback; new peak. A rollback is followed by a new maximum value, a new rollback, and so on until the trend changes.
As a result, any trend can be decomposed into several stages. Each stage will have its own maximum and minimum value. If the trend goes up, then each maximum value will be greater than the previous one. Similarly for a downtrend, where each low updates the previous low.
According to the Dow theory, there are 3 types of trends:
1) main.
2) secondary.
3) insignificant (small).
The main trend is a key market movement. To determine it, you need to open a larger timeframe on the chart, say, monthly or weekly. This global trend ultimately affects everything, including secondary and insignificant trends. According to the Dow theory, the global trend lasts 1-3 years, which, however, can change.
The main trend remains valid until there are clear indications of its completion. One of such indications may be, for example, closing the price below the trend line.
Secondary trend , as a rule, goes against the main trend or acts as a correction to it. This is how the main trend can go up, and secondary trends - down.
According to the Dow theory, secondary trends last from 3 weeks to 3 months, and the rollback against the main trend lasts from 30 to 60% of its movement. Also, the secondary trend is usually much more volatile than the main one.
All these values are conditional, depending on the characteristics of the trading instrument itself.
Minor trend (small) . In theory, this is a market movement lasting up to several weeks. As a rule, it is a correction to a secondary trend. In reality, the duration of the trend depends on the trading instrument in question
______________________________
A trend has three phases. According to the Dow theory, each trend has 3 key phases:
1) phase of accumulation (distribution).
2) the phase of public participation.
3) phase of panic (realization).
Accumulation phase.
This is the first phase, the beginning of an uptrend. It is at this stage that traders and investors enter the market, which can rightly be called professional. They have the greatest amount of information (often internal - insiders) about the current state of the market and the first to begin active actions. Other market participants do not realize at this time the state and direction of the market.
Typically, this phase begins at the end of the downtrend. At this point, most of the negative news has already been taken into account by the market, due to which investors, despite low prices, begin to see an asset in the future.
Of course, detecting the accumulation phase is not so simple. Often it goes after a downtrend. And it, in turn, can be just a minor trend in the general downtrend. As a result, instead of a new trend, only a temporary pullback is obtained. From a technical point of view, the beginning of a new trend is always accompanied by a period of consolidation. This is when the market moves sideways and then begins to show an uptrend.
The phase of public participation.
Participation phase Advanced investors and traders enter the market during the accumulation phase. In their opinion, the worst is over. When the trend really unfolds, the stage of public participation begins. Economic data are improving, the market is full of good news. The more such news, the more market participants connected in this phase. This phase is the longest of all, it is also characterized by the most active movement. Highs are constantly updated - exactly what investors were waiting for.
The phase of panic (implementation).
This is the phase where experienced traders and investors exit the market, while less experienced traders enter the market. As a result, such investors and traders are excited to buy at the peak of the trend, shortly before its spectacular fall. The same phase is a reversal phase - professional investors and traders understand that the market has exhausted itself and begin to close their positions opened in the first phase.
To determine this phase, you need to carefully study the signs that the market growth is complete. Moreover, the more active the market growth, the stronger the subsequent decline will be.
A similar story when the main trend is bearish and goes down. The situation is mirrored, and at the implementation stage, a real panic is often formed, when many inexperienced investors and traders dump their assets and the price receives the last downward momentum before growth.

Tron (TRXH19) Potential LONG Trade Set Up (10X Lev. 140%+ ROE)I am looking a Tron (TRXH19) on BitMEX and it is getting ready for action.
Looking at the chart above, there are several signals to look at, please allow me a few minutes to go through these with you and feel free to hit like anytime now before we get started... Ok... Great... Let's trade!
We can see that Tron has been retracing for a while but volume has been going lower and lower, which points to bears losing momentum.
After reaching strong support, early signals are starting to develop for a bounce.
The MACD is showing a bullish crossover and the RSI has been doing higher lows since hitting oversold.
EMA10 is now being challenged, this is the first resistance to break. (Candle needs to close for signal confirmation. A close above EMA10 gives bullish potential, below is bearish).
These are just early signals and some conditions need to be met before we can trade here.
If you are interested in a full trade for TRXH19, with 140%+ ROE potential, targets, stop loss and additional information, make sure to hit like.
If enough people hit like, I will know that there is enough interest and share a full trade with you.
Thanks a lot for the continued support.
This is Alan Masters. Wishing you success, massive wealth, abundance and LOVE!
Namaste.

How to use my Indicator/MethodBuy Green
Sell Red
//
it's mainly for swing trading, i use the 3 day / 15 day / monthly charts with it and it works perfectly,
//
it works good for stocks and cryptocurrency.
//
you will use heiken ashi chart style and turn on the EMA DOTS indicator.
once the indicator is on you will hide the heiken ashi so you only see the dots.
//
when a green dot appears you buy, if a green dot appears after that green dot you hold your investment.
if a red dot appears you sell your position. easy as that.
//
the standard dots setting will be set to 10 - use this for any chart above 3 days
change the dots setting to 6 for 3day charts and below
//
shorter time frames will be choppy.
//
larger time frames will be smooth.
//
*Daytrading smaller timeframes is possible but not recommended.

How to use my indicator w/ a basic plan.I got asked "What should I use if I only have a basic tradingview account without custom timeframes?"
Here is a video explanation of what i would recommend.
Monthly / Weekly / "Maybe the daily to scalp"
Monthly will identify overall trend in the market
Weekly will be a good hold and sell
Daily to scalp as the market is going up
Hope this helps. :)

Tron (TRX) Prepares floor (Bottom?!)Tron (TRX) is preparing to form its bottom.
- We have gone oversold on RSI daily timeframe.
- And we have many EARLY signals of a coming bottom.
I will keep track here and update as necessary if this trade idea receives enough attention.
This is a friendly reminder so that you can keep and eye, opportunity to buy available.
Note: This is for your learning and entertainment. This is not a trade.
Thanks a lot for reading.
Appreciate your support.
Namaste.

The World's Simplest Profitable Strategy Tron (TRX)A lesson on the golden cross and the death cross. Very simple strategy on the 1 hour chart. (works on all time frames)
Look on the chart and you'll see we have two ema's. The orange is the 50 ema and the blue line is the 200 ema.
Golden Cross: when the the 50 ema crosses the 200 ema, resulting in the 50 ema being ABOVE the 200 ema.
Death Cross: when the 50 ema crosses the 200 ema, resulting in the 50 ema being BELOW the 200 ema.
During an uptrend the ema's act as support
During a downtrend the ema's act as resistance
So when we see a golden cross, we buy. When we see a death cross we sell. Sounds simple right? Well that's because it is.
To make this more effective we use the RSI to find divergence. Remember that divergence is when the price and indicator are moving in opposite directions.
Bullish divergence: RSI making higher lows, while price is making lower lows
Bearish divergence: RSI making lower highs, while price is making higher highs
If we are in an uptrend and we see bearish divergence then we sell. Vice versa for a downtrend. In my opinion bearish divergence is more reliable than bullish divergence. This strategy will not give you sell buy or sell targets. It simply tells you whether the price is moving up or down.
Does this strategy fail? Yes of course, no strategy is perfect. You will lose money at times. But you will make way more than you lose. It is very simple and when used with RSI it can be very profitable. You will get false breakouts but that's why we have a stop loss. You may get several false breakouts in a row but all you need is a nice uptrend to make huge profits.
First trade on the left would have made you a 40% profit if you used the RSI to find bearish divergence.
The second one 50% using the death cross
And the last 5% using RSI
On the first trade on the left had you waited for the death cross you would have made as low as 3%. This why finding divergence is crucial to being profitable. On the last trade had you waited for the death cross you would have lost money. So use the RSI when trading. Again use the RSI.
Always try and catch the cross early but never ever ever ever anticipate the cross. You only buy when they cross. Not because you think they might cross. Stick to the strategy and nothing else. Be emotionless. You buy when you see a golden cross and you sell when you see bearish divergence or a death cross.
To conclude this strategy is beginner friendly. Very simple and profitable. In my opinion stick to a few coins and that's it. Sure ETC surged after the Coinbase announcement but so what? Move on. Don't go chasing after it. Stick to few coins to actively trade. You can have as many long term coins as you want but stick to few that you actually trade. You'll be more profitable doing that than jumping from coin to coin trying to get every uptrend. Be patient and you will succeed. So if we look at where price is now, there is no reason to be in a trade. 50 ema acting as resistance. Wait for a golden cross.

Support and Resistance Levels For Beginners Tron (TRX)This post is meant for traders who may not understand support and resistance levels, how we establish these lines and why they're a useful tool.
Support refers to an area that is likely to cause a bounce or a trend reversal to the upside.
Resistance refers to an area that is likely to reject the price or cause a trend reversal to the downside.
So how do establish these lines? First we find an area where price struggles to break above (resistance) or an area that price stops and enters an upwards movement (support). Rather than draw one horizontal line that represents support/resistance, in my opinion it's better to have a "zone". The zone is essentially the area where a majority of the price find support or hits resistance. Price won't always reverse at the same exact point so we need to have a general idea of where support and resistance are. Sometimes yes, one support/resistance line will be enough and it will hit the same point more than once. For the most part, a zone gives you a better idea of where to buy.
On the left side support is created by the lowest part of the candle (the wick). The top of support is created by the body of the candle. These two lines give us our support zone. Think of support as a trampoline. As price falls we expect it to bounce up. Does this always happen? No. Sometimes price smashes straight through support. The more you trade the more you'll learn which support lines are likely to hold and which ones will fail. But even then no one is 100% accurate. The more times price hits these levels the "weaker" the level gets eventually failing. So the first support lines we draw would not have been know until AFTER we see the price bounce up. Once price establishes that low we can then draw horizontal lines across the chart so we know that if prices begins to retrace to those levels then we can see a possible bounce. Since we know price could possible bounce in a support area we can set out buy orders in that zone.
As for resistance we will generally draw our horizontal line across the highest price action. If price breaks through the resistance we can expect a rally to follow. Think of resistance as a ceiling. Price is rising and then boom it crashes into the ceiling causing it to fall back down. Price can then try again to break through this ceiling, if it does then a rally is likely to follow, otherwise known as a breakout. Note that once price breaks through resistance, the resistance now becomes a support level. The area that acted as a ceiling will now act as the trampoline. Be cautious of false breakouts. This is when price breaks resistance but then ends up falling back below resistance.
It's important to understand that support and resistance can be drawn just about anywhere. The key is to find the major support and resistance zones.
So now look at where price is currently at. Look at the support zone that's just below it and look at the resistance zone above it. If price begins to fall would you buy in the support zone? If price begins to rise, would you target the resistance zone as your sell target? Take a minute to look at the chart and decide what you would do. The answer to this depends on more than a support and resistance zone. Like I've said, you can't rely on one tool to give you all the answers. Use what you now know about support and resistance to help guide your trades. Remember support/resistance can fail without warning. Without risk, there is no reward. Buy at support, sell at resistance

Know When To Sell Tron (TRX)Buy low sell high. But when do you buy? And when do you sell? What I think is important to remember isn't always getting in at the exact top/ bottom, it's about making consistent profits. A good trader isn't right 100% of the time nor does a good trader get perfect entries and exits. A good trader is simply consistently profitable. Making a small profit is better than making no profit of losing money. Using RSI you can find excellent exits and entries. Some people teach that if the RSI is overbought you sell and when it's oversold you buy. To some degree that is true but I would NOT recommend following that. Why? Technically it's overbought at 70, so do you sell there? What about when it's 80 and it still hasn't gone down? What about when it reaches 90? In hindsight it makes sense. Every time it's overbought the price eventually comes back down. What I look for is divergence. There is bullish and bearish divergence.
Bullish Divergence- Higher lows on the RSI but lower lows on price
Bearish Divergence- Higher highs on price with lower highs on the RSI
As you can see on the chart when bearish divergence occurs the price drops off. Price continues to go higher despite RSI going lower. When the indicator and price are heading different directions, divergence is occurring. So next time you are in a trade look for divergence. It may not always appear. Look through different time frames to see if you can spot the divergence. For Tron, the 4 hour chart has worked well for spotting divergence.

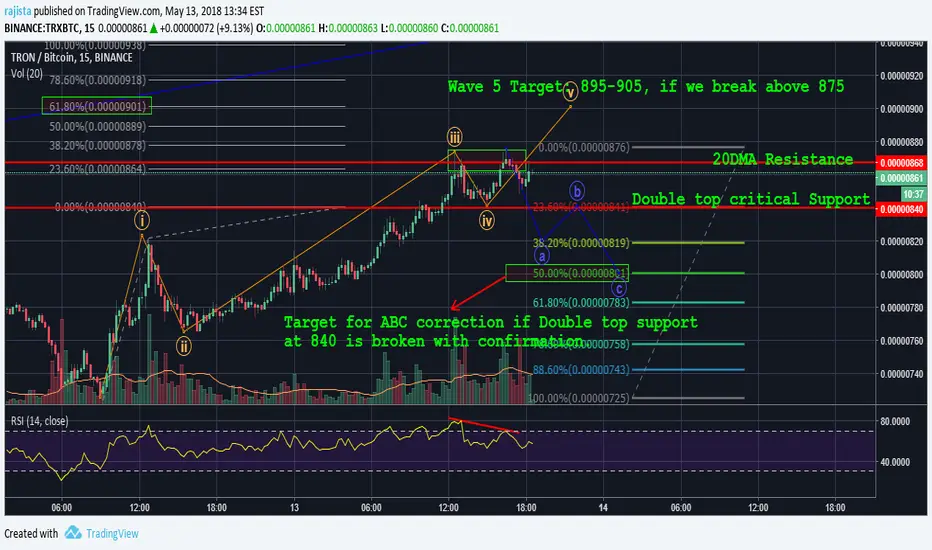
#tron $trx #tron 15min chart analysis: (Short-term analysis)#tron $trx #tron 15min chart analysis: (Short-term analysis)
Bullish bias: If we break above 875- Wave 5 Target: 895-905,
Bearish bias: If Double top support at 840 is broken with confirmation. Target for ABC correction: 800-810sats. #Crypto $crypto #cryptocurrency
www.tradingview.com
Tron (TRX) Update 4 Beginners (When Will Tron Go Up?)When I saw Tron (TRX) on Binance going up yesterday, I wanted to post an update to suggest caution. As Tron is part of the cryptocurrency markets and the market is going through a huge correction.
I know that many of the Tron traders are beginners, as Tron was only available on Binance first and Binance took the job of taking in all beginners crypto traders. That's great, we love you, everybody is welcome to trade crypcoturrencies, "The Stock Market for the People" and opportunity for everybody.
But there are a few things that are important to know about when trading in these markets.
One common mistakes we beginners make is to take any "pump" (an increase in price) and live by it. As soon as there is some movement that supports our thinking, desires or expectations, we tend to go all-in into it, which can later come at a huge price.
I am sure this is happening for many of the new Tron traders. Here is an update just for you.
Tron (TRX) needs to retrace longer before starting a new bull run.
Tron top was reached on the 5th January 2018. After we reach a top, we normally go on a retrace. We know that the cryptocurrency markets are fast, but they are fast compared to traditional markets like the stock market. For a retrace to be completed we need at least several months, that's fast because stocks can take years to complete a retrace / correction.
When the top was reached, I received hundreds of messages afterwards asking to review Tron as a new run was starting... I kept on saying "We just reached a top recently, what follows is a retrace, please allow this coin some time before we can visit again". Over a month later and Tron is still retracing.
Just like Bitcoin and the rest of the market, this retrace isn't over.
Look at the chart above for possible support levels. If one support level is broken we visit the next one. The 380 satoshis (0.00000380 btc) support level has been holding strong.
The indicators are bearish, the chart is bearish, we seem to be on a consolidation stage with bearish tendencies (which means that it can go sideways but breakdown at any given time).
So here comes my suggestion for you: If you want to trade Tron, wait a bit longer, watch from the sidelines and buy-in when we reach the bottom. When the bottom is reached you will see many signals confirming just that. When a new trend is formed, you will also have many signals. You can check here on Trading View and you will have many updates... For now, stay away from this coin, it is going down some more.
Namaste.

Trade set-up with high percentage winMy preferred trade set-up.
This works in all markets & all time levels. I use daily tf for charting & most of the time use hourly for set-ups.
See the notes on attached chart and get some screentime in. No substitute!

TRONIX (TRX) might break through 1000sats in 11 hours.Not quite following the usual Elliot Wave downwards movement but keep in mind that corrections do not always follow the guidelines of Elliot Waves.
For now the price is following the projection neatly, will update once anything notable happens.
