What Is the Bull Side – and What Is the Bear Side?In trading, there are concepts that everyone has heard of , but not everyone truly understands correctly . “ Bull side ” and “ Bear side ” are two such terms. Many traders use them every day, yet often assign them overly simplistic meanings: bulls mean buying, bears mean selling.
In reality, behind these two concepts lies how the market operates , how capital flows think , and how traders choose which side to stand on .
What Is the Bull Side?
The Bull side (bulls) represents those who expect prices to rise . However, bulls are not simply about buying .
The true essence of the bull side is the belief that the current price is lower than its future value , and that the market has enough momentum to continue moving upward .
The bull side typically appears when:
Price structure shows that an uptrend is being maintained
Active buying pressure controls pullbacks
The market reacts positively to news or fresh capital inflows
More importantly, strong bulls do not need price to rise quickly . What they need is a structured advance , with healthy pauses and clear support levels to continue higher.
What Is the Bear Side?
The Bear side (bears) represents those who expect prices to fall . Like bulls, bears are not merely about selling .
The core of the bear side is the belief that the current price is higher than its true value , and that selling pressure will gradually take control .
The bear side tends to strengthen when:
An uptrend begins to weaken or breaks down
Price no longer responds positively to good news
Every rally is met with clear selling pressure
A market dominated by bears does not always collapse sharply . Sometimes, it shows up as weak rebounds , slow and extended , but unable to travel far .
When Does the Market Lean Toward Bulls or Bears?
The market is never fixed to one side . It is constantly shifting .
There are periods when bulls are in control , times when bears dominate , and moments when neither side is truly strong .
Professional traders do not try to predict which side is right . Instead, they observe:
Which side controls the main move
Which side is reacting more weakly over time
What price is respecting more: support or resistance
These price reactions reveal who is in control , not personal opinions or emotions.
Common Mistakes When Talking About Bulls and Bears
Many traders believe they must “ choose a side ” and remain loyal to it . In reality, the market does not require loyalty .
The market only demands adaptation .
Today’s bulls can become tomorrow’s bears .
A skilled trader is someone who is willing to change perspective when the data changes , rather than defending an outdated view .
Value

Swing Failure Pattern (SFP): When Price ReversesThe swing failure pattern is a liquidity event, not a candle pattern. It marks the moment when the market reaches for obvious stops, absorbs them, and reveals true intent.
An SFP forms when price trades beyond a well-defined swing high or low and then fails to hold acceptance outside that level. The extension triggers breakout entries and stop losses. The immediate rejection back inside the range confirms that the move was used to collect liquidity rather than to continue.
What the structure tells you
The key information is not the wick itself, but the context around it. The prior high or low must be obvious and widely watched. Equal highs, range extremes, or clean swing points carry the most liquidity. When price briefly breaks that level and closes back inside, the market signals that opposing orders have been filled.
This failure traps late participants. Breakout traders are positioned in the wrong direction, while stop losses from earlier positions have already been taken. That imbalance becomes fuel for the next move.
Why SFPs matter
SFPs often appear at major range boundaries or after extended directional moves. In ranges, they define the edges where reversals are most likely. In trends, they frequently mark local distribution or accumulation before a deeper retracement or full reversal.
The move after the SFP is usually cleaner than the move into it. Once liquidity is taken, price no longer needs to revisit the level. Structure shifts, momentum changes, and expansion follows away from the failed breakout.
How to use SFPs correctly
An SFP is not a signal by itself. It requires confirmation through acceptance back inside the range and alignment with higher-timeframe context. When combined with structure, it provides precise locations where risk can be defined tightly and intent is clear.
The market does not reverse because price touched a level. It reverses because liquidity was collected and the objective at that level was completed. The swing failure pattern is the footprint of that process.

When to Trade — When to Stay OutHi everyone,
In the way I approach the market, I don’t see trading as a reflexive reaction to price movements. I see it as a structured decision-making process , built on clearly defined conditions. The market is active all the time, but constant activity alone does not create tradable opportunities. Acting without clear conditions means confusing movement with real advantage.
That’s why every decision starts with an analysis of the broader context . I only consider getting involved when the market structure is coherent, price dynamics are readable, and the environment allows for a clear assessment of risk. When the market becomes unstable, fragmented, or dominated by noise, every attempt to enter inevitably weakens decision quality. In those moments, staying out of the market is not passivity—it’s a rational act of protection .
Once the context is validated, my absolute priority becomes risk management . Before evaluating any potential reward, I need to know exactly where my scenario is invalidated. Without that information, no trade can be justified. A stop-loss is not an emotional safety net; it’s a fundamental part of decision logic. When risk is clearly defined and limited, the outcome of a trade becomes a matter of probabilities, not hope.
Even so, in a technically favorable environment, a decision remains fragile if it’s made in an unhealthy mental state . The market doesn’t punish analysis mistakes as much as it punishes execution errors driven by emotion. Any decision influenced by urgency, fear of missing out, or the desire to recover a previous loss immediately breaks the integrity of the process. In those conditions, not trading is the only decision aligned with discipline .
This is exactly why I consider the ability not to intervene a core skill. Most of the time, the market does not offer a structure with a clear edge. Being constantly in a position is neither an obligation nor a goal. Preserving capital, maintaining mental clarity, and protecting decision discipline are prerequisites for sustainable performance.
In conclusion , knowing when to trade and when to stay out is not a technical issue—it’s a mindset. When action is limited to genuinely favorable contexts and inaction is fully accepted as a strategic choice, trading stops being a chase for short-term results and becomes a controlled risk-management process . At that point, long-term performance is neither accidental nor emotional—it’s built on logic.
Wishing you profitable and disciplined trading.

How Investment Funds Really Make Money From Bitcoin📰 After years of closely following financial markets, one conclusion has become impossible for me to ignore:
most people fundamentally misunderstand how professional funds make money from Bitcoin.
Retail traders often assume funds operate the same way they do — buying low, selling high, and betting on direction.
If price goes up, they win.
If price goes down, they lose.
That assumption is overly simplistic — and largely incorrect.
🔍 For institutional funds, Bitcoin is not a directional gamble.
From what I’ve observed, large funds are not emotionally attached to whether Bitcoin rises tomorrow or drops next week.
Price direction is not their primary concern.
What truly matters is structure.
Funds are not rewarded for guessing the market correctly.
They are rewarded for controlling risk and systematically converting volatility into measurable returns.
🎯 Their real objective is volatility, not conviction.
When a fund allocates capital to Bitcoin, it is rarely driven by belief in a narrative or excitement around headlines.
They don’t follow influencers.
They don’t react to social media hype.
What they care about is quantifiable price movement.
Volatility is the raw input.
Mathematical models are the engine.
Decisions are driven by numbers, not emotions.
🧠 Buying Bitcoin does not automatically mean being bullish.
One of the most common misconceptions I encounter is the idea that institutional buying signals an expectation of higher prices.
In reality, a fund can purchase Bitcoin while remaining entirely neutral.
They can be delta-neutral, fully hedged, detached from market direction, and protected against both upside and downside moves.
This is why buying BTC is not a bet for them.
It is simply the first layer in a multi-stage trading structure.
📊 So how do funds actually profit from price movement?
By combining spot exposure with derivatives, funds build positions that benefit from movement itself rather than predicting direction.
When price rises, positions are adjusted and partial exposure is sold at higher levels to rebalance risk and lock in gains.
When price falls, exposure is rebuilt at lower prices to restore balance.
🔁 Price moves higher → exposure is reduced at better levels
🔁 Price moves lower → exposure is increased at cheaper levels
🔁 The process repeats with discipline and precision, free from emotion
This systematic process is known as gamma scalping — the quiet, continuous profit mechanism behind institutional trading.
💰 Where do their real profits come from?
Not from news headlines.
Not from influencers.
Not from ETF narratives.
Profits are generated through continuous hedge adjustments, realized volatility exceeding expectations, direction-neutral structures, and strict mathematical discipline.
⛔ The only environment that truly challenges these strategies is when the market stops moving altogether.
🧭 Let me be direct with you, speaking as a market professional.
You are not BlackRock.
You do not have their infrastructure.
You do not have their capital, execution speed, or risk frameworks.
Attempting to interpret or replicate their actions without understanding the underlying structure will not improve your trading — it will only increase confusion.
✍️ My conclusion is straightforward:
Funds do not profit from predicting the future.
They profit from engineering outcomes.
They do not trade stories.
They do not trade emotions.
They do not trade social media noise.
🎯 They trade structure.
And you?
Stop obsessing over what institutions are doing.
Start focusing on what you should be doing.
That is the line between surviving in the market
and being quietly pushed out of it.

How Funds Actually Make Money From BitcoinIf you spend more than five minutes on Crypto TikTok (YouTube or X are not much different), you’d think the entire market depends on:
- who “bought the dip,”
- who “sold the top,”
- and which whale “decided” to pump or dump.
The screamers with flashy thumbnails and zero understanding yell:
- “BlackRock is buying—BULLISH!”
- “Whales are selling—CRASH INCOMING!”
- “Institutions are entering the market!!!”
- No nuance.
- No structure.
- No clue.
Because here’s the truth:
What BlackRock buys or sells is almost irrelevant to you.
Funds do not make money the way TikTok believes.
They don’t need Bitcoin to go up.
They don’t need Bitcoin to go down.
They need one thing:
Movement. Volatility. Math.
Let’s destroy the hype and show how funds actually make money.
1. Why “BlackRock is buying BTC” tells you absolutely nothing
Retail sees a headline:
“ETF inflows: +5,000 BTC today!”
And jumps to conclusions:
“They know something!”
“Price HAS to go up!”
“Institutions are bullish!”
No.
A fund can buy BTC and still be:
- 100% hedged
- delta-neutral
- directionally flat
- risk-neutral
- fully protected against price movement
The purchase is not a bet.
It’s a component of a structured position.
Buying BTC is just Step 1.
What matters is Step 2, 3, 4, 5…—all the parts TikTok doesn’t even know exist.
2. Why TikTok “analysts” have no idea what they’re talking about
If someone:
- screams in every video,
- says “bullish” or “bearish” 40 times a minute,
- thinks “institutions pump price,”
- doesn’t know what delta, gamma, basis, hedging, ATM straddles are…
…then they are not explaining institutional flow.
They are farming views and likes, not teaching markets.
Let’s be blunt:
If you can’t explain a delta-neutral hedge, your opinion about what BlackRock “plans to do” or "is doing" is worthless.
So let’s walk through how a real fund uses BTC to print money without caring if price goes up or down.
3. How a real fund makes money from volatility (step-by-step, using $100,000 BTC)
Assume:
- BTC price = $100,000
- A fund wants exposure to volatility, not direction
- They buy a BTC ATM straddle (call + put at 100k)
- Delta ≈ 0
- Gamma > 0 → the part that generates money
- They also own BTC spot for hedging.
- Let’s say the fund holds 1 BTC worth $100,000 as inventory for hedge adjustments.
At the start:
Delta-neutral. No directional risk.
Now let’s see how they profit.
Step 2 – BTC goes up 10% → $110,000
Straddle delta becomes +0.5 BTC.
The fund is unintentionally long 0.5 BTC.
To go back to neutral:
The fund sells 0.5 BTC at $110,000.
Cash received:
0.5 × 110,000 = $55,000
Theoretical cost basis (100k):
0.5 × 100,000 = $50,000
👉 Profit from hedge = $55,000 – $50,000 = $5,000
Plus, the straddle increased in value due to volatility.
Step 3 – BTC drops 10% → $90,000
Now straddle delta flips negative: –0.5 BTC
To get back to neutral:
The fund buys 0.5 BTC at $90,000.
Cash paid:
0.5 × 90,000 = $45,000
If they later sell that BTC at the baseline of 100k:
👉 Profit = $50,000 – $45,000 = $5,000
Again, without needing BTC to go up or down, “as predicted.”
This is called:
Gamma scalping — the quiet, relentless engine behind institutional P&L.
Up move → sell high.
Down move → buy low.
Repeat. Print. Sleep.
4. Where does the REAL profit come from?
A fund earns from:
- hedge adjustments (buy low, sell high, but mathematically—not emotionally)
- straddle appreciation as realized volatility exceeds implied volatility
- basis differences between spot and futures
- neutrality to direction, allowing consistent compounding
They make money even if Bitcoin swings between 95k–105k for weeks.
The only time they lose?
When BTC does NOT move.
Because then the straddle premium decays.
That's it.
Nothing to do with faith, predictions, narratives, influencers, or ETF flows.
5. So why should YOU ignore what BlackRock is doing?
Because:
- You are not BlackRock.
- You do not run a delta-neutral book.
- You do not make money from gamma exposure.
- You do not scalp intraday hedges on $100M positions.
- You do not capture basis spreads across spot and derivatives.
- You do not have a trading desk rebalancing risk every hour.
But the TikTok screamers will still tell you:
“Institutional buying = bullish!”
“Institutional selling = bearish!”
“Whales know something!”
They don’t know anything.
Especially not about institutional structure.
So here’s the punchline:
Watching what funds do—without understanding why they do it—is the fastest path to confusion in the best case and destruction in the worst.
You don’t have their:
- tools,
- capital,
- execution speed,
- risk models,
- mandate,
- or mathematical framework.
So trying to mimic them is not just pointless —it’s dangerous.
Final Lesson: Ignore the noise, ignore the hype, ignore the TikTok parade.
BlackRock doesn’t care about bull markets or bear markets.
BlackRock doesn’t need Bitcoin to moon.
BlackRock doesn’t panic when Bitcoin drops.
Because BlackRock doesn’t trade the story.
They trade the structure.
And unless you operate like a fund — stop pretending their moves matter to your trading.
You’re not them.
You don’t have their machinery.
You don’t have their volatility book.
So:
Stop watching what institutions do.
Start understanding what you should do.
That’s the difference between surviving and blowing up.
P.S: BlackRock and TikTok are used just as an example:)

Zulu PrincipleJim Slater beat the market for decades by systematizing quality + reasonable price + momentum—first via a 1960s “earning situations” turnaround playbook, then (1992+) via the Zulu Principle: small/mid caps with fast EPS growth, efficient capital use, cheap vs growth (low PEG), and RS strength, managed by strict quarterly rebalances.
The two playbooks
1) “Capitalist” (1960s turnaround)
Yield ≥ 4%, EPS up in ≥4 of 5 years, EPS ≥ 2× in 4 years
Optimistic chairman’s statement, sound liquidity, no exceptional vulnerabilities
Reasonable asset value, not family-controlled, voting shares
Spirit: early GARP before it had a name—cash-generative, improving earners with robust balance sheets.
2) Zulu Principle (1990s, refined & timeless)
PEG < 0.75 (value vs growth in one metric)
P/E < 20
EPS growth > 15%
12-mo Relative Strength > 0% (price momentum)
ROCE > 12% (quality/efficiency)
Market cap £20M–£1B (small–mid where “elephants don’t gallop”)
Quarterly full rebalance: buy all qualifiers; sell anything that drops off; no in-between adds.
Why it still works
Aligns with the three empirically robust factors: Quality, Value (vs growth), Momentum.
Captures post-earnings-announcement drift by favoring positive EPS surprises and upgrades.
Rules ≫ opinions: removes emotion, enforces discipline via scheduled rebalances.
When few names qualify (tight markets)
Relax one notch (e.g., PEG < 1.0, P/E < 25, ROCE > 10%).
Widen geography (apply the same screen across EU/US/ROW).
Layer news filters (earnings beats, trading updates) on top of the screen.
Ready-to-run screen: www.tradingview.com
Universe: your domestic market + optional global small/mid
PEG (1y forward EPS growth) < 0.75
P/E (TTM or forward) < 20
EPS growth (TTM or forward) > 15%
Relative Strength (12m vs market) > 0%
ROCE > 12%
Market Cap , 1.1x USD
Liquidity guardrails: £5k ~ £20k Daily Volume
Sanity Check: Golden Cross, Price above 50/200 DMA
Portfolio construction & rules
Quarterly rebalance (strict): equal-weight all qualifiers; sell anything that no longer qualifies.
Max names: 20–40 (equal weight); if >40, rank by lowest PEG → highest RS → highest ROCE.
Risk: position size so any single name ≤ 5% weight; optional 15–25% stop from entry if you want overlays.
Costs/slippage: use liquid names (ADV filter) and quarterly cadence to keep friction low.
Upgrades you can test
Replace RS>0% with 6-Month RS > 5% or 12-Month RS > 10%.
Add Net debt/EBITDA < 10× (quality balance sheet).
Require positive estimate revisions in the last 3 months.
Momentum overlay: require price above 50/200-DMA to avoid value traps.

Value to Price Contraction PatternVPC Overview
What to Watch During Corrections
Stay engaged. Corrections are when future leaders reveal themselves.
Breadth divergence = danger. If indexes rise while the percentage of stocks above the 200-DMA is less than 50% (especially in the 30s), expect a pullback; rallies are narrow and fragile.
Look beyond cap-weighted indexes. Check equal-weight S&P, S&P 400 (midcaps), and Russell 2000; if they lag, leadership is thin.
Distribution vs. accumulation. Clusters of distribution days with few/brief accumulation days = risk-off regime.
How Leaders Reveal Themselves (3 Phases)
Predictive (during the correction):
Stocks hold up the best, often within ~25% of 52-week highs while the market is weak.
The RS line makes new highs even if the price is flat/down. Keep them on the A-list.
Right off the lows (post-FTD):
Explosive moves straight from lows, first into new high ground.
These often become the cycle’s monsters; wait for the first tight add-on/base if the initial thrust is extended.
Confirming (after the turn):
Breadth broadens; more proper bases are complete; opportunities are more obvious but still fruitful.
Entry Playbook
Require a Confirmed Uptrend: A follow-through day (FTD) + real setups. FTD alone is not a buy signal.
Focus on VCP bases (Volatility Contraction Pattern): successively tighter swings, drier volume, and right-side strength; buy as it clears the pivot with power.
RS Line New Highs into/at Breakout = Green Light.
Recent IPOs: prime “magnitude plays”; catch early primary bases coming out of corrections.
Progressive Exposure (when trades work)
Start with ~25% exposure (e.g., 4–5 x 5% “pilot” positions or one 20–25%).
If pilots gain traction, move quickly to ~50%, concentrating on the best names (add to winners).
If strength persists, scale to 75–100%.
Do not scale up if pilots aren’t working; reduce instead.
Selling & Timeframe
Define intent up front: trade (harvest faster, lower drawdown) vs campaign (accept drawdowns for bigger targets).
Sell into strength when the extension vs. key MAs is wide and the downside is greater than the upside.
For developing skill: take partials at 2–3× your initial risk (R) to “free-roll” the position; trail the rest.
Never raise cash just because the index is red; raise cash when your stocks show deterioration or hit stops.
Risk & Stops
Enter with a tight risk (Minervini style: often 3–5% below a well-defined pivot/low).
Position size so a stop hit costs ~1–2% of equity per idea.
Don’t average down. Cut quickly; the strategy is better than you—your job is to execute it.
Five Fast Filters for New Leaders
Shallow corrections from highs (ideally ≤25%) and quick recoveries.
Bases forming within long-term uptrends; VCP tightenings.
Fastest back to new highs after the market low; frequent up-days > down-days (“ants”: ≥12 up in 15).
The RS line is making new highs before/at breakout.
Recent IPOs with real growth.
Mindset
Commit to one sound strategy and master it; discipline is greater than prediction.
Trust the stocks, not the headlines. When the market confirms and the leaders set up, act.
Scanner:
www.tradingview.com
Purchasing Power vs Gold, Stocks, Real Estate, BTC (1971 = 100)Since the U.S. left the gold standard in 1971, the dollar has lost more than 85% of its purchasing power. This chart compares the dollar’s decline to major assets including gold, stocks, real estate, and Bitcoin, all normalized to 1971 = 100. It shows how value preservation and growth have shifted across different asset classes over time.
Source: FRED (CPIAUCSL, SP500, MSPUS) • OANDA (XAUUSD) • TradingView (INDEX:BTCUSD/BLX)
Visualization by 3xplain

Fair Value Gaps: The Market Secret You Shouldn’t IgnoreEver scrolled through a chart and spotted a weird empty space in the candles — like the market just skipped a beat? That’s a Fair Value Gap (FVG). It’s one of those subtle price imbalances smart traders love to hunt for. Understanding how these gaps form and how price reacts around them can seriously level up your chart-reading game.
What Is a Fair Value Gap in Trading?
A Fair Value Gap happens when there’s a sudden surge in buying or selling pressure that causes price to move so fast, it doesn’t fully balance out between buyers and sellers. In simple terms, it’s an imbalance — a zone where the market skipped over potential orders.
When you hear traders talking about FVG in trading, they’re referring to those little pockets of unfilled liquidity left behind during strong moves.
So, what is FVG in trading, and why does it matter? Because price often comes back to those areas later to “rebalance” — filling the gap before continuing in the original direction. That’s the core logic behind Fair Value Gap trading.
Bullish and Bearish FVGs
There are two main types of Fair Value Gaps — bullish and bearish:
Bullish Fair Value Gap (bullish FVG): Forms during a strong upward move, when aggressive buyers push price higher, leaving a void below. Price might later dip back into that zone before continuing upward.
Bearish Fair Value Gap (bearish FVG): Forms in a sell-off, when sellers dominate and the market drops quickly, skipping over potential buy orders. Later, price often retraces upward to “fill” that gap.
Both can act as magnets for liquidity — areas where smart money likes to re-enter the market.
Fair Value Gap Example
Let’s say Bitcoin jumps from $110,000 to $120,000 in a single bullish candle, with almost no trading in between. That sudden move leaves a Fair Value Gap — the zone between the candle’s high and low where little to no trading took place.
If the market later pulls back to that range and finds support before bouncing, you’ve just witnessed a textbook Fair Value Gap example in action.
Using a Fair Value Gap Indicator
You can spot these zones manually by looking for three-candle structures — one candle that “leaves the gap” and two surrounding it that don’t overlap. But if you prefer automation, you can use a Fair Value Gap indicators:
Fair Value Gap Trading Strategies
Fair Value Gap trading isn’t about chasing price — it’s about waiting for the market to come back to you. Within Smart Money Concepts, traders often combine FVGs with CHoCH (Change of Character) to confirm a potential shift in structure before entering.
A common approach is to mark recent FVGs, identify the broader trend, and wait for price to revisit a gap in line with that trend.
In a bullish trend , traders look for bullish FVGs below current price as potential demand zones — ideally after a CHoCH confirms that buyers are stepping back in.
In a bearish trend , they watch for bearish FVGs above current price as potential supply zones, again validated by a CHoCH showing a shift in control.
Still, it’s important to remember — these setups are not guarantees. The market doesn’t owe you a fill. Use FVGs and CHoCH as part of the Smart Money framework, not as standalone signals. Always manage risk and make your own trading decisions based on your personal strategy and comfort level.
Final Thoughts
So, what is a Fair Value Gap really? It’s not magic — just the market showing where it moved too fast. Learning to read Fair Value Gaps gives you insight into liquidity, momentum, and potential reversals. Whether you use a Fair Value Gap indicator or mark them by hand, mastering FVG in trading can give you a serious edge in spotting high-probability zones.
Just keep in mind — no indicator or setup replaces good judgment.
Observe, adapt, and let the charts speak for themselves.

FOMC has cleared liquidity levels around this technical rangeNews Drivers do not overpower technicals, the fundamentally driven movements are just banging around into huge money pending orders. No way around these mechanics.
That what we saw today, and what will continue to happen forever and ever 💎 Not saying it will always be a ricochet like today, but the orders are always there.

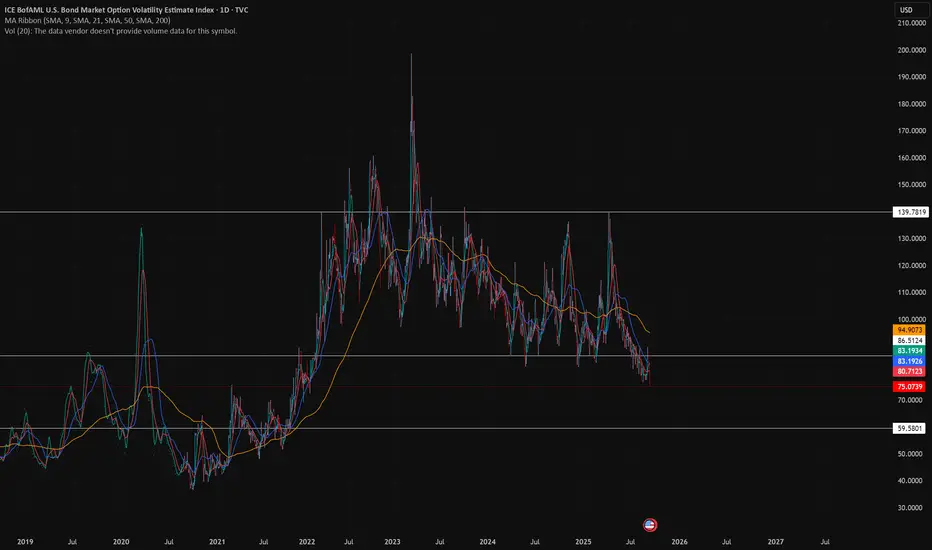
ZB/MOVE Strategy📚 Bond Market Volatility & MOVE Index Strategy
1. What is the MOVE Index?
MOVE = Merrill Option Volatility Estimate (created 1998 by Merrill Lynch, now ICE).
It measures implied volatility in U.S. Treasury options (1-month maturities across 2y, 5y, 10y, 30y).
Known as the “VIX of the bond market”.
Normal range = 55–130.
Below 60 → calm bond market.
Above 120 → extreme stress.
Historical extremes:
2008 Financial Crisis → 264.
March 2023 Banking Crisis → near 200.
2. Why It Matters for Trading
Bonds are normally “safe” assets, but when MOVE spikes:
Rates swing wildly → Treasury ETFs (TLT, IEF) become volatile.
Correlations with stocks shift (sometimes both down).
Like the VIX, MOVE can be used as:
A fear gauge (risk-on/risk-off sentiment).
A timing tool for tactical entries/exits in long-term Treasuries.
3. Typical Bond Behavior vs MOVE
High MOVE (panic):
Bonds often sell off hard (yields spike).
After panic, Treasuries may rebound sharply as flight-to-safety resumes.
Low MOVE (calm):
Bond yields drift slowly.
Carry trades (borrowing short-term, buying long-term) work better.
4. MOVE–TLT Strategy Example (Conceptual Backtest)
Rules:
Buy TLT (20+ Year Treasury ETF): when MOVE > 150 (panic zone).
Exit to Cash: when MOVE < 100 (calm zone).
Why It Works:
Extreme MOVE spikes = fear washouts → bonds oversold.
Exiting at calm levels avoids long drawdowns when yields grind higher.
Enhancements:
Filter by trend: Only take BUY if TLT is above its 200-day MA.
Inverse play: Short TLT (or long TBX, TBT) when MOVE climbs from calm → stress zone.
5. Strategy Pros & Cons
✅ Pros
Rules-based, objective, avoids “gut calls” on rates.
Catches panic-driven rebounds.
Reduces exposure during long bond bear markets (like 2022).
❌ Cons
MOVE is not directly tradable (only as a signal).
Timing lags → by the time MOVE spikes, drawdown in ZB/TLT may already be deep.
False signals during policy-driven markets (e.g., QE, yield curve control).
6. Practical Trading Tools
ETF Plays:
Long Bonds: TLT, IEF, ZROZ.
Short Bonds: TBT, TMV, TBX.
Futures:
ZB (30Y Treasuries), ZN (10Y), ZF (5Y).
Options:
MOVE itself = implied vol proxy.
TLT options → hedge with straddles when MOVE spikes.
7. Educational Takeaway
MOVE is a macro volatility barometer.
It can provide contrarian buy signals for Treasuries when extreme.
Works best when paired with trend confirmation (MAs) and macro awareness (Fed policy, inflation prints, banking stress).
✅ In one line:
The MOVE index, the “VIX for bonds,” is a powerful sentiment gauge — traders can use its extreme spikes as buy signals for long bonds (TLT) or fade them when calm, turning bond volatility into a structured timing strategy.
MVRV Demystified: A Guide to Tops, Bottoms & RiskFinancial nerds love to give tools weird names to make them look like fortune-tellers. Some actually are predictive—like grandma’s dreams!🌙 I’m Skeptic from Skeptic Lab , and today we’re talking about MVRV .. First off, it can’t predict the future , but it tells you four key things:🔮
Identifying market tops and bottoms
Assessing market sentiment
Trading strategies
Risk management
What is MVRV? 🔍
Imagine you have a box of chocolates. You want to know how many you have and what they’d be worth if everyone decided to buy or sell.
MVRV is a number that shows: “How the current value of everyone’s chocolates compares to the price they originally paid.”
High MVRV → people are selling chocolates for much more than they paid → expensive market.
Low MVRV → people are selling for less than they paid → cheap market, potential buy zone.
In short: MVRV is like a green/red light for buying and selling chocolates 🍫🚦.
The Formula ➗
Market Value (MV): total value of all coins at current market price.
Realized Value (RV): total value based on last on-chain transaction price — a "truer" cost basis, filtering out short-term volatility.
Why Z-Score? ✨
MVRV alone sometimes misleads:
In bull markets , it can stay high for weeks → fake sell signals.
Low MVRV can just be short-term noise.
One week after MVRV was introduced, David Puell and Murad Mahmudov created the MVRV Z-Score. It standardizes MVRV against historical mean and volatility, showing if current levels are truly abnormal.
Z > 7 → speculative top
Z < 0 → deep undervaluation, potential bottom
Applications 🎯
Spotting Tops & Bottoms:
High MVRV (>3.5) = late bull top
Low MVRV (<1) = bear bottom, strong buy
Z-Score filters extremes
Market Sentiment:
High = greed, low = fear → emotional barometer
Trading Moves:
Long-term: buy <1, hold
Medium-term: sell >3.7, buy <1
Timebound MVRV (365d, 60d) shows short vs long-term holder pressure
Risk Management:
Identifying potential profit zones Checks if BTC is overpriced/undervalued vs RV
Works best combined with SOPR, NVT, macro factors
Limitations 🌡️
Sensitive to volatility
Assumes on-chain movements = sales (not always)
Blind to shocks (regulations, macro events)
Overvaluation can persist → mistimed sell signals
Needs historical data → weak for new coins
Not standalone → combine with other metrics
Conclusion 📍
MVRV compares Market Value to Realized Value → shows over- or undervaluation
Identifies market tops and bottoms
Z-Score filters noise, highlights abnormal levels
Historically effective in Bitcoin cycles
Best used with other metrics for holistic analysis
Boost for more Skeptic takes :) 📈
Disclaimer: This article was written for educational purposes only and should not be taken as investment advice.

The Markets, the Rabbi and the Goat...It’s funny how sometimes markets react like people in old jokes…
They scream when things get bad, then cheer wildly when things return to how they were — as if something amazing just happened.
Let me tell you one of those jokes.
It’s about a house, a rabbi… and a goat.
A man goes to the Rabbi:
“Rabbi, my house is too small. The kids are screaming, my wife’s yelling, I’m losing my mind!”
The Rabbi calmly replies:
“Bring in the chicken.”
Two days later:
“Rabbi, it’s worse!”
Rabbi:
“Now bring in the duck.
Then the pig.
And finally… the goat."
Now the house is in complete chaos. Smell, noise, no space to move or breathe.
The man returns, ready to break down:
“Rabbi, this is hell!”
The Rabbi smiles:
“Now take them all out.”
A few days later, the man comes back glowing:
“Rabbi… it’s incredible! So much space! So quiet! So fresh!”
📉 Now, 2025 markets
In April, Trump imposed tariffs.
Markets fall sharply. Analysts scream recession. Headlines go full drama.
Recently, “brand new deals” have been announced.
Markets explode to new all-time highs.
Applause. Celebration. “Stability is back.”
But if you read the fine print…
The deal is basically the same old deal. Renegotiated. Repackaged.
Just without the goat.

Capital Doesnt Lie - The Energy ProblemPart 1: THE ENERGY PROBLEM
Everything we do produces energy, even prayer. If you have ever felt tired after praying for someone, that's because you spent energy and made an effort; let's call that energy 'capital' . Capital begins with effort, whether you see it or not.
The problem is: how do we use it or store it?
Imagine that energy as an invisible ball growing in front of your head. Every time you work and think, you're growing that invisible energy ball of capital. So, how do you get it in your hands? You can plant a cucumber, craft a chair, or clean your house. It's your order, attention, time- all energy made visible in the house, stored in the cucumber or the chair.
Genesis 3:19
'By the sweat of your face you shall eat bread…'
Verse Comment: It doesn't say 'by luck' or 'by inheritance.' It says by sweat. That's energy. That's effort. That's the value produced.
Proverbs 14:23
'All hard work brings a profit, but mere talk leads only to poverty.'
Verse Comment: Effort always creates something. Even spiritual labor, such as intercession, leadership, and parenting, is a form of value creation.
But here's the issue. That cucumber plant? It goes bad. That chair? It breaks. That clean house? Dirty again in 24 hours."
Everything we do has a cost; it's not free. Energy fades unless you can find a way to store it longer than the life of the thing you created.
So if everything fades, the big question becomes: How do you store the surplus of your energy, (the part you don't need today) so it doesn't fade by tomorrow?"
That's the foundation of all capital. Of all value. And of all wealth. And it starts with understanding where your energy is going, and what it's pouring into.

How I screen for long term investmentsIn this video, I’ll show you the exact stock screener I use to find long-term investment opportunities — the kind of stocks you can buy and hold for years.
I’ll walk you through the key metrics to look for, how to use free tools like TradingView screener, and what red flags to avoid. This strategy is perfect for beginner and experienced investors who want to build long-term wealth, not chase hype.
Whether you're looking for undervalued stocks, consistent compounders, or just trying to build your long-term portfolio, this screener can help.
Hope you enjoy!!

The Trump PatternWhen Donald Trump took office in 2017, the U.S. stock market experienced dramatic fluctuations—marked by steep declines followed by eventual rebounds.
This pattern, which we'll call the "Trump Pattern," repeated itself during his presidency and is now emerging again as a point of interest for investors.
While the specific causes of these market shifts varied, key factors—particularly tariffs, inflation concerns, and Federal Reserve (FED) actions—played critical roles in the market's rise and fall during Trump’s presidency.
The Trump Pattern: The Market Fall and Recovery
🏁 1. The Start of the Trump Presidency (2017)
When Donald Trump was elected in 2016, the market responded with a combination of excitement and uncertainty. Initially, the market surged due to tax cut expectations, deregulation, and optimism about a business-friendly administration. But as Trump's presidency fully began in January 2017, concerns over trade wars and tariff policies began to dominate investor sentiment.
The market initially dipped after Trump began pursuing a protectionist trade agenda, especially with China.
As concerns about tariffs escalated, stock markets reacted negatively to potential trade wars.
💶 2. The Tariff Crisis of 2018
The first major example of the "Trump Pattern" emerged in 2018 when Trump began implementing tariffs, particularly on Chinese imports, and announced new tariffs on steel and aluminum. This caused major market disruptions.
The S&P 500 fell dramatically during this period, dropping by as much as 8.6% from its February peak in 2019.
Companies that relied heavily on international trade, like Apple, General Motors, and Ford, experienced significant stock price declines. In fact, Apple’s stock fell 9.5% on days when new tariffs were announced, as their costs for manufacturing overseas rose.
The uncertainty surrounding the global economy, combined with rising tariffs, created fears of a trade war, leading to sharp market declines.
📈 3. Market Recovery: FED Rate Cuts and Tax Cuts
Despite the tariff-induced volatility, the market didn’t stay down for long. After significant market falls, the Federal Reserve (FED) began implementing interest rate cuts to combat slowing economic growth. These actions helped stabilize the market and even fueled a rebound.
FED rate cuts made borrowing cheaper for consumers and businesses, stimulating economic activity and boosting investor confidence.
Additionally, tax cuts, a cornerstone of Trump’s economic policy, provided further support, particularly for corporations.
As a result, after the initial market drop in 2018 and early 2019, the market rebounded, continuing to climb as investors reacted positively to these fiscal and monetary policies.
🎯 The 2024 and 2025 "Trump Pattern" Emerges Again
Fast forward to 2024 and 2025, and we’re seeing echoes of the "Trump Pattern" once again. New tariffs, introduced in 2025, have reignited concerns about a trade war. These tariffs, particularly on Chinese imports, have once again caused market volatility.
The stock market has fallen in recent months due to concerns about these tariffs and the impact they might have on global trade. For example, when new tariffs were introduced in early 2025, the market saw a sharp sell-off, with the S&P 500 falling by over 1.8% in a single day.
Companies that rely on international trade, like Tesla and Ford, have seen their stock prices drop in response to concerns about increased production costs.
The broader market decline, much like in 2018, was driven by fears that tariffs could slow down the global economy and hurt corporate profits.
However, there is optimism that the same pattern will unfold, where the market eventually recovers after these initial drops.
⚠️ 4. FED Rate Cuts Again?
As inflation concerns persist, the Federal Reserve is likely to step in once again. Like previous cycles, we expect the FED to cut interest rates to stimulate the economy. This would be aimed at reducing borrowing costs, encouraging investment, and helping businesses weather the impact of higher tariffs and global uncertainty.
The FED’s actions are typically a key driver of market recovery in the "Trump Pattern." Investors have come to expect that a market downturn triggered by political or economic disruptions can be offset by the FED’s supportive monetary policies.
⚖️ Navigating the Trump Pattern: What Should Investors Do?
The "Trump Pattern" highlights that during periods of heightened uncertainty, especially due to trade policies like tariffs, the market will often experience short-term declines followed by long-term recovery. Here are a few strategies investors might want to consider:
Stay Diversified : During periods of volatility, having a diversified portfolio can help cushion against the risks posed by market swings.
Invest in Domestic Companies : Companies that rely less on international supply chains might fare better during periods of trade policy changes and tariff uncertainty.
Focus on Growth : Once the initial market decline subsides, look for sectors that stand to benefit from a recovering economy, such as tech or consumer discretionary stocks.
Look for Inflation Hedges : Given the potential for inflation, consider investments that tend to perform well during these times, such as real estate or commodities like gold.
📝 Conclusion: The Trump Pattern in Action
The "Trump Pattern" demonstrates how the market tends to react in cycles during the early months of each presidency. Typically, the market falls at the start due to the uncertainty surrounding Trump’s trade policies, particularly tariffs. However, after these initial drops, the market often rebounds thanks to FED rate cuts and other policies aimed at stimulating the economy.
Looking ahead to 2025, we're already seeing signs of this pattern in action as tariffs are back on the table and market volatility has followed. However, history suggests that patience might pay off. Once the FED steps in and cuts rates, a market rebound is likely, following the same trend we saw in 2017-2019.

Understanding Trump and future of US and BTCUnderstanding Trump
As investors, we constantly analyze news and charts to find opportunities to make money. But today, I want to take a step back and look at the bigger picture.
This is a story about Donald Trump. Predicting his future actions could be key to making profits in various markets. Lately, Trump may seem like a madman—Hunting down on illegal immigrants, imposing tariffs on countries, trying to befriend Russia, and being outright rude to other alliences. He even once demanded that Greenland be put up for sale.
Over the next few chapters, I’ll explain my idea about why Trump does what he does. You will realize he’s not as crazy as he seems. Hopefully, this will help us gain some foresight into the future and, in turn, make profitable investments.
Chapter 1 : The U.S. A Frog in a Boiling Pot
From Trump’s perspective, America today is like a frog sitting in a pot of water that’s about to boil. Not just lukewarm, but dangerously close to reaching a boiling point. Like a setting sun, the U.S. is slowly losing its position as the world's dominant superpower and is, in his eyes, on the verge of decline.
What we are feeling about US is more like this.
On the surface, it looks like things are going well.
Ordinary Americans seem to be doing fine, the stock market keeps hitting new highs, employment numbers are strong, and the U.S. military remains the most powerful in the world. There are no obvious signs that America is losing its status as the world’s leading power.
But Trump sees things differently.
In his view, if the U.S. continues on its current path, it will eventually lose its dominance to China and decline into a second-tier nation, much like Britain or Spain.
Why does he think that?
This perspective is likely influenced by books like Ray Dalio’s The Changing World Order and Paul Kennedy’s The Rise and Fall of the Great Powers.
These books analyze how once-great powers—such as Britain, the Roman Empire, and Spain—declined over time. They outline three key reasons why major powers historically collapse:
1 Excessive debt – Poor government management and uncontrolled money printing lead to inflation.
2 Overextension through war or expansion – Excessive military spending due to prolonged wars or imperial overreach.
3 Extreme wealth inequality and social conflict – Rising tensions and divisions among the population.
And I would add one more factor to this list.
4 Failure to adapt to new economic, social, and technological trends -
Trump believes that these factors are causing the U.S. to lose its status as the world's leading power.
In a few decades, he sees America becoming like Britain—reminiscing about its past glory—or like Russia—resource-rich but lacking real global influence.
So, will the U.S. really decline?
"The water in the pot is already getting hot. No one knows exactly when it will start boiling, but if these four factors continue fueling the fire, eventually, it will."

If Trump Coins Don’t Teach You About FOMO, Nothing WillThe fear of missing out, or FOMO, is a powerful emotion that can wreak havoc on your trading journey.
Whether you’re a seasoned trader or just starting out, the urge to jump into a trade because everyone else is doing it—or because you feel like you’re missing out on a golden opportunity—can lead to costly mistakes.
Take, for example, the recent frenzy around Trump Coins ( BINANCE:TRUMPUSDT and BINANCE:MELANIAUSDT.P ).
Many traders rushed in, driven by FOMO, only to watch the value plummet just hours after launch.
This is a stark reminder of how dangerous FOMO can be.
In this post, we’ll explore why FOMO is so dangerous, the hidden risks it poses, and how you can sidestep these pitfalls to become a more disciplined and successful trader. Let’s dive in and learn how to avoid becoming the next victim of impulsive, emotion-driven decisions.
The Dangers of FOMO in Trading
FOMO is more than just a fleeting feeling—it’s a mindset that can derail your trading strategy and lead to impulsive decisions. Here are the key dangers of trading with FOMO:
1. Impulsive Decisions: The Enemy of Rational Trading
Ever made a trade just because it “felt right”?
FOMO often pushes traders to act on impulse, much like grabbing a chocolate bar at the checkout—it’s tempting but not always wise. Impulsive trading can lead to poor decisions that don’t align with your trading plan. Instead of chasing trades, stick to your strategy and wait for high-probability opportunities.
2. The Emotional Rollercoaster: Stress & Anxiety
Missing a trade can trigger stress and anxiety, making you feel like you’ve missed the opportunity of a lifetime. But here’s the truth: trading success is built on thousands of trades, not just one. Keep your emotions in check and remind yourself that there will always be another opportunity.
3. Chasing the Market: A Fool’s Errand
Seeing a stock or cryptocurrency skyrocket can make you feel like you’re missing out on a party. But chasing the market is a dangerous game. Markets move in cycles, and patience is your greatest ally. Instead of trying to catch a rising star, focus on precision analysis and wait for the next high-probability trade.
4. Short-Term Focus: Losing Sight of Long-Term Goals
FOMO often pushes traders to focus on short-term gains, distracting them from their long-term goals. While it’s important to spot high-probability trades, missing one doesn’t mean the end of the world. Keep your eyes on the bigger picture and trust that more opportunities will come your way.
5. Following the Herd: The Danger of Sheep Behavior
Just because everyone else is jumping into a trade doesn’t mean you should too. Your job as a trader is to follow your own trading plan and strategy, not to mimic others. Trust your research, instincts, and analysis—don’t let the crowd dictate your decisions.
How to Overcome FOMO and Trade Like a Pro
Now that we’ve identified the dangers of FOMO, let’s talk about how you can overcome it and become a more disciplined trader:
1. Stick to Your Trading Plan
Your trading plan is your roadmap to success. It’s there to guide you, not to be ignored. Whether you’re feeling the pressure to act or tempted by a “hot tip,” always refer back to your plan. Discipline is key to avoiding impulsive decisions.
2. Research is Your Secret Weapon
Trading without research is like driving with your eyes closed—it’s a risky gamble. Take the time to analyze the markets, understand the “why” behind your trades, and make informed decisions. Research is your crystal ball in the trading world.
3. Protect Your Capital
Risk and money management are crucial to long-term success. Remember, your trading capital is your lifeline —don’t risk it all on a single trade.
4. Develop a Calm and Collected Mindset
Trading is as much a mental game as it is a financial one. High emotions can lead to rash decisions and costly mistakes. Practice staying calm and collected, even when the market feels chaotic. The market doesn’t care about your feelings, so don’t let them dictate your actions.
5. Break the Cycle of Bad Habits
Every time you give in to FOMO, you’re not just making a bad trade—you’re cultivating a bad habit. Break the cycle by maintaining a disciplined trading routine. Stick to your strategy, trust your analysis, and avoid taking trades just for the sake of it.
Final Words: There’s Always Another Trade
Trading with FOMO is like sailing in stormy seas—it’s risky, stressful, and often leads to nowhere good. But by understanding the dangers and implementing the strategies outlined above, you can navigate the markets with confidence and discipline.
Remember this mantra: There is always another and better trade on the way, and I don’t have to catch every single trade that presents itself.
Let’s recap the key takeaways:
Impulsive Decisions: Stick to your trading plan and avoid acting on impulse.
Research: Arm yourself with knowledge and make informed decisions.
Chasing the Market: Be patient and wait for high-probability opportunities.
Risk Management: Protect your capital and balance optimism with realism.
Emotional Control: Stay calm, collected, and focused on your long-term goals.
By overcoming FOMO, you’ll not only become a better trader but also enjoy a more stress-free and rewarding trading experience. So the next time you feel the fear of missing out, take a deep breath, trust your strategy, and remember—there’s always another trade.
Happy trading! 🚀📈
Mihai Iacob

"Battle-Ready: Outsmarting Giants in the Trading Arena" Traders: Soon, I’ll be sharing some deep, insightful data with you. Before I do, there’s something you need to understand. Sure, I could explain every intricate detail behind it, but here’s the thing—if I expose the core mechanics openly, smart money intruders could turn around and use that very knowledge against us. And then, what’s the point of sharing at all?
Many of you already have your own ways of predicting where prices might head. I don’t fault you for keeping your methods under wraps. In fact, I respect it. After all, smart money never broadcasts its next move. Never. Why? Because the moment they reveal their hand, the game is over. Trading, my friends, is not merely about following charts—it’s about survival. It’s a battle. It’s warrior trading.
Picture yourself as a gladiator, thrust into the heart of a grand arena, standing alone against towering giants. Perhaps today, you're still learning, still sharpening your blade. But as time goes on, with skill and relentless practice, you’ll grow stronger. Strong enough to take on the greatest of challenges. Now imagine the king of Rome himself—symbolizing the whales and dark pools—giving a signal to unleash his might upon you. Around you, the coliseum roars with the fury of the crowd, representing the institutions—hungry to see your defeat.
Yet, despite the odds, you don’t back down. You raise your weapon and fight with skill and precision. With each passing battle, you grow more cunning, more adept, until the day comes when you can stand toe-to-toe with the king of Rome himself. And when that day arrives, the very institutions that once sought to crush you will tremble.
The game changes when you gain mastery. No longer are you just another target for the giants to feast on. Instead, you become someone they fear. Someone who follows the king’s every move, not as prey, but as a rival—a fellow predator in the vast market wilderness.
Let this be a call to arms. Let this vision of you rising through the ranks, becoming an unstoppable force, serve as your motivation. It’s not about hoping for fortune—it’s about fighting for it, step by step, battle by battle. You may not start as the champion, but with time, grit, and relentless drive, you can become one.
So, when the king of Rome moves, you’ll be ready—not to be defeated, but to conquer.

Lessons from the Hawk Tuah Meme Coin SagaThe recent collapse of the Hawk Tuah meme coin offers several valuable lessons for crypto investors, particularly regarding the risks associated with celebrity-backed tokens and meme coins. Here's a comprehensive look at the event and its implications:
What Happened?
Haliey Welch, a viral internet personality known as the “Hawk Tuah Girl,” launched her cryptocurrency, HAWK, on the Solana blockchain. Initially, the token skyrocketed in value, reaching a market cap of nearly $490 million within hours. However, the excitement was short-lived as the coin's value plummeted by over 90% shortly after its peak, resulting in massive losses for investors.
Investigations revealed suspicious activity, including a small group of wallets controlling 80-90% of the token's supply. These entities quickly sold their holdings after the price surged, a tactic commonly referred to as a Rug- Pull .
Welch has faced accusations of orchestrating the scheme, although she denies any wrongdoing
Key Takeaways for Investors
1. Avoid Hype-Driven Investments
Meme coins often rely on hype rather than fundamentals. The initial surge in HAWK’s value was fueled by Welch’s popularity and aggressive promotion, which masked its lack of intrinsic value.
2. Beware of Celebrity Endorsements
Celebrities frequently endorse or launch crypto projects, but their involvement doesn't guarantee legitimacy. Past incidents with figures like Kim Kardashian and Floyd Mayweather highlight a recurring pattern of failed celebrity-endorsed tokens
3. Understand the Token’s Structure
The dominance of a few wallets in HAWK’s ecosystem made the token vulnerable to manipulation. Always investigate the tokenomics of a project , including the distribution and control of its supply.
Recognize the Signs of a Rug Pull
- Rapid price surges followed by sharp declines
- Concentrated ownership by insiders or “snipers”
- Lack of a clear use case or roadmap
- Exercise Caution with New Tokens
*Newly launched coins are highly volatile and prone to exploitation. In the case of HAWK, the lack of regulatory oversight compounded the risks
Lessons for Regulators
The Hawk Tuah incident underscores the need for stricter oversight of crypto markets, especially celebrity-backed projects. While decentralized finance (DeFi) promotes inclusivity, its openness can be exploited. Regulators like the SEC are already investigating such cases, which may lead to stricter rules on token launches and promotions
Conclusion
The collapse of the Hawk Tuah coin serves as a cautionary tale about the dangers of speculative investments in unregulated markets. While the allure of quick profits can be tempting, due diligence, skepticism of promotional tactics, and an understanding of market mechanics are crucial for navigating the crypto space.
Investors should remember: if something sounds too good to be true, it probably is . For long-term success in crypto, focus on projects with robust fundamentals, transparency, and proven utility.

HOW TO FIND 100X MEMECOIN???Hi i want to make this post as an educational content after 1 year from previous educational posts which i had.
i speak very usual that you can understand content well.
First you should consider this that maybe there are around 100 or 1000 or even 10000 Meme coins out there to be found.
But only 10 of them is valuable and can be next DOGE or SHIBA or PEPE or ....(comment below some valuable Meme which i didn't write).
1. First of all Meme should have a good story that after reeded buy audience they said i should buy some of this token for my children or my self long-term.
i will explain two good story for you as an example:
A. In May 2021, Shiba creator sent the rest to Ethereum co-founder Buterin, who burned 90% of them to increase their value and then donated the remaining 10%.
B. Or Doge Creator which started the token as a Joke and then Elon Mask supports over years.
conclusion: Meme coins are now for dreaming and need a good back story and people need to talk with each other about the funny story of it and boom 🚀.
so search for stories like these two examples or the other stories like we are loving dogs or cats so lets go and buy the meme token of it lol.
But that story wont work on every animal names so take care don't rush to every animal name token which usually are falling hard after some fake pump.
2. Second you need to find strong community now all meme coins have groups and chats before buying go join and see how they are preforming for month and then decide to invest.
3. Third check updates and ... which they had on their own token and see what are the future plans or listing and ....
4. Forth always check the major wallets of that Meme token here are some factors you should be afraid of it:
A. if the huge amount of token like 30% or 50% is in one wallet
B. if the huge amount of token like 70% or 80% is in the hand of one exchange: so it is usually a meme token created by that exchange and other exchange wont list it forever usually and also it created by that exchange with fake pump in green market days to sell you that token and one day it eventually fall hard i see in different exchanges deferent token like this with high fake volume on it but i can not name here and after 2-10 months they dump 70-80% fall and low volume and delisted.
conclusion: be afraid of tokens which huge amounts are in specific wallet because they are usually dangerous also remember they can easily create fake wallets and divide tokens to different wallets so best thing is to check major 20 wallets of that token and see if those wallets hold any other tokens and are really whales or it is fake wallets that all in that meme.
5. Fifth high liquidity: check the Meme token have high liquidity because one day soon or late you want to sell it.
Disclaimer: The content below this are not any more 100% Educational but it is another example i provide for better understanding.
This is the beginning of this 1300% pump we had on Luffyusdt:
why i open long on Luffyusdt meme?
i checked almost all of the things mentioned above.
the story was all right here we have first anime token since 2021 running and they make web3 site to bring anime lovers together and ....
i check the team behind that and i checked evert 0-25 main wallets of this token and see in that 25 wallets 10 of the was whale and 5 of them was exchanges and major wallet is Dead wallet which means they burn 45% of token until now.
this token soon would be 100X in my opinion because it has the potential.
this is my own view and it may be wrong because we are living in crypto market so do your own research always and jump check your major meme holding and hold only valuable one.
any questions or thoughts mentioned in the comments.
also Disclaimer : Trade based on your own experience and research and knowledge.

SPRO - A perfect example of fundamental investment Fundamental Investment Example:
A company like SPRO with Price / Book<1, Price/Sale<1, LT debt/ Equity <0.1 and so on . I must say that this can be a perfect investment opportunity for a fundamental investor….. I hope this helps you to learn.
This is for an educational purpose only.

Telegram Games==>Share your experiencesToday, I want to talk about Telegram programs or games that are added to their number daily, and share my experiences from these programs or games with you.
I would be happy if you share your opinion or experience with me.
First, the purpose of these programs/games is to introduce the project and their tokens to the users, and for this purpose, they give their own tokens to the users in the form of Airdrop.
Now, let's see what Airdrop means.
What is the Airdrop!?
An airdrop in crypto is when a project distributes free tokens or coins to users' wallets, often as a marketing strategy to promote the project or reward existing holders. Users may receive these tokens by holding a specific cryptocurrency or completing simple tasks.
First, I must say that what has been proven to me in the cryptocurrency market is that the crypto market has had seasons over the years, such as NFT, Metaverse, Memes, Defi, etc. This means that in these seasons, the tokens of each season have increased and received a good reception, and always the first ones in each season gave a good reception and profit to the users, and with the passage of time, their reception decreased, and then it was the turn of scam projects in It has been every season.
I gave these explanations to say that I think we are in the middle or end of Telegram's program/games season. The season began with the BINANCE:NOTUSDT was obtained by tapping to earn and introducing friends. In the Notcoin project, users received good profits.
After the BINANCE:NOTUSDT project, the Hamster game , which is supposed to be listed on September 26 in various exchanges (perhaps the price of each $HMSTR token is equal to $0.01 ), was well received by Telegram users. If the Hamster game is listed at a price of $0.01 in various exchanges, it will disappoint many users because there are few users who have more than 10,000 $HMSTR tokens, and it could be a sign of the end of the season of Telegram programs/games.
How many $HMSTR tokens did you get in Hamster!?
In the coming days, tokens of other games are going to be listed in different exchanges, for example, today the game Rocky Rabbit with GATEIO:RBTCUSDT token was listed in different exchanges, which disappointed all its users.
Now I decided to share my personal experiences with you from some of the trending Telegram games.
Catizen :
Catizen game with BINANCE:CATIUSDT token was listed on 2024 September 20 in various exchanges. Catizen game was the most famous game that was listed in different exchanges after Notcoin, although those who spent money in the game were awarded a good number of tokens, but those who played the game for more than 5 months were awarded a small number of OTC:CATI tokens. which brought the dissatisfaction of the users of this game.
In terms of entertainment, the Catizen game seemed to be boring and time-consuming.
--------------------------------------------------------------------------
Rocky Rabbit :
Rocky Rabbit game with OTC:RBTC token is listed in different exchanges today and according to the number of tokens given to users according to the time they spent in the game, it really disappointed its users.
In terms of the game space, the game is very time-consuming, the interesting point of this game was that you had to give 0.5 TON to the game to withdraw your tokens, otherwise 45% of your RBTC tokens would be burned and according to the number of tokens that Users are credited and the price of RBTC token, Rocky Rabbit game is like a scam project in my opinion.
--------------------------------------------------------------------------
MemeFi Coin :
Memefi Coin game, which is going to be listed in various exchanges on October 9, 2024.
The gameplay of Memefi Coin is so boring that you have to go through 15 levels. This game has also recently activated in-game payment and you can spend the work of someone who spent several months to go through different levels by paying 23 dollars in one day. I think this game is only looking for income in the last few days.
--------------------------------------------------------------------------
There are many games, and if I try to analyze them all for you, you might get tired; let's go to the conclusion.
My analysis of Telegram games is that with the listing of the Hamster game token, we are approaching the end of the season of Telegram games and these games are very weak in terms of entertainment and only take the time of the users and the main winners are the game creators because according to When you play, you will definitely have a low reception, so I advise you to only look at these games as entertainment, although in terms of entertainment, I think these games are of low quality.
And if the Telegram game token is listed, it is better to sell it immediately, because with the passage of time, the price of these tokens will decrease at least for a short period of time, because the users received free tokens and were waiting for the sale of these tokens for several months, and for sure, the selling pressure will be high.
Also, be careful of SCAM programs/games because surely SCAM games will increase as these games become a trend.
In my opinion, the best game that didn't take much time was BINANCE:DOGSUSDT , do you agree with me?
I would be happy to share your opinion and experiences about Telegram programs and games with me in the comments!?
Is there a Telegram game or program that you think has a good future!?
If you can analyze every game below this post like me, this post can be a source for these games.
Please do not forget the ✅' like '✅ button 🙏😊 & Share it with your friends; thanks
