OHLC Statistical Mapping + Average Range Levels-Manipulation from OHLC Statistical Mapping was my entry
SL was above 1/3AWR- and I targeted AWR-
Simple model
YM1!

Did you seriously miss this triangle!Well, I do.
The technical analysis has many methods that could be followed to make money. Sometimes emotionally you attract to one method than others and here is the problem. I tried several times to use Elliot waves solely even if traditional classical analysis such as chart patterns are very clear. This triangle of them.

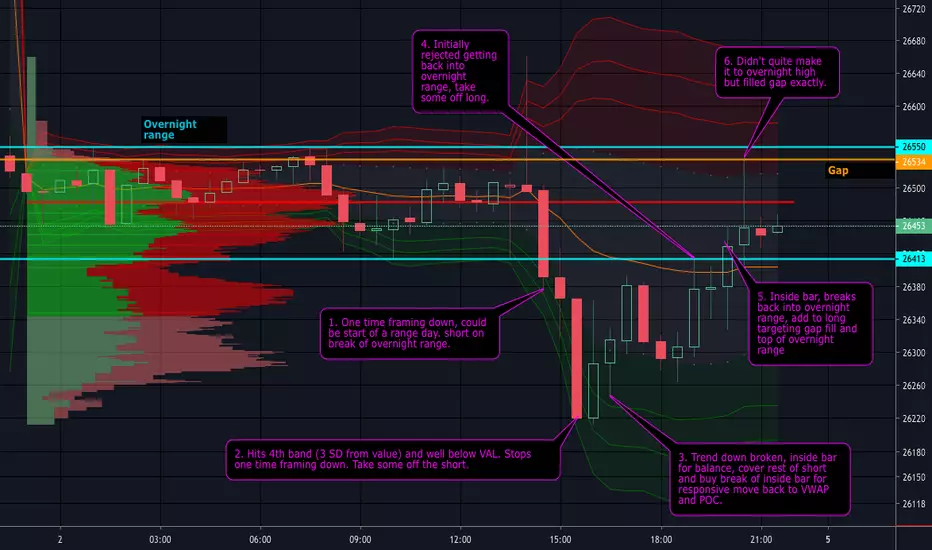
Day trading YM 2 Aug with volume profile + VWAPExplanation on the chart.
I use this along with ADD/TICK/UVOL-DVOL for internals to ensure i'm not going against the grain.
Other important reference points are previous days and weeks range.
VWAP, Volume profile and pivots combined for day tradingAs annotated on the chart, weekly pivots combined with volume profile and VWAP bands can give high % entries.
me
On responsive days, VWAP bands give accurate points of entry for a move back to the current VWAP or POC.
Be wise to the the of day that is developing, and use the appropriate strategy. For example on trend days do not play for responsive moves as you'll get run over. Neutral/balancing/normal days buy or sell out of value for a return to value using VWAP and pivots as a guide. Stops should be placed above or below pivots or the next VWAP band (2.5 or 3 SD).
For further accuracy use the bigger picture- market and volume profile of the last few days.

VWAP and volume profile combined with pivots for day tradingAs annotated on the chart, weekly pivots combined with volume profile and VWAP bands can give high % entries.
On responsive days, VWAP bands give accurate points of entry for a move back to the current VWAP or POC.
Be wise to the the of day that is developing, and use the appropriate strategy. For example on trend days do not play for responsive moves as you'll get run over. Neutral/balancing/normal days buy or sell out of value for a return to value using VWAP and pivots as a guide. Stops should be placed above or below pivots or the next VWAP band (2.5 or 3 SD).
For further accuracy use the bigger picture- market and volume profile of the last few days.

Why an early fail can actually HELP a breakoutThis is a great example for traders of all timeframes to study. I don't really have time for people basing trades on wide zones - that's fine for analysis, but for a TRADE, you've got to see the fight at a specific level. When you draw these correctly, you can get a really great picture of evolving sentiment and balance of power shifts.
Most traders treat breakouts way too lazily. You don't just enter at a new High/Low. You NEED buildup.
Any naked attack from distance is likely to fail. But what if it only pauses, instead of crashing?
Do you redraw the level? Do you avoid the trade completely?
What works for me:
Talk out the developing scenario. A fail failed? Ooh, interesting. Maybe there's more power on the original side than expected.
Once the breakout's happened, how is the other side thinking? I was biased long, getting everything I wanted to see....but what would the Bears want to see? Probably a close back under the grey/yellow boxes, right?
But wait, now that we created another temporary level during the failed probe, there's another level price needs to break through before even attempting the yellow level and then grey boxes!
--> this makes for a likely bounce point, and creates several chances for late entries. Best of all, it means a breakout entry at the original level will be protected by that bounce and your trade stays green.
