How Price Really Moves: 4 Entry Triggers Driven by LiquidityThis breakdown explains four recurring entry triggers that appear consistently across real market structure.
These are not indicators and not prediction tools. They are observable behaviors driven by liquidity, positioning, and trader psychology.
Each trigger is rooted in why price moves, not what price might do next.
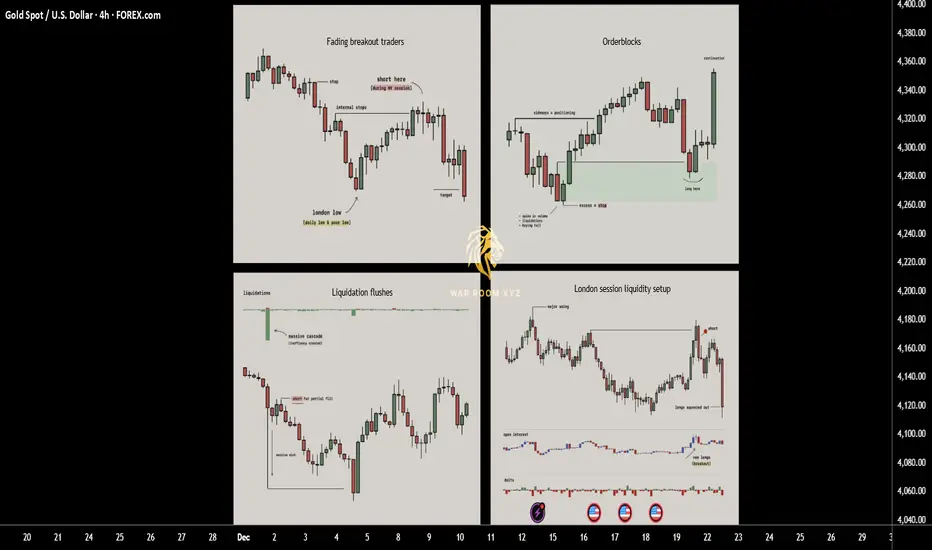
1. Fading breakout traders (Failed Momentum / Trap Model)
When price breaks a key level and open interest jumps, breakout traders rush in expecting continuation. If price quickly snaps back, those new traders become trapped and their exits fuel a move in the opposite direction. This creates one of the cleanest reversal triggers since you are trading directly against failed momentum.
► What usually happens
Markets frequently approach obvious highs, lows, or range boundaries where:
•Retail breakout traders anticipate continuation
•Algorithms and short-term momentum systems enter aggressively
•Open interest or volume often expands rapidly
At this moment, new positions are created late , directly into resistance or support.
► The key failure
If price:
•Breaks a key level
•Fails to hold acceptance beyond it
•Quickly closes back inside the prior range
Then the breakout has failed structurally.
This means:
•Buyers who entered above resistance are now trapped
•Sellers who entered below support are trapped
•Their exits (stops + panic closes) become fuel for the opposite move
► Why this works
Markets move efficiently when traders are positioned correctly.
They move violently when traders are positioned incorrectly.
A failed breakout converts hope-based positions into forced exits.
► Educational takeaway
You are not trading the level,
you are trading the failure of belief at the level.
This is why failed breakouts often produce:
•Fast reversals
•Clean directional candles
•Strong continuation after rejection
2. Liquidation flushes (Forced Exit & Rebalance Model)
Sharp liquidation events create long wicks and temporary price inefficiencies. Markets tend to rebalance after these shocks as liquidity returns, which is why these wicks often get filled quickly. This setup works well in volatile phases and near exhaustion points where forced selling or buying pushes price too far.
► What a liquidation flush is
A liquidation flush occurs when:
•Price moves aggressively in one direction
•Overleveraged positions are forcibly closed
•Stops and liquidations cascade simultaneously
This often creates:
•Long wicks
•One-sided impulsive candles
•Temporary price inefficiencies
Importantly, this move is not driven by new conviction, but by forced exits.
► What happens after
Once forced liquidations are complete:
•Selling or buying pressure rapidly decreases
•Liquidity returns to the market
•Price frequently retraces part or all of the wick
This retracement is not random
it is the market rebalancing after stress.
► Where flushes matter most
Liquidation flushes are most meaningful when they occur:
•Near prior highs/lows
•At range extremes
•After extended directional moves
•During high-volatility sessions
► Educational takeaway
A liquidation wick does not mean “strong trend”.
It often means the move is temporarily exhausted.
You are not trading momentum,
you are trading the absence of remaining pressure.
3. Orderblocks
Orderblocks are zones where previous heavy participation occurred, usually during sideways movements before a strong move away. When price revisits these levels, the same participants often defend the area, creating reliable reaction points. Clean pivots with no messy wicks are the strongest since they signal clear institutional activity.
► What an orderblock represents
Orderblocks are areas where:
•Large participants accumulated or distributed positions
•Price moved sideways briefly
•A strong directional move followed immediately after
This sideways phase exists because large players cannot enter all at once without moving price against themselves.
► Why orderblocks matter
•When price returns to these zones:
•Previous participants may still be active
•Unfilled orders may remain
•Defensive reactions are more likely than random continuation
Clean orderblocks typically show:
•Tight consolidation
•Minimal wicks
•Strong departure afterward
Messy structures often indicate mixed participation and weaker reactions.
► How orderblocks are used
Orderblocks are reaction zones , not signals.
They provide:
•Logical areas to expect interest
•Defined risk zones
•Context for entry triggers like wicks or failed breaks
► Educational takeaway
Orderblocks work because institutions remember their prices , even if retail traders forget them.
You are trading where participation previously mattered, not arbitrary support or resistance.
4. London session liquidity setup
London frequently sets the daily low or high early in the session. Later in the day price often returns to sweep internal liquidity around that level before continuing the trend. This repeatable behavior offers structured entries based on predictable liquidity grabs tied to session mechanics.
► Why London matters
The London session is:
•One of the highest liquidity windows globally
•Often responsible for setting the initial daily structure
•Heavily watched by institutions and algorithms
In many markets, London establishes:
•The daily high
•The daily low
Or a key internal liquidity level early in the session
► The repeatable behavior
Later in the day (often London continuation or New York):
•Price returns to that London high or low
•Sweeps internal liquidity around it
•Rejects after stops are collected
•Continues in the higher-timeframe direction
This is not coincidence,
it is session-based liquidity engineering.
► Why it works
Institutions prefer:
•Liquidity-rich entries
•Known pools of resting stops
•Session transitions for execution
London levels provide exactly that.
► Educational takeaway
Sessions are not just time zones,
they are liquidity cycles.
Understanding when liquidity is created is just as important as where.
How These Triggers Fit Together
These models are not standalone strategies.
They are contextual tools.
Very often:
•A London sweep causes a liquidation wick
•A failed breakout forms at an orderblock
•A liquidation flush completes a failed momentum move
The strongest setups occur when multiple triggers overlap , but each can stand alone as a learning framework.
Why These Triggers Work Long-Term
They work because they are based on:
• Trader positioning
• Forced behavior (stops, liquidations)
• Institutional execution constraints
• Repeating session mechanics
They do not rely on:
•Indicator crossovers
•Lagging calculations
•Pattern prediction
Price moves because someone is forced to act.
These triggers show where and why that happens.
These 4 triggers work because they exploit trapped traders, forced liquidations and consistent liquidity patterns rather than relying on indicators. Keep them simple, wait for clean context and let the setups come to you.
Note
These concepts are:
•Descriptive, not predictive
•Contextual, not mechanical
•Dependent on execution skill and risk management
The goal is not to trade more,
it is to wait for situations where the market gives you an advantage.
I have made a script which might help identify all 4 triggers.
Disclaimer
The script is provided for educational and informational purposes only.
It does not constitute financial advice, investment advice, or a recommendation to buy or sell any instrument.
The script does not execute trades, manage risk, or replace the need for trader discretion. Market behavior can change quickly, and past behavior detected by the script does not ensure similar future outcomes.
Users should test the script on demo or simulation environments before applying it to live markets and must maintain full responsibility for their own risk management, position sizing, and trade execution.
Trading involves risk, and losses can exceed deposits. By using the script, you acknowledge that you understand and accept all associated risks.
1-2-3-pattern
Gold – Bearish Retracement Toward Structural SupportGold is currently moving inside a broad rising wedge, and today’s structure adds more clarity to the short-term direction.
A smaller pennant formation developed inside the wedge and has now been broken to the downside — a signal that momentum is shifting and the market may be preparing for a corrective drop toward the wedge’s lower boundary.
The key downside target aligns with 4113 – 4127 , which overlaps:
The lower trendline of the main rising wedge
A previous demand zone
A natural symmetry completion of the pennant breakdown
As long as price stays below the 4208 invalidation level , the expectation remains for price to revisit the bottom of the wedge before any significant bullish continuation can be confirmed.
Watching the reaction at the lower wedge boundary will be crucial, as this area can determine whether gold resumes its larger bullish trend or fails structurally.

Will the Sky clear for higher Goldprice? Week 8-12 DecContext: After a quiet week with little impact from economic data, Gold FX_IDC:XAUUSD has been moving sideways within a triangle structure. The US economy looks resilient—better than many expected—shifting all eyes to the FED rate cut decision this Wednesday. 🇺🇸👀
📅 Market Recap:
Mon Dec 1 (Asia Session): Price pumped +$60 up to $4264, only to dump -$101 back down to $4163, sweeping liquidity in the beginning of the US Session. 🧹
Consolidation: Since then, Gold has consolidated in a narrow range between $4190 and $4226. ↔️
Friday: US Inflation data was less dramatic than feared, but Gold still dropped around -$64, closing the week near $4191.
🔥 The Week Ahead:
We have key dates coming up, but with the Rate Cut Decision pending on Wednesday, data needs to be dramatic to force a major move before then.
Quiet/Choppy markets until Wednesday. 💤
The Exception: Tuesday, when US Job Data is released. 📊
🎯 The Trade Setup:
If the US Job Market remains stable, there is room for further downside. I am watching for a dip to sweep liquidity before looking for entries.
📉 Downside Targets (Buy Zones):
Primary Target: $4150 🥇
Secondary Target: $4110 🥈
There is strong support between this zones, so it is very possible the drop stops right at $4150 without reaching the second target.
🐂 Strategy: I see the market chopping sideways until the announcement. My plan is to look for LONG positions 🚀 if price sweeps into my targets ($4150 / $4110).
My last idea about was not longer valid because the right shoulder did not went down, but a Quasimodo pattern could be a thing... Maybee FED does skip the cut? Let's see...
-------------------------------------------------------------------------
This is just my personal market idea and not financial advice! 📢 Trading gold and other financial instruments carries risks – only invest what you can afford to lose. Always do your own analysis, use solid risk management, and trade responsibly.
Good luck and safe trading! 🚀📊

Massive WALL STREET Short At All Time High Price is testing the all time high while a head and shoulders formation is visible on the Daily, indicating potential distribution at resistance
On H4, momentum is overbought and price has remained range bound for approximately four sessions, signaling reduced follow through on the upside
Sentiment appears fragile amid discussion of an AI driven excess, and risk appetite is moderating into strength
Harmonic confluence is present, with a deep crab on H1 and a crab on H4 aligning near current levels to define a potential reversal zone
Multi-timeframe momentum is stretched up to H4; bearish RSI divergence is present on H1 and H4, with H4 showing roughly a 15-point divergence while price holds flat
Repeated failures at the all-time high confirm supply; this level continues to cap advances and strengthens the resistance profile
The H1 trend has transitioned from flat to lower, shifting near-term bias to the downside within the broader range
Cross-market context is consistent, as major US indices are also near record highs and failing to extend, which adds intermarket confirmation
Risk parameters are defined with a stop above 48,250 or above the all-time high at 48,425, which would invalidate the reversal thesis
Initial downside objective is 47,300, corresponding to the next significant support and consistent with an H4 scale pullback
Position management should consider partial profit taking at interim supports and a reduction in risk if RSI resets higher without corresponding price weakness

When an Uptrend Breaks..Smart Money Doesn’t Hesitate📉 XAUUSD MARKET OUTLOOK (1H)
- Gold has officially transitioned from its previous rising channel into a clear downtrend structure, marked by lower highs, lower lows, and a decisive break below the rising support line. The bullish momentum has faded, and sellers are gradually taking control.
- Price is now moving inside a descending correction channel, and every rally is being absorbed by supply — a textbook shift from accumulation to distribution.
1️⃣ Uptrend Channel Has Been Broken
Gold traded for several days inside a rising channel, respecting both support and resistance.
But price has now:
- Broken below the rising trendline
- Retested it and failed
- Formed a new bearish structure
This confirms the end of the previous bullish phase.
2️⃣ Strong Resistance Zone Holding Firm
The resistance zone around 4,235 – 4,245 has rejected price multiple times.
Each rejection produced:
- Lower swing highs
- Increasing bearish pressure
- Momentum shift toward sellers
This zone is now the ceiling of the new downtrend.
3️⃣ Descending Channel Signals Bearish Continuation
- Price is currently moving cleanly inside a downward-sloping channel.
- Every bounce is shallow → every drop is sharp.
- This is the behavior of a market controlled by sellers.
If the current corrective bounce fails at the upper boundary of the channel, another hard leg down is highly likely.
4️⃣ Key Target: Strong Support Zone Below
The next major liquidity area lies at the 4,105 – 4,120 strong support zone.
This is where buyers previously stepped in aggressively.
If price reaches this zone again, expect:
- Either a strong bullish reaction
- Or a deeper breakdown if momentum remains heavy
➡️ Primary Scenario (High Probability)
Retest of the channel top → rejection → bearish continuation into 4,105 – 4,120 zone.
Sellers remain in control as long as price stays under the broken trendline.
⚠️ Risk Scenario
A clean breakout above the descending channel may trigger a temporary bullish correction, but the overall structure remains bearish unless price reclaims the old resistance zone.
What’s your take on gold’s trend shift?

Downfall of DXY?!? Bears Flag The Possibility!Here on TVC:DXY we can see that last week it ended in a Bearish Breakout of an Ascending Channel, the perfect Bear Flag scenario!
Now price closed the week on the ascent possibly being the Retest of the Breakout.
If the Channel holds price on a successful retest, TVC:DXY will drop!
Fundamentally, USD has impactful news all week this week. Even so, with limited data from back logged events not available until after next FOMC Meeting, this means the Federal Reserve will continue to make decisions in "the dark" and with a high probability of a Rate Cut coming in December!
If the Bear Flag is successful in being a continuation pattern set-up, we could see price drop down to the prior Low of November under 99!

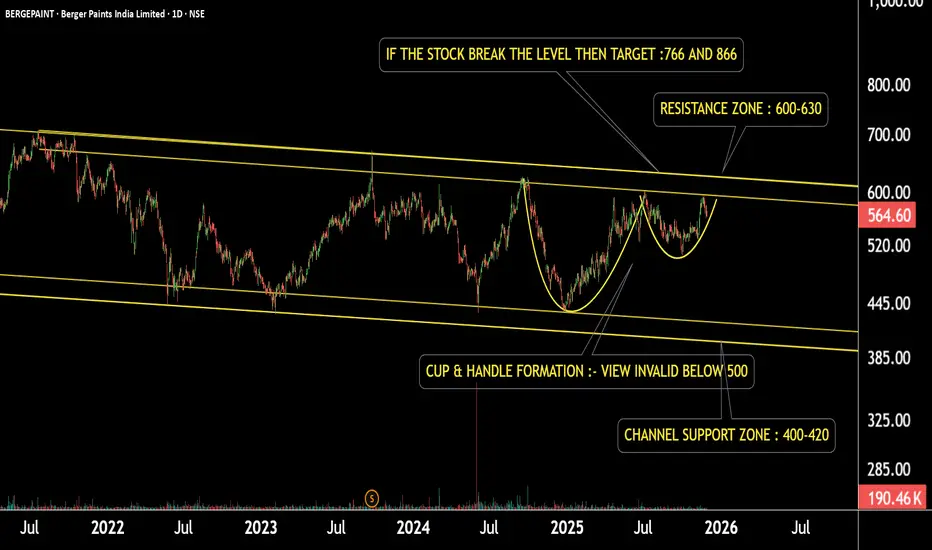
Berger Paints: Pattern Formation — Is This the BreakoutThis is the daily timeframe chart of Berger Paint.
The stock is moving within a well-defined channel and has formed a Cup & Handle pattern inside the structure.
If the pattern continues to hold and the price stays above ₹500, the pattern remains valid.
A breakout above the resistance may trigger potential upside targets of ₹766 and ₹866.
However, if the price fails and breaks below this zone, the stock may decline toward the channel support near ₹400.
Thank you.
Sun TV: Critical Levels Setting Up the Next MoveThis is the 1-hour timeframe chart of Sun TV.
The stock is forming a Descending Broadening Wedge pattern with a support zone near ₹515–525 and resistance around ₹565–575.
The trend is currently negative, but if the price breaks above the resistance zone, the stock may move toward the
pattern target near ₹620.
Thank you.

LULU Analysis | Crucial Support & Resistance Before EarningsIn this video, I break down a complete Lululemon (LULU) stock analysis ahead of its upcoming earnings.
You’ll learn the key support & resistance levels, expected volatility zones, and the technical signals that matter most.
🔍 What’s Inside the Video:
Lululemon’s current trend & momentum
Technical breakdown (chart pattern + volume + indicators)
Key support & resistance levels to watch
Earnings expectations & potential price reactions
Upside and downside targets
Risk zones and invalidation levels
Short-term and swing-trade ideas
📈 Why This Matters
LULU earnings often create huge price swings.
This video gives you a clear, actionable view of how the stock might react and what levels traders should focus on.

SPX500 Short
Deep crab pattern completes on M15, mapping a potential reversal zone.
Multiple tops formed on M15 and M30 at the same area, reinforcing overhead supply from the prior day’s high that price could not break.
RSI reached overbought on M15 and M30, indicating crowded long positioning.
Approximately 20 points of RSI bearish divergence across M15 and M30, consistent with a weakening advance.
H4 has turned down after last week’s rebound and now aligns with a downside continuation view.
Daily slope is flattening and price is trading beneath it, suggesting the early stages of a broader reversal can develop if sellers follow through.
Bias is short of the reversal zone identified by the deep crab and repeated tops.
Stop loss set at 50 pips to cap risk if resistance fails.
First target at 6,600, which is 100 pips from entry, with room to manage partials at nearby structure if momentum confirms.
Several US indices and other global indices are printing similar topping behavior and momentum fades, adding intermarket confluence to the short idea.

HK50 Long Setup at 25,875Crab pattern completes on M30 and H1, marking a potential reversal zone near current price.
Triple bottom visible on M30 and H1, reinforcing a well defined support shelf.
RSI is rising as the triple bottom forms, which supports the idea of accumulation rather than a weak bounce.
Daily trend remains up, so a rebound aligns with the higher time frame bias.
Timeframes up to H4 are oversold, which suggests short term selling pressure is stretched and vulnerable to mean reversion.
Stay alert to a possible regime shift toward bearish conditions. If market tone deteriorates, prioritise defense and faster exit.
RSI divergence of about 18 points on M30, indicating buyers are stepping in while downside momentum fades.
Look for a momentum confirmation trigger, for example, an M30 higher low or an H1 close above the most recent swing high.
Entry: 25,875 at or just above the reversal zone.
Stop loss: 25,650 to avoid crowding structure while cleanly invalidating the setup if broken.
First target: 26,475, which aligns with nearby resistance and a conservative mean reversion objective.
Secondary decision point: monitor price behavior as M15 and M30 approach overbought. If thrust is weak, scale partials and tighten risk.

EURJPY Forms Rare Reversal, Aiming For Price Gap??OANDA:EURJPY has formed a rare Reversal Pattern, the Three Drives Pattern, lets break it down!
The Three Drives Pattern consists of 3 Bullish attempts to continue pushing price higher. The 3rd attempt is a Fibonacci Extension of the DE Leg giving us Point F where Price, encountering Resistance at the 138.2% Extension @ 180.008, should reverse and head lower!
We can see starting the week that OANDA:EURJPY is opening below this level and if Price is unable to move higher, we can expect it to fall from here!
When it does, there is a big Price Gap in the 174.712 - 173.249 Range to fill with the Low or Point A being the next line of support @ 172.260 being the Price Target!
This could generate a great Short Opportunity!

Short Alphabet (GOOGL) near 290Head and shoulders is visible on H4 and on the Daily. I will look for a firm break and retest of the neckline to confirm a momentum shift.
An ABCD harmonic completed around 288, which marks a potential reversal zone based on measured move symmetry.
RSI shows a 40-point divergence on H1 and H4, from 82 down to 42. This indicates buyers are losing pressure while sellers gain control.
RSI is stretched across multiple intraday timeframes, consistent with mean reversion risk.
The primary Daily trend remains up. The H4 trend has flattened and started to roll, which supports a countertrend short setup.
Given the longer-term uptrend and elevated speculative sentiment, I will size conservatively and require price action confirmation.
Entry zone: around 290 at the ABCD completion area.
Stop loss: 305 to allow room for volatility without crowding the structure.
First target: 259, which aligns with prior demand and conservative mean reversion.
Risk-to-reward ratio: approximately 1 to 1.7.

EUR/USD Bearish Reversal SetupEUR/USD 1-hour chart shows a potential bearish move after a break of structure (BOS). Price is expected to decline from the 1.1529 resistance zone toward the 1.1510 target level.

JPN225 Long• Trend context: This setup aligns with the H4 uptrend, supported by a strong upward impulse.
• Momentum: M15, M30, and H1 are oversold, suggesting a potential rebound from current levels.
• Structure: A clear double bottom has formed on both M15 and M30, with RSI divergence of 9 points confirming bullish momentum.
• Support zone: Price is holding above strong support at the previous week’s high, a key level that continues to attract buyers.
• Pattern signal: A bullish shark pattern is forming, indicating strong reversal potential.
• Risk management: Stop loss placed below 50,700 to protect capital.
• Target: First target when M15 turns overbought or when price retests 52,600 highs.

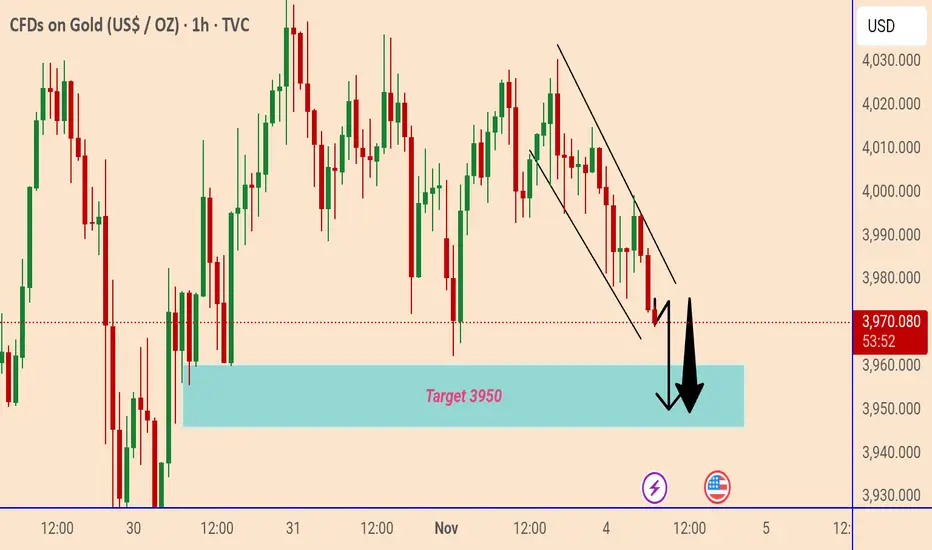
Gold Price Targets 3950 Support ZoneGold price is trading in a downward channel on the 1-hour chart, showing continued bearish momentum. The next key support and target area is around 3950 USD, where buyers may look for a potential reaction.
JPN225 ShortPattern structure: A bat pattern has completed on the M15 chart, highlighting a potential reversal zone.
• Market context: Price is testing the all-time high, an area that has historically acted as strong resistance.
• Trend alignment: While this setup moves counter to the H4 trend, recent consolidation has flattened the H1 moving average, suggesting momentum is fading.
• Momentum signal: RSI on H1 is showing significant bearish divergence with a clear triple top — a strong early signal of potential exhaustion.
• Risk management: Stop loss set at 300 pips to protect capital, with a target of 51,700.

GBPAUD Textbook Bear FlagGBPAUD price had been falling sharply, sellers were in full control, driving the market lower with strong bearish momentum.
Then came a pause. Price started climbing slowly, forming a rising channel. That’s the bear flag. Buyers are trying to recover, but it is weak and hesitant, every push higher is met with selling pressure.
Inside that flag, sellers are waiting for signs of exhaustion. And if price breaks below the structure strongly, that’s the confirmation we need.
I am expecting another impulsive leg down in the direction of the main trend, at around 1.9856.
With this kind of pattern, usually the stop-loss is placed just above the flag.
Keep in mind that this is just an idea, not a trade and not financial advice.

xauusd 3894 or 4060 today?October 29, 2025, XAU/USD has specific price targets. The gold price is currently around $4,018, and traders are focusing on key technical levels and the upcoming Federal Reserve interest rate decision.
Below is a summary of the key price levels to watch before the market closes today.
Analysis Type Key Resistance Key Support Primary Target Alternative Target
Technical & Scenario-Based $4,005.79 $3,951.68 $4,059.90 - $4,114.01 (if resistance breaks) $3,893.96 (if support breaks)
Bearish Correction - $3,940 $3,870 -
Range-Bound $4,010 $3,860 Movement between $3,860 and $4,010 -
🚨 Key Market Driver Today
The single most important event influencing gold's movement today is the Federal Reserve's interest rate decision. Markets are overwhelmingly expecting a 25-basis-point rate cut, and how the market reacts will depend heavily on the tone (dovish or hawkish) set by Fed Chair Jerome Powell.
Dovish Signal (Bullish for Gold): If the Fed signals openness to further easing, it could weaken the US Dollar and help push gold above the $4,005 resistance toward the higher targets.
Hawkish Signal (Bearish for Gold): If the Fed suggests this cut is a "one-and-done" move, it could strengthen the Dollar and trigger a sell-off in gold, pushing it down to test the $3,951 support and potentially lower.
💡 A Note for Your Trading
Conflicting Signals Exist: While one technical model suggests a potential rise to $4,010, another maintains a bearish outlook with a target of $3,870, contingent on the price staying below $3,940. This highlights the market's uncertainty ahead of the Fed news.
Trade the Reaction: Many analysts advise waiting for the price to convincingly break through one of the key levels ($4,005 resistance or $3,951 support) before committing to a new trade direction, rather than anticipating the move prematurely.
In summary, for the remainder of today's session, watch the $4,005 resistance and $3,951 support levels. The Fed's announcement will likely determine whether the price moves towards $4,060 or falls back to $3,894.

NASDAQ Short There is a lot of resistance, as it is at an all-time high and is unable to break this level
There are 2 patterns on M15 and M30 showing a potential reversal zone
This is against the H4 trend; however, it is overbought on H1
RSI is showing strong divergence with a triple top on H1
Stoploss above 21300
First target 24870 or when M15 is oversold

Potential Reversal Ready To Flip AU On Its "Head"Price on OANDA:AUDUSD is almost complete with forming the Right and final Shoulder of the potential Inverted Head and Shoulders Pattern!
Once Price has visited the Neckline of the Pattern, it will be Confirmed and will suggest that Price is looking to head higher!!
Once Confirmed, we will want to wait for a Valid Breakout and a Retest to generate potential Long Opportunities to take up to the next Resistance @ .6620!

Bitcoin Short This is overbought on M15, M30, and H1 showing strong divergence on RSI
There is a bat pattern on H1 displaying a potential reversal zone
Bitcoin is currently in a downtrend after the crash, making this a continuation
Stoploss above 112250
There is strong resistance from the previous weeks low

Got The GUTS For Stocks? Fractyl Health, Inc. Prints A Bull FlagNASDAQ:GUTS has printed a Bull Flag and with Price making a Retracement to the 50% Fibonacci Level @ $1.28, the Consolidation Phase of Price should be coming to and end!
This could mean its time to Buy Stock in Fractyl Health, Inc!
Once able to Breakout of the Descending Channel of the Flag, Price on Fractyl could keep pushing up!!
Currently the Analyst 1 Yr Price Target is set for $6.76, almost a 400% gain!
The company is also making great strides in weight loss study's and obesity gene therapy!
