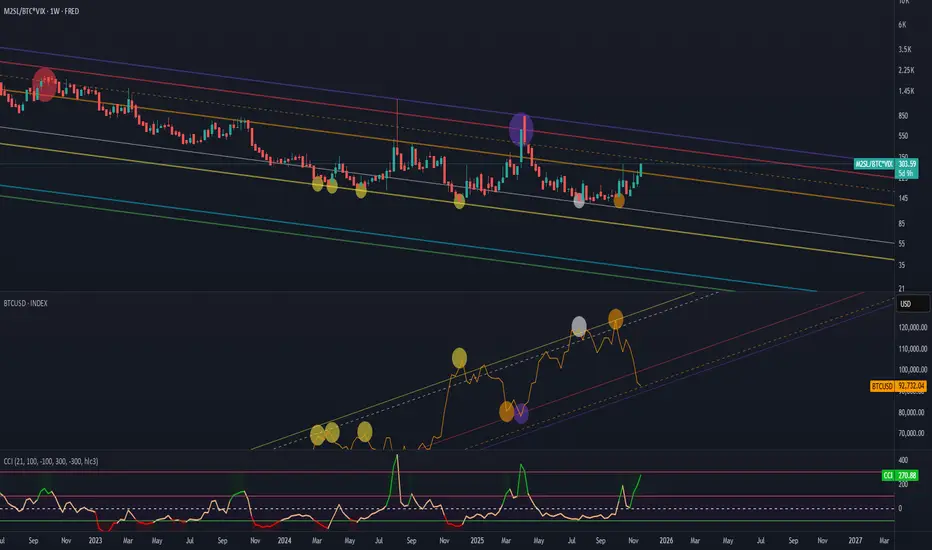
Liquidity (M2) to BTC.D, amplified by (VIX) FEARIt shows the ratio of global liquidity (M2) to Bitcoin’s market capitalization, amplified by market fear (VIX), relative to BTCUSD.
Thanks to this formula, we have an understanding of which phase of the market we are currently in.
In this case the CCI indicator shows:
overbought conditions — meaning money is outside the market and
oversold conditions — meaning there is too much money in the market and it’s time to sell
FRED:M2SL/CRYPTOCAP:BTC*TVC:VIX
For some reason the Bitcoin chart isn’t displaying with all the markings, so I’ll attach a screenshot below.
1-BTCUSD
#DJI - 1500 Point Move on Cards?Date: 13-11-2025
#DJI Current Price: $48,254.83
Pivot Point: $48,160.50 Support: $47,650.55 Resistance: $48,673.16
Upside Levels:
L1: $48,957.83 L2: $49,242.50 L3: $49,648.25 L4: $50,054.00
Downside Levels:
L1: $47,364.53 L2: $47,078.50 L3: $46,672.75 L4: $46,267.00
#Tradingview #DJI #NDX #NIFTY #BTC #GOLD

BTC - UPDATE - PERFECT!!! Every week I share my #Bitcoin outlook, & almost 9 times out of 10 it's literally a copy/paste of my view🔥
Here we are! $ 88,000 support ✅
Following my analysis, this is the biggest demand zone is in! 🎯
🟥Is the bear market starting?
🟩Or will a new ATH begin from this low?
Follow to not miss any weekly #BTC outlook!

BTC Downtrend With Short-Term Rebound TargetBTC is trading in a clear downtrend, breaking below the central level and approaching the support zone. A short-term corrective bounce toward 92,000 is highlighted, but overall structure still shows bearish pressure under major resistance and BOS levels.

BTCUSD selling pressure below 26,260The BTCUSD currency pair continues to display a bearish outlook, in line with the prevailing downward trend. Recent price action suggests a corrective pullback, potentially setting up for another move lower if resistance holds.
Key Level: 96,260
This zone, previously a consolidation area, now acts as a significant resistance level.
Bearish Scenario (rejection at 96,260):
A failed test and rejection at 96,260 would likely resume the bearish momentum.
Downside targets include:
89,580 – Initial support
88,060 – Intermediate support
85540 – Longer-term support level
Bullish Scenario (breakout above 96,260):
A confirmed breakout and daily close above 96,260 would invalidate the bearish setup.
In that case, potential upside resistance levels are:
98,780 – First resistance
101,065 – Further upside target
Conclusion
BTCUSD remains under bearish pressure, with the 96,260 level acting as a key inflection point. As long as price remains below this level, the bias favours further downside. Traders should watch for price confirmation around that level to assess the next move.
This communication is for informational purposes only and should not be viewed as any form of recommendation as to a particular course of action or as investment advice. It is not intended as an offer or solicitation for the purchase or sale of any financial instrument or as an official confirmation of any transaction. Opinions, estimates and assumptions expressed herein are made as of the date of this communication and are subject to change without notice. This communication has been prepared based upon information, including market prices, data and other information, believed to be reliable; however, Trade Nation does not warrant its completeness or accuracy. All market prices and market data contained in or attached to this communication are indicative and subject to change without notice.

LTC: Don’t FOMO, Wait for Confirmation$LTC/USDT is getting squeezed between the rising trendline and the overhead resistance zone. Price has tested this resistance multiple times before but failed to break through.
A potential upside move could develop if we finally see a clean close above the marked zone.
Until then, it’s best to stay patient, don’t FOMO, wait for a clear breakout pattern.
DYOR, NFA

Bitcoin: The Most Pristine Greater-Fool Machine Ever BuiltLet’s cut the bullshit.
Bitcoin generates zero cash flow to holders.
Not one satoshi in dividends, interest, yield, rent, or revenue share. Ever.
Your only path to profit is dumping your coins on someone who pays more than you did. Full stop.
The protocol itself produces zero economic productivity that accrues to BTC holders.
Every single transaction fee? Goes straight to miners.
Holding 1 BTC gives you exactly zero claim on future fees, block rewards, or anything else.
You are not a shareholder. You own a database entry in a game of digital musical chairs.
As of November 2025:
~61-70% of all Bitcoin has not moved on-chain in over 12 months (Glassnode, Chainalysis, Arkham — pick your poison, the story’s the same).
If Bitcoin were actually “money” or even a real payment rail, that dormancy number would be microscopic.
Instead, it screams one thing: pure HODL speculation praying for capital gains.
Real on-chain settled value (not CEX wash-trading volume) is running ~$8-16B per day depending on the source and day (Glassnode, CryptoQuant).
Market cap sits at ~$1.9 trillion right now.
That’s a daily turnover of roughly 0.5-0.8% of total cap.
Even boring Apple stock — a company with actual earnings, buybacks, and dividends — turns over more than that on most days.
Visa settles hundreds of times more real-world value every single day with a fraction of the energy waste.
Speaking of energy: Bitcoin currently guzzles 160-190 TWh annually (Cambridge, Digiconomist — Nov 2025 estimates).
That’s the entire electricity consumption of the Netherlands or Poland… to secure a ledger that moves <0.1% of global payment volume.
Every single major Bitcoin parabola required a brand-new cohort of buyers who had never touched BTC before:
2011-2013 → Cypherpunks + Silk Road degens
2016-2017 → Retail FOMO + ICO mania
2020-2021 → Institutions + MicroStrategy + PayPal + stimulus checks
2024-2025 → Spot ETFs + Trump “strategic reserve” hype + corporate treasury narrative
Each wave paid 5-10× higher prices so the previous bagholders could cash out or flex unrealized gains.
This isn’t “adoption.” This is textbook sequential recruitment of greater fools.
When fresh money slows? Bitcoin has never once failed to crash 75-85%+ from the top.
2011: -93%
2014: -86%
2018: -84%
2022: -77%
No exceptions. Ever.
You’ll say: “But it’s a scarce, neutral, global store of value the world needs!”
That’s the exact circular loop that defines every structurally Ponzi-like asset:
Price up → “See, great store of value!” → New money floods in → Price up → Repeat
Snap any link and the entire house of cards collapses to mining cost (or lower — remember every bear market?).
Gold? 5,000 years of monetary premium, industrial use, jewelry demand, central-bank reserves, no risk of a better chain obsoleting it.
USD? U.S. military, tax requirements, deepest bond market on Earth.
Bitcoin? A 2009 whitepaper and a prayer.
Everything else — “sound money,” “digital gold,” “unconfiscatable” — is just the latest narrative you tell yourself so you don’t have to face the raw economic structure.
It’s not fraud. It’s not a scam. It’s not even malicious.
It’s simply the most transparent, voluntary, pristine greater-fool wealth-transfer engine ever engineered.
Early entrants get life-changing wealth.
Late entrants hold the bag when the music stops.
And yes — I’ll be right here quoting this exact post when the next cycle drags in the next desperate cohort at 2-5× today’s price, telling them the same uncomfortable truth.
The structure never changes.
Only the story does.
Trade accordingly. Or don’t. Your bags.

Bitcoin RSI Oversold Again - Is Another bounce Coming?Bitcoin chart highlights a repeating pattern on Bitcoin’s daily timeframe: every time the RSI drops into oversold territory (below 30), it has historically marked a major local bottom followed by a strong recovery.
On the price chart above, each green arrow represents a previous swing low. On the RSI panel, the boxed areas show moments when RSI dipped below 30. Every one of these events has been followed by a noticeable rebound in Bitcoin’s price.
We are now seeing the same setup again. RSI has once again fallen into the oversold zone, aligning with another green arrow on the chart. If history repeats, we could see a similar recovery this time too, just as Bitcoin has done consistently over previous cycles.
Key Points
- Historically on the daily chart, whenever RSI dropped below 30, Bitcoin experienced a recovery soon after.
- The current RSI reading is tapping this same level again.
- This confluence suggests a potential bottoming zone and possible trend reversal.
- While not a guarantee, the pattern has been reliable across multiple past cycles.
Cheers
hexa

GOLD outcome!GOLD started moving up steadily and making higher highs and higher lows very smoothly.Could possible break all time Highs before New Years.

USDCAD back to falling?USDCAD waiting for retest from Break out of TrendLine for a continuing drop in the London session.

BTC 30% Pullback: Local Floor is inBTC now at "Golden Pocket" Retracement Level:
The fact that a 30% pullback is coinciding with a Golden Pocket Fib Retracement paired with the current Macro conditions makes Long BTC at this level an asymmetrical bet.
Math / structure of the move
0.618 is the golden ratio, and 0.786 is roughly its square root – both come directly from the Fibonacci sequence. A pullback into 61.8–78.6% is deep enough to shake out weak hands and run liquidity, but not so deep that it fully invalidates the prior impulse. That makes it a natural “last chance” zone for trend continuation.
Orderflow & crowd psychology
A lot of traders, bots, and educational content focus on 0.618 / 0.786 as “golden pocket / OTE” style zones, so limit orders, stop orders and algorithms cluster there. In crypto, where retail TA is everywhere, this becomes self-fulfilling: price often spikes into 0.618–0.786, sweeps stops, then reverses.
Sneak Peak of the HTF Indicator I am developing for the upcoming launch of Glitch Capital . A multi-timeframe breakout- and trend-following Indicator Suite I will be launching soon.
Here you can see the Glitch Sniper Algo firing the first Buy Signals since this latest pullback. This is a sneak peak of another Indicator from the Glitch Suite I will launch soon:
30% drawdowns are normal in Bitcoin bull markets, not rare “black swans.”
A near perfect 30% pullback from ATH during a Bull Market is a known Phenomena during Crypto Bull Markets
Here’s how it looks historically:
2013 bull market: At least two 30–40% corrections on the way up.
2015–2017 bull market: Study of this cycle shows “at least nine large drawdowns” with an average correction of about 37% from peak to trough. Community analysis of the 2017 leg alone often highlights ~6 separate ~30% dips between 2016–2017 before the final top.
2011–2021 overall: About 13 drawdowns of more than 30% across that decade (bull + bear), underlining how routine deep pullbacks are in BTC.
Glassnode / market analysts: Repeatedly describe 30–40% corrections as “typical” in BTC bull markets, i.e. part of a healthy uptrend rather than a trend-break by default.
If you compress that into a rule of thumb:
In a strong Bitcoin bull cycle you can easily see several pullbacks of ~30%+, roughly every few months. So when you see a ~30% dip in a confirmed bull market, historically it’s been common and often buyable, not an automatic end-of-cycle signal.

BTC market on fire, sharp dropBTC Daily Timeframe – Short Summary
BTC is forming a bearish 5-wave Elliott structure:
Wave (3) seems to have bottomed around 94,000.
Price is now expected to make a Wave (4) pullback toward 100,000–101,000 (major resistance).
After that, BTC is likely to drop again in Wave (5) toward the 80,000–82,000 zone (1.618 extension).
Technical signals:
BTC is below all EMAs (34/89/200) → trend still bearish.
200 EMA near 104,800 is strong resistance.
Key supports: 94k, then 80k.
Bias: Bearish while below 104k–105k.

btcIn order to touch the orange lines, he must first break the red box. If he cannot, lower numbers will become available. We are approaching an important date.

DeGRAM | BTCUSD is testing the $90k level📊 Technical Analysis
● BTC/USD is testing a major support cluster near 88–90K, where price aligns with the long-term dynamic support line formed from previous triangle and flag breakdowns.
● The new rejection wick at support and the descending channel structure suggest a potential medium-term rebound toward 95–97K if buyers defend this level.
💡 Fundamental Analysis
● Bitcoin sentiment stabilizes as ETF inflows resume and risk assets recover after easing US inflation expectations.
✨ Summary
Support: 88–90K. Rebound potential: 95–97K. Medium-term bullish scenario valid while holding the dynamic support.
-------------------
Share your opinion in the comments and support the idea with a like. Thanks for your support!

Potential BTCUSD RUsh to $155KPrice action has reached our anticipated support level of $89,000, a critical threshold we identified in our previous analysis.
Based on current technical structure, we are positioning for a potential rally toward $155,000 in the next 24weeks.
However, over the coming weeks, with our target window extending through January 26th.
Forward Outlook:
The manner in which price navigates to this level will be instrumental in shaping our 2025 outlook. We are monitoring two primary scenarios:
Bullish Case: A sustained move higher could establish new targets at $145,000
Bearish Case: Failure to maintain momentum may result in a retracement toward the $78,000-$65,000 range
We are intentionally keeping technical details concise to maintain clarity for our portfolio holders.
Further updates will be provided as market conditions develop.
Disciplined patience remains our guiding principle.
Ieios Capital

BTC: Careful out there.Bitcoin has lost it's momentum, also evident in GOLD/BTCUSD graph (meaning, gold has stole the show from btc). Lower Lows in this graph would mean bear market or a deeper correction Imo.
Other bad sign is SOXX/SPX lower highs, underperforming. Could be a sign for market top but lets see.

BTCUSD Long: Short-Term Correction Eyes $97,500 ResistanceHello traders! BTCUSD continues to trade within a well-defined descending channel, maintaining a broader bearish structure while forming a series of lower highs and lower lows. Throughout the move, the price has created multiple pivot points along both the upper and lower channel boundaries, confirming the strength of this trend. Inside the channel, Bitcoin developed two notable range phases, each reflecting temporary consolidation before continuing downward. A key formation on the chart is the Rounding Top Pattern, which developed near the mid-channel area. This structure signaled weakening bullish pressure and preceded a sharp decline back toward the channel’s lower boundary. After the breakdown, BTC attempted a small recovery, but price failed at the Supply Zone, creating a rejection that aligned with a bearish breakout confirmation.
Currently, the price is approaching the $97,500 short-term target, which sits close to the lower edge of the Supply Zone. This level has acted as a significant reaction area several times, and the market may retest it before deciding the next direction. As long as BTC trades within the descending channel, the broader trend remains bearish, but short-term corrective moves to the upside are possible due to the strong reaction from demand.
My scenario as long as BTCUSD holds above the Demand Zone ($94,000–$94,500) and shows continued strength, a corrective move toward $97,500 remains likely. This level represents the nearest resistance and aligns with previous supply reactions. A clean breakout above $97,500 would open the way for a deeper correction toward the channel’s mid-line or even the upper boundary. However, if price gets rejected at the supply zone again, sellers may regain control and attempt another push back toward the demand area. A confirmed break below the Demand Zone would invalidate the bullish recovery setup and could trigger continuation of the broader downtrend. For now, the structure supports short-term bullish correction, but overall trend remains bearish until the descending channel is broken. Manage your risk!

Bitcoin $BTC price analysis we need your vote !💥 Final “dip” of November?
💰 Will CRYPTOCAP:BTC drop to $91,600
to close that old GAP on the chart? 🤔
🟢 Bullish case: $100K holds → next rally begins.
🔴 Bearish case: gap fills near $91,600 → possible reversal after.
What do you think — final washout or just a pause before the next move?, vote at comments
______________
◆ Follow us ❤️ for daily crypto insights & updates!
🚀 Don’t miss out on important market moves
🧠 DYOR | This is not financial advice, just thinking out loud.

BTCUSD: Buyers Aiming for a Move Toward 99,000 ResistanceHello everyone, here is my breakdown of the current Bitcoin setup.
Market Analysis
BTCUSD has recently completed a strong downward phase inside a well-defined Downward Channel, where price continuously formed lower highs and lower lows. After reaching the Support Zone around $94,500–$95,200, buyers stepped in and created a fake breakout, followed by a quick recovery — a sign of weakening seller pressure. Following this rebound, Bitcoin formed an Inverse Head and Shoulders pattern, confirming a potential bullish reversal. Price has now broken above the Triangle Resistance Line, signaling the first structural shift from bearish to bullish.
Currently, BTCUSD is consolidating just above the $95,500–$96,000 support zone, which now acts as a retest area for the breakout. As long as BTC stays above the Triangle Support Line, bullish momentum remains intact, and the market structure favors further upward movement. The nearest target for buyers is the $99,000 Resistance Zone, which previously acted as a strong supply area. A successful breakout above $99,000 would confirm bullish continuation and open the way toward higher resistance levels. If price fails to hold above support, a short-term pullback toward the lower triangle boundary may occur before buyers try to regain control.
My Scenario & Strategy
I expect BTCUSD to maintain its bullish bias as long as price trades above the Triangle Support Line and the key support zone. Potential long entries remain valid on retests of the $95,500–$96,000 area, with a primary target at the $99,000 Resistance Zone (TP1).
A confirmed breakout above $99,000 would strengthen bullish momentum and open the next leg upward. However, a breakdown below the triangle structure may lead to a deeper correction toward $94,500. For now, sentiment remains bullish, and Bitcoin appears ready for a continued recovery within the new reversal structure.
That's the setup I'm tracking. Thank you for your attention, and always manage your risk.

BTC to fire up!Looking at the structure, it seems like selling is over and we are about to turn around. This is potential bottom for BTC.

Buying Bitcoin was a hunting planBitcoin is tired of all this meaningless upward movement.
People don't know it but it is a hunting tool
We will see a strong move in Bitcoin for more hunting

Bitcoin (BTCUSDT) – Short-Term Bearish StructureHi!
The chart shows BTC moving inside a descending channel, with consistent lower highs and lower lows confirming a controlled downtrend. Recent price action attempted to push back into the QML (Quasimodo Level) area, but the reaction there shows clear rejection, suggesting supply remains in control.
Price is now falling toward the lower boundary of the channel, where a short-term bounce is possible. However, unless BTC breaks above the QML zone and the descending trendline, the broader expectation remains bearish.
The projected path suggests:
A drop into the channel low,
A corrective pullback,
And then a continuation lower toward the next major support zone around 89,700 – 89,800.
Overall, momentum and structure both support a bearish continuation unless buyers manage to reclaim the supply zone above.

Bitcoin Can reach 93000 Bitcoin could reach the price level of $93,000 in the coming weeks.
There is a possibility that after breaking the midline of its long-term weekly channel, it may move up to the indicated FVG level to fill the remaining unfilled orders.
After that, it could start a new bullish rally aiming for the upper boundary of the channel.
This is purely an analysis and should not be considered as financial advice.
Buying or selling is at the trader’s own risk.
