Update to Dow Jones Industrials Time At Mode Back in 2015 I had published a chart with annual data for the Dow Jones Industrials. I will provide a link at the bottom.
The research for this patterning is something I did myself by hand using pencil and paper back in the 1980's. These patterns show up in all time frames.
There is plenty of room
About Dow Jones Industrial Average Index
Dow Jones* often refers to the Dow Jones Industrial Average, which was one of the first stock indices and is one of the most commonly referred to barometers of equity performance in the United States. The Dow Jones Industrial Average, not to be confused with the Dow Jones Transportation index (which was the first index), is often called, "the Dow" or "DJIA," and consists of thirty stocks which traditionally were industrial-based. But in recent years as the US economy has become more consumer-oriented, the index has seen a change in composition that no longer has much to do with direct industrial investment.

Are We There Yet?Our top trend line has been touched a few times and rejected now, three days of falls could be the catalyst of the top being in and the early beginnings of a major turn down.
Down days repeatedly see increased volume compared to light volume on up days...usually the market hold up until the Punch &

DJIA H4 | Potential bullish reversalDJIA (US30) is falling towards a swing-low support and could potentially bounce off this level to climb higher.
Buy entry is at 42,779.36 which is a swing-low support that aligns with the 38.2% Fibonacci retracement level.
Stop loss is at 42,320.30 which is a level that lies underneath an overlap

US30 In Clear Bullish MovementUS30 in a Clear Bullish Movement
After breaking out from the triangle pattern near 42,300, the bullish momentum for US30 continues to grow.
A very strong resistance area was observed near 42,600, which corresponded to the all-time high price.
After breaking through 42,600, the price continues to

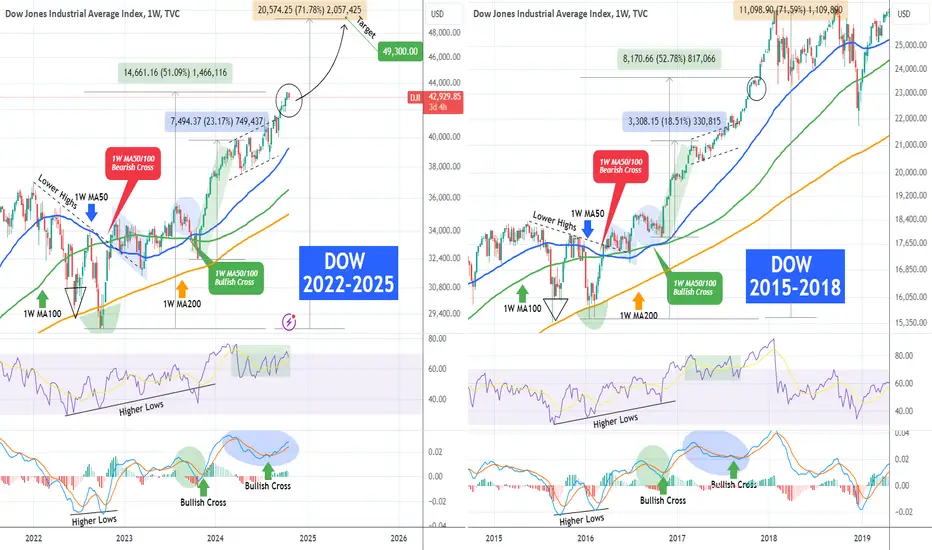
DOW JONES ahead of an huge rally based on the 2017 fractal.More than a year ago (September 13 2023, see chart below), we posted a long-term fractal comparison for Dow Jones (DJI) between the 2022 - 2025 and 2015 - 2018 periods:
As you can see the 1W MA50/100 Bullish Cross eventually placed the index on a huge rally (even though it had to go lower for a
US30 in a Clear Bullish MovementUS30 in a Clear Bullish Movement
After breaking out from the triangle pattern near 42,300, the bullish momentum for US30 continues to grow.
A very strong resistance area was observed near 42,600, which corresponded to the all-time high price.
After breaking through 42,600, the price continues

US30 In Clear Bullish Movement📣US30 in a Clear Bullish Movement
After breaking out from the triangle pattern near 42,300, the bullish momentum for US30 continues to grow.
A very strong resistance area was observed near 42,600, which corresponded to the all-time high price.
After breaking through 42,600, the price continues to


Us30 longUs30 overall momentum is bullish, BOS on H4, imbalance attempt to be refilled at discounted area. Fingers crossed when market opens...

DOW JONES (DJI) Slides Through TP1 & TP2! Eyes Set on TP3 & TP4!Technical Analysis:
On the 15-minute timeframe, the Dow Jones (DJI) short trade has already successfully hit TP1 and TP2, confirming strong downward momentum. Price continues to trade below the Risological dotted trendline, suggesting that the bearish trend is likely to continue.
Key Levels:

See all ideas
Displays a symbol's price movements over previous years to identify recurring trends.
Frequently Asked Questions
The current value of Dow Jones Industrial Average Index is 42,114.41 USD — it has fallen by −0.61% in the past 24 hours. Track the index more closely on the Dow Jones Industrial Average Index chart.
Dow Jones Industrial Average Index reached its highest quote on Oct 18, 2024 — 43,325.09 USD. See more data on the Dow Jones Industrial Average Index chart.
The lowest ever quote of Dow Jones Industrial Average Index is 28.48 USD. It was reached on Aug 8, 1896. See more data on the Dow Jones Industrial Average Index chart.
Dow Jones Industrial Average Index value has decreased by −2.48% in the past week, since last month it has shown a −0.29% decrease, and over the year it's increased by 27.55%. Keep track of all changes on the Dow Jones Industrial Average Index chart.
The top companies of Dow Jones Industrial Average Index are NASDAQ:AAPL, NASDAQ:MSFT, and NASDAQ:AMZN — they can boast market cap of 3.52 T USD, 3.18 T USD, and 1.97 T USD accordingly.
The highest-priced instruments on Dow Jones Industrial Average Index are NYSE:UNH, NYSE:GS, and NASDAQ:MSFT — they'll cost you 564.56 USD, 512.60 USD, and 428.15 USD accordingly.
The champion of Dow Jones Industrial Average Index is NYSE:AXP — it's gained 86.48% over the year.
The weakest component of Dow Jones Industrial Average Index is NASDAQ:INTC — it's lost −31.04% over the year.
Dow Jones Industrial Average Index is just a number that lets you track performance of the instruments comprising the index, so you can't invest in it directly. But you can buy Dow Jones Industrial Average Index futures or funds or invest in its components.
The Dow Jones Industrial Average Index is comprised of 30 instruments including NASDAQ:AAPL, NASDAQ:MSFT, NASDAQ:AMZN and others. See the full list of Dow Jones Industrial Average Index components to find more opportunities.