JPM as A Gauge For Bull Run
I consider JPM as a source of truth in this bull run for several reasons:
Post-Banking Crisis Fragility: Especially following the banking crisis in 2023, banks are more fragile, and money has consolidated in some bigger, safer banks.
Exposure to Various Crises: They have a lot of skin in the
Key facts today
Next report date
—
Report period
—
EPS estimate
—
Revenue estimate
—
17.96USD
49.26 BUSD
239.32 BUSD
2.86 B
About JP Morgan Chase
Sector
Industry
CEO
James Dimon
Website
Headquarters
New York
Employees (FY)
309.93 K
Founded
1968
FIGI
BBG000DMBXR2
JPMorgan Chase & Co is a financial holding company. It provides financial and investment banking services. The firm offers a range of investment banking products and services in all capital markets, including advising on corporate strategy and structure, capital raising in equity and debt markets, risk management, market making in cash securities and derivative instruments, and brokerage and research. It operates through the following segments: Consumer and Community Banking, Corporate and Investment Bank, Commercial Banking, and Asset and Wealth Management. The Consumer and Community Banking segment serves consumers and businesses through personal service at bank branches and through automated teller machine, online, mobile, and telephone banking. The Corporate and Investment Bank segment offers a suite of investment banking, market-making, prime brokerage, and treasury and securities products and services to a global client base of corporations, investors, financial institutions, government and municipal entities. The Commercial Banking segment delivers services to U.S. and its multinational clients, including corporations, municipalities, financial institutions, and non profit entities. It also provides financing to real estate investors and owners as well as financial solutions, including lending, treasury services, investment banking, and asset management. The Asset and Wealth Management segment provides asset and wealth management services. The company was founded in 1968 and is headquartered in New York, NY.

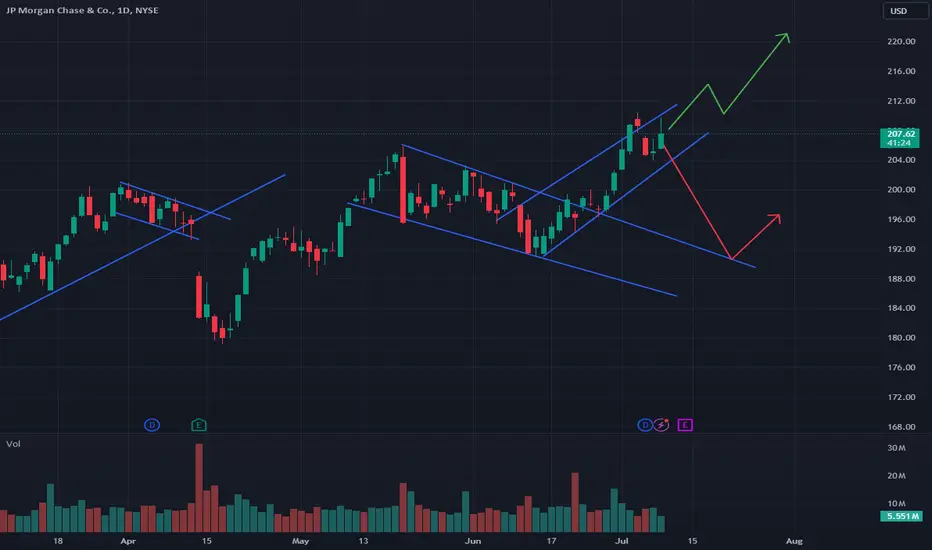
JPMorgan Broke Out. Now It’s Pulled BackJPMorgan Chase began July by breaking out to new highs, and now it’s pulled back.
The first pattern on today’s chart is the May 17 close of $204.79. The banking stock consolidated above that level through July 12. Has old resistance become new support?
Next is the price zone between roughly $208 a

JPM JPMorgan Chase & Co Options Ahead of EarningsIf you haven`t bought the dip on JPM:
Now analyzing the options chain and the chart patterns of JPM JPMorgan Chase & Co prior to the earnings report this week,
I would consider purchasing the 200usd strike price in the money in the money Calls with
an expiration date of 2025-1-17,
for a premium of

JP Morgan Surprises Investors with Strong EarningsOn Friday, JP Morgan surprised investors with a robust earnings release, posting an impressive +4.01% increase and a revenue surge of 20.78% above estimates. This positive news has ignited investor confidence and set the stage for a potential bullish trend.
Historically, JP Morgan's stock has shown

Buy JP Morgan ChaseShort Term Trading Advice by Naranj Capital
Buy JP Morgan Chase
● Buy Range- 209 - 212
● Target- 222 - 225
● StopLoss- 205
● Potential Return- 5-6%
● Duration- 14-15 Trading Days

JPMorgan Chase & CO.JPM needs to violate 199 to the upside, to trigger a rebound near 200.94 - 203.30 - 205.88. As 205.88 is considered the last major peak that needs to be violated, to confirm the major uptrend, with potential targets at 210 - 215- 217.35.
The stop-loss lies below 195.35, as a break below it, will c

JPM Time to Bank your profits ?JPM has has had a great run, tacking on 17% since the April low.
They report Friday of this week. Last Quarter they surprised to the upside.
Using a 4H Wolfe Wave analysis we appear to have peaked and could pause or head lower.
The fly in this ointment is that the 15 minute chart has a bullish Wo

JPM Warning
This is a project I had with absolutely no analysis in mind, so it never made it to this world where Picasso is not wanted and gibberish is dangerous. Just random dots splashed on the tradingview canvas while presumably being in the Nen Zone. Unfortunately, I have never seen anything like it in al

JPMorgan Potential Resistance Breakout At $210.60 11.07.2024- Technical Setup: A potential breakout above resistance at $210.60 within a 4-hour ascending triangle pattern.
- Upside Potential: If the breakout sustains, there is a significant probability for the price to advance towards $231.16. Further breach of $231.16 could lead to an extended move toward

JPM Paths Before EarningsA new earnings season is kicking off this week with a lot of banks reporting Friday. I doubt I'll trade any banks, but I think it's important to monitor. JPM looks bearish to me despite the recent breakout. It had a fakeout above its ascending wedge and is now threatening to break below which could
See all ideas
An aggregate view of professional's ratings.
Trade directly on the supercharts through our supported, fully-verified and user-reviewed brokers.


Curated watchlists where JPM is featured.


Frequently Asked Questions
The current price of JPM is 212.24 USD — it has increased by 1.71% in the past 24 hours. Watch JP Morgan Chase stock price performance more closely on the chart.
Depending on the exchange, the stock ticker may vary. For instance, on NYSE exchange JP Morgan Chase stocks are traded under the ticker JPM.
JPM stock has risen by 0.49% compared to the previous week, the month change is a 7.49% rise, over the last year JP Morgan Chase has showed a 34.52% increase.
We've gathered analysts' opinions on JP Morgan Chase future price: according to them, JPM price has a max estimate of 243.00 USD and a min estimate of 195.00 USD. Watch JPM chart and read a more detailed JP Morgan Chase stock forecast: see what analysts think of JP Morgan Chase and suggest that you do with its stocks.
JPM stock is 2.18% volatile and has beta coefficient of 0.83. Track JP Morgan Chase stock price on the chart and check out the list of the most volatile stocks — is JP Morgan Chase there?
Today JP Morgan Chase has the market capitalization of 599.23 B, it has decreased by 3.02% over the last week.
Yes, you can track JP Morgan Chase financials in yearly and quarterly reports right on TradingView.
JP Morgan Chase is going to release the next earnings report on Oct 11, 2024. Keep track of upcoming events with our Earnings Calendar.
JPM earnings for the last quarter are 6.12 USD per share, whereas the estimation was 5.88 USD resulting in a 4.01% surprise. The estimated earnings for the next quarter are 4.02 USD per share. See more details about JP Morgan Chase earnings.
JP Morgan Chase revenue for the last quarter amounts to 51.00 B USD, despite the estimated figure of 42.23 B USD. In the next quarter, revenue is expected to reach 41.57 B USD.
JPM net income for the last quarter is 18.04 B USD, while the quarter before that showed 13.34 B USD of net income which accounts for 35.21% change. Track more JP Morgan Chase financial stats to get the full picture.
Yes, JPM dividends are paid quarterly. The last dividend per share was 1.15 USD. As of today, Dividend Yield (TTM)% is 2.04%. Tracking JP Morgan Chase dividends might help you take more informed decisions.
JP Morgan Chase dividend yield was 2.41% in 2023, and payout ratio reached 25.27%. The year before the numbers were 2.98% and 33.10% correspondingly. See high-dividend stocks and find more opportunities for your portfolio.
As of Jul 27, 2024, the company has 309.93 K employees. See our rating of the largest employees — is JP Morgan Chase on this list?
Like other stocks, JPM shares are traded on stock exchanges, e.g. Nasdaq, Nyse, Euronext, and the easiest way to buy them is through an online stock broker. To do this, you need to open an account and follow a broker's procedures, then start trading. You can trade JP Morgan Chase stock right from TradingView charts — choose your broker and connect to your account.
Investing in stocks requires a comprehensive research: you should carefully study all the available data, e.g. company's financials, related news, and its technical analysis. So JP Morgan Chase technincal analysis shows the strong buy rating today, and its 1 week rating is buy. Since market conditions are prone to changes, it's worth looking a bit further into the future — according to the 1 month rating JP Morgan Chase stock shows the strong buy signal. See more of JP Morgan Chase technicals for a more comprehensive analysis.
If you're still not sure, try looking for inspiration in our curated watchlists.
If you're still not sure, try looking for inspiration in our curated watchlists.