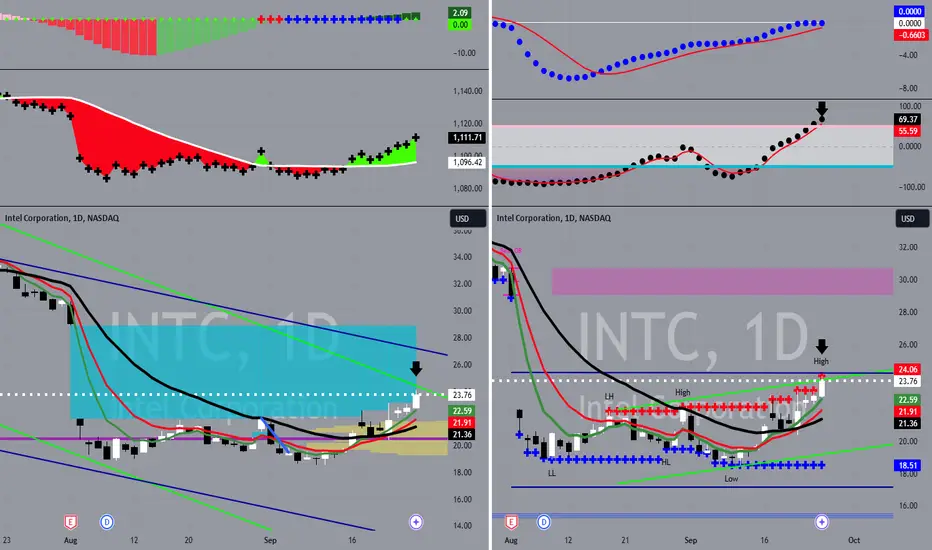
Short INTC from $23.81 to $20.50 or channel bottomMODs have suggested that I provide more detail about the picks I make.
Sorry. I'm not as verbose as y'all, and I don't like things to be complicated.
My trading plan is very simple.
I buy or sell at top & bottom of parallel channels.
I confirm when price hits Fibonacci levels.
Bonus if a TTM Sq
Key facts today
Next report date
—
Report period
—
EPS estimate
—
Revenue estimate
—
0.24USD
1.69 BUSD
54.23 BUSD
4.27 B
About Intel Corporation
Sector
Industry
CEO
Patrick P. Gelsinger
Website
Headquarters
Santa Clara
Founded
1968
FIGI
BBG000C0G1D1
Intel Corporation engages in the design, manufacture, and sale of computer products and technologies. It delivers computer, networking, data storage, and communications platforms. The firm operates through the following segments: Client Computing Group (CCG), Data Center Group (DCG), Internet of Things Group (IOTG), Non-Volatile Memory Solutions Group (NSG), Programmable Solutions (PSG), and All Other. The CCG segment consists of platforms designed for notebooks, 2-in-1 systems, desktops, tablets, phones, wireless and wired connectivity products, and mobile communication components. The DCG segment includes workload-optimized platforms and related products designed for enterprise, cloud, and communication infrastructure market. The IOTG segment offers compute solutions for targeted verticals and embedded applications for the retail, manufacturing, health care, energy, automotive, and government market segments. The NSG segment constitutes of NAND flash memory products primarily used in solid-state drives. The PSG segment contains programmable semiconductors and related products for a broad range of markets, including communications, data center, industrial, military, and automotive. The All Other segment consists of results from other non-reportable segment and corporate-related charges. The company was founded by Robert Norton Noyce and Gordon Earle Moore on July 18, 1968 and is headquartered in Santa Clara, CA.
Boring SidewardWe are sticking in a boring range. But the cloud is improving steadily.
I expect if not an outbreak so a test of the upper side of the range with little risk.

Intel in Trouble or Ready for Redemption?There is growing potential for QUALCOMM Incorporated to acquire Intel.
I now believe that this development has advanced enough to warrant a fresh look at the stock
Qualcomm recently approached Intel about a takeover. According to WSJ , Qualcomm has expressed interest in acquiring Intel, which, if

INTC REVERSAL ?INTC in reversal area for now, or we succeed or fail!
If you are in the trade you must make space for the SL, because it could not do immediate reversal (enter range then reverse).
I will keep watching of how it's going, generally talking it's looking good.
If you haven't bought it yet, I would su

Intel Stock Analysis: Potential Uptrend AheadIntel Stock Analysis: Potential Uptrend Ahead
Based on recent price action, Intel's stock has reached a significant historical support level, leading to a rebound. An uptrend may develop if the company continues to enhance its management practices and successfully transitions into the growing AI se

Long Time BottomWe must go back until 2010 to see the present bottom again.
After an almost 9 moth fall it is time for a bottom building.
This bottom is being built for over 1 month now and it is time to bet on an upward correction.

Is Intel getting ready to fill the gap?Technical Analysis Overview of Intel Corp (INTC):
Chart Overview
On the provided 45-minute chart, INTC appears to be in the midst of a larger Elliott Wave cycle. The labeling and wave structure indicate a strong corrective pattern, with potential for a new impulsive move higher. The key levels of s

INTEL Breakdown! Bearish Move Smashes First TargetIntel has shown a significant bearish movement on the Risological swing trader after the short entry at 23.36, with the price quickly moving towards the first profit target.
Key Levels
Entry: 23.36 – The short trade was initiated as the price broke below this level, confirming bearish sentim

Long INTC 22.18Look daily stoch heading up look 25 day pushing up thru 50 day
need more vol looking fill gap 29 daily higher lows
Look weekly stoch heading up

INTC likely to pumpAs intel searches for a catalyst to extend this initial pivot I believe earnings may provide this. With the stock recently trading as low as .6 price to book, I believe it remains undervalued. Remember there is a right price for any stock that makes money or is about to make money. My short term tar

See all ideas
An aggregate view of professional's ratings.
Displays a symbol's price movements over previous years to identify recurring trends.
Curated watchlists where INTC is featured.


Frequently Asked Questions
The current price of INTC is 22.68 USD — it has increased by 1.52% in the past 24 hours. Watch Intel Corporation stock price performance more closely on the chart.
Depending on the exchange, the stock ticker may vary. For instance, on NASDAQ exchange Intel Corporation stocks are traded under the ticker INTC.
INTC stock has risen by 0.31% compared to the previous week, the month change is a −0.53% fall, over the last year Intel Corporation has showed a −31.04% decrease.
We've gathered analysts' opinions on Intel Corporation future price: according to them, INTC price has a max estimate of 42.00 USD and a min estimate of 17.00 USD. Watch INTC chart and read a more detailed Intel Corporation stock forecast: see what analysts think of Intel Corporation and suggest that you do with its stocks.
INTC reached its all-time high on Aug 28, 2000 with the price of 75.81 USD, and its all-time low was 0.03 USD and was reached on Sep 17, 1974. View more price dynamics on INTC chart.
See other stocks reaching their highest and lowest prices.
See other stocks reaching their highest and lowest prices.
INTC stock is 4.46% volatile and has beta coefficient of 2.20. Track Intel Corporation stock price on the chart and check out the list of the most volatile stocks — is Intel Corporation there?
Today Intel Corporation has the market capitalization of 96.98 B, it has decreased by −2.86% over the last week.
Yes, you can track Intel Corporation financials in yearly and quarterly reports right on TradingView.
Intel Corporation is going to release the next earnings report on Oct 31, 2024. Keep track of upcoming events with our Earnings Calendar.
INTC earnings for the last quarter are 0.02 USD per share, whereas the estimation was 0.10 USD resulting in a −80.15% surprise. The estimated earnings for the next quarter are −0.02 USD per share. See more details about Intel Corporation earnings.
Intel Corporation revenue for the last quarter amounts to 12.83 B USD, despite the estimated figure of 12.92 B USD. In the next quarter, revenue is expected to reach 13.02 B USD.
INTC net income for the last quarter is −1.61 B USD, while the quarter before that showed −381.00 M USD of net income which accounts for −322.57% change. Track more Intel Corporation financial stats to get the full picture.
Yes, INTC dividends are paid quarterly. The last dividend per share was 0.13 USD. As of today, Dividend Yield (TTM)% is 2.20%. Tracking Intel Corporation dividends might help you take more informed decisions.
Intel Corporation dividend yield was 1.47% in 2023, and payout ratio reached 184.54%. The year before the numbers were 5.52% and 75.08% correspondingly. See high-dividend stocks and find more opportunities for your portfolio.
As of Oct 27, 2024, the company has 124.80 K employees. See our rating of the largest employees — is Intel Corporation on this list?
EBITDA measures a company's operating performance, its growth signifies an improvement in the efficiency of a company. Intel Corporation EBITDA is 10.59 B USD, and current EBITDA margin is 17.76%. See more stats in Intel Corporation financial statements.
Like other stocks, INTC shares are traded on stock exchanges, e.g. Nasdaq, Nyse, Euronext, and the easiest way to buy them is through an online stock broker. To do this, you need to open an account and follow a broker's procedures, then start trading. You can trade Intel Corporation stock right from TradingView charts — choose your broker and connect to your account.
Investing in stocks requires a comprehensive research: you should carefully study all the available data, e.g. company's financials, related news, and its technical analysis. So Intel Corporation technincal analysis shows the neutral today, and its 1 week rating is sell. Since market conditions are prone to changes, it's worth looking a bit further into the future — according to the 1 month rating Intel Corporation stock shows the sell signal. See more of Intel Corporation technicals for a more comprehensive analysis.
If you're still not sure, try looking for inspiration in our curated watchlists.
If you're still not sure, try looking for inspiration in our curated watchlists.