US Re-Opening - Price Will Guide Us (Key Technicals and Tickers)The US House of Reps vote to re-open the government. A simple majority is needed
and it's very possible that by Thursday, the longest shutdown in history can officially end.
Will the price action use this positively or negatively?
US Inflation data is due Thursday and Friday, but with the long shutdown, it's difficult
to trust the number's relevance if it prints. My third party inflation metrics have
been showing a steady uptick in inflation since August 2025
Market seasonality has been nearly non-existent in 2025 post Liberation Day lows,
so I'm watching price action closely to see if the bulls can maintain a stable melt-up
into year end and avoid a deeper correction than 3-4% like we observed Oct 10 and
early November
Key Watchlist Items
SPX, SPY, QQQ, DIA, IWM
Gold, Silver, BTC
US10Y
DXY, CHF, JPY overall strength or weakness
Never a dull moment - I'll be watching!!!
-Chris Pulver
1-BTCUSD

LONG ON BTC/USD (BITCOIN)Bitcoin has given us a retracement to the demand zone it created after it gave a change of character from down to up.
I expect bitcoin to rise to fill imbalance to the upside for about 15k-20k points.

BTC/USD 4H chart 🧭 1️⃣ Market structure
• We see a clear upward channel (black trend lines) - the price has been moving within it for several days/weeks.
• Current price: ~USD 101,630, which is just above the lower border of the channel (dynamic support).
• Latest high: ~$107,360 - this is local resistance.
• Final low: ~$99,000 - this is key psychological and technical support.
➡️ Medium-term trend: still upwards, but currently in a downward correction wave 📉 3️⃣ Technical indicators
🔸 Stochastic RSI (bottom panel)
• Both components (blue and orange lines) are close to the oversold zone (<20).
• This is a signal that sellers may be losing momentum, and a rebound from the lower support is possible in the coming hours.
⸻
⚖️ 4️⃣ Short-term scenarios (4H – 1D)
🟢 Bull scenario (probability around 60%)
• The rate remains above USD 101,400 (lower border of the channel).
• Stochastic RSI begins to rebound → buy signal.
• Potential move up to:
• USD 103,900 (first target)
• USD 105,900 (second target)
• USD 107,300 (main resistance)
➡️ Scenario invalidation: 4H candle close below USD 101,000.
⸻
🔴 Bear scenario (probability approx. 40%)
• Breakout of the USD 101,000 level with a 4H close below.
• Decline to $99,000-99,200 zone (major support).
• If this support breaks, next goals:
• $97,800
• $95,000
⸻
📊 5️⃣ Technical signal (4H)
➡️ Decision Zone: $101,000-$101,800
➡️ Technical signal: possible short-term rebound (RSI oversold, close to channel support).
➡️ Confirmation: 4H candle closing above USD 102,000 with volume - then a chance of a move to USD 104-106k.

50 week MA dont lieWe are at make or brake on bull market. As long as Bitcoin's price remains above the 50-week moving average, we generally maintain a long-term bullish bias. This indicator has historically defined major cycle lows, and holding above it suggests the uptrend is intact.

BTC is losing momentum
Price closed at $101,827, below both the 9 EMA ($104,098) and 9 SMA ($103,096).
The setup points to continued weakness:
Momentum Shift: BTC failed to hold above $104K, triggering sell pressure.
Fear in the Market: The Fear & Greed Index is at 26, signaling risk-off sentiment.
Liquidity Drop: Total crypto market cap fell to $3.41T, down over 2% in 24h.
Altcoin Season Score (29): Capital rotation is limited. Dominance is fading without new inflows.
Volume Divergence: Buying volume is declining while volatility remains high.
BTC remains in a broader uptrend, but short-term structure shows lower highs and weaker bounces.
If support at $100K breaks, the next demand zone sits around $96K–$98K.
Patience and capital preservation matter more here than chasing small bounces.

BTCUSD corrective pullback support at 100,780The BTCUSD remains in a neutral trend, with recent price action showing signs of an oversold rally within the broader range trading.
Support Zone: 100,780 – a key level from previous consolidation. Price is currently testing or approaching this level.
A bullish rebound from 100,780 would confirm ongoing upside momentum, with potential targets at:
107,152 – initial resistance
108,847 – psychological and structural level
110,900 – extended resistance on the longer-term chart
Bearish Scenario:
A confirmed break and daily close below 100,780 would weaken the bullish outlook and suggest deeper downside risk toward:
99,140 – minor support
97,800 – stronger support and potential demand zone
Outlook:
Bullish bias remains intact while the BTCUSD holds above 107,152 A sustained break below this level could shift momentum to the downside in the short term.
This communication is for informational purposes only and should not be viewed as any form of recommendation as to a particular course of action or as investment advice. It is not intended as an offer or solicitation for the purchase or sale of any financial instrument or as an official confirmation of any transaction. Opinions, estimates and assumptions expressed herein are made as of the date of this communication and are subject to change without notice. This communication has been prepared based upon information, including market prices, data and other information, believed to be reliable; however, Trade Nation does not warrant its completeness or accuracy. All market prices and market data contained in or attached to this communication are indicative and subject to change without notice.

$103,000 Support is Your Next Long Entry!The chart shows a Bearish Harmonic Pattern (D point completed near $107,000), indicating the recent bullish momentum needs a rest.
We anticipate a short-term pullback following the completion of this pattern.
The target for this drop is the key support area (green box) around $103,000 - $103,500.
OBV also shows Bearish Divergence (price up, indicator down), which strongly supports the idea of a temporary pullback.
Wait for the price to hit the $103,000 support zone.
Look to enter a LONG trade from the $103,000 - $103,500 area for the next major leg up. This is the main opportunity!
Good Luck!

BTCUSDT.P : positionHello friends
Given the decline we had, the price has now made a good floor and is supported, but it is still early for confirmation. We must let the resistance break and form a higher ceiling for us.
Everything is clear and transparent. If you have any questions, ask.
Don't forget risk and capital management.
*Trade safely with us*

BITCOIN TO $130,000 - $140,000Hello! It's me again!
My friends, it seems that BTC's price action is clearly indicating its trend and direction. Of the last five candles on the weekly chart, four have shown a very clear indication: there are buyers on the downside, it has remained above the 55-week moving average, and we've seen very strong support around $103,000.
It's also true that the uptrend on the weekly chart is already quite worn out. It has been quite long and has remained solid until now; however, this could be the bullish move that ends the trend.
At the moment, the technical analysis is simple and very clear: we are within the lower range of an upward move (I bought at $109,900 six weeks ago and I plan to hold since the movement is clear).
In conclusion, Bitcoin will be looking for the $130,000 range and, at most, $140,000. The final upward move is about to begin.
See you later! And remember, this isn't advice, it's just an opinion.

btc await breakout#BTCUSD stands between the third pattern rejection which still holds drops till 101800 to reverse back on buy. We buy when breakout on M15-30 closure above 105541.
Breakout on M15-30 closure at 105541 buy, target 107300, SL 104511.
Below the rectangle 104500 holds strong bearish which will drop till 101800 to form new buy range.

BTCUSD Long: Breakout From Descending Channel Targets $108KHello traders! Bitcoin is showing a potential continuation of bullish momentum after breaking out of the descending channel, where sellers had previously maintained control over the market structure. During the prolonged downtrend, the price consistently made lower highs and lower lows, until forming a strong Pivot Point near the $100,500–$101,000 Demand Zone — an area that has historically triggered solid bullish reactions.
Currently, after a fake breakout below this demand zone, the price quickly recovered, signaling liquidity sweeps and seller exhaustion. Since then, BTCUSD has rebounded strongly, confirming a structural shift from bearish to bullish control. The pair has now broken above the channel resistance, establishing a short-term bullish bias supported by steady higher lows. At the moment, Bitcoin is approaching the $107,500–$108,000 Supply Zone, which coincides with previous market consolidation and marks a potential reaction area where sellers might temporarily slow down the move. A clean breakout and close above $108,000 would open the door for a further rally toward the $111,000 Supply 2 Zone, reinforcing the medium-term bullish structure.
I expect the $104,500–$105,000 area to act as immediate support and a key retest level, allowing buyers to maintain momentum and target $108,000. Holding above this zone maintains the bullish scenario, while a confirmed break below it could trigger a pullback to the previous demand level before a new rally develops. Manage your risk!

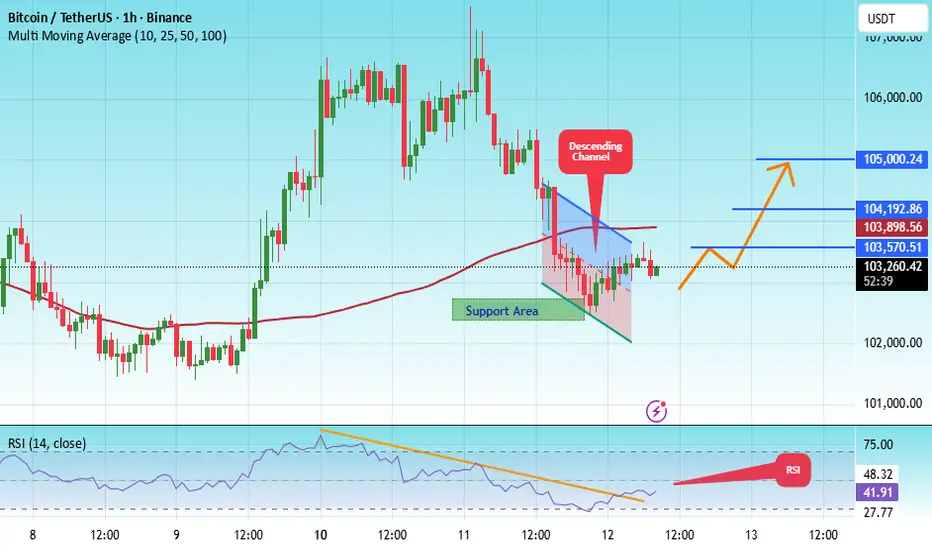
#BTC/USDT can give massive rally but breakout needed#BTC
The price is moving within an ascending channel on the 1-hour timeframe and is adhering to it well. It is poised to break out strongly and retest the channel.
We have a downtrend line on the RSI indicator that is about to break and retest, which supports the upward move.
There is a key support zone in green at 102474, representing a strong support point.
We have a trend to stabilize above the 100-period moving average.
Entry price: 103120
First target: 103570
Second target: 104190
Third target: 105000
Don't forget a simple money management rule:
Place your stop-loss order below the support zone in green.
Once the first target is reached, save some money and then change your stop-loss order to an entry order.
For any questions, please leave a comment.
Thank you.
BTCUSD H4 | Bearish Reaction off Key ResistanceMomentum: Bearish
Price is currently below the Ichimoku cloud.
Sell entry: 107,398
- Strong Pullback support
- 50% Fib retracement
- 161.8% Fib extension
Stop Loss: 111,400
- Swing high resistance
Take Profit: 99,896
- Multi-swing low support
Stratos Markets Limited (tradu.com/uk ):
CFDs are complex instruments and come with a high risk of losing money rapidly due to leverage. 68% of retail investor accounts lose money when trading CFDs with this provider. You should consider whether you understand how CFDs work and whether you can afford to take the high risk of losing your money.
Stratos Europe Ltd (tradu.com/eu ):
CFDs are complex instruments and come with a high risk of losing money rapidly due to leverage. 70% of retail investor accounts lose money when trading CFDs with this provider. You should consider whether you understand how CFDs work and whether you can afford to take the high risk of losing your money.

BTC MARKET UPDATEThe bears couldn't push the price below 16800 Support. The price bounced from the 16800 support due to the massive BUY ORDER BLOCK and moved above the 17000 key level. If we notice the daily timeframe then the price is under the consolidation box for a long time, any movement outside this box with a strong confirmation will be massive (whether upside or downside) Trade Carefully and Stay Tuned!

Bitcoin Price Hits Historical Recovery BarrierBitcoin’s price is currently at $103,922, struggling to overcome the downtrend active for nearly two and a half weeks. The cryptocurrency has failed twice to breach this resistance, reinforcing the strength of bearish market sentiment.
At present, Bitcoin trades below $105,000 but remains above the $101,477 support zone. This area is likely to form a consolidation base amid persistent volatility and cautious investor behavior.
If bullish momentum strengthens, Bitcoin could break past $105,000 and challenge resistance near $108,000. Successfully flipping this level would mark the first significant recovery since October, signaling renewed optimism across the broader crypto market.

BTCUSDT Chart Analysis.
BTC has bounced sharply off the green demand zone near $100,000, a historic level for bullish reversals.
Price action shows consolidation and then recovery, similar to previous cycle bottoms, with a projected move toward resistance at $123,000–$124,700 if momentum continues.
The current structure favors a bullish continuation, but strong confirmation above recent highs is needed for further upside.
DYOR | NFA

$BTC performing bullish falling wedge** CRYPTOCAP:BTC performing bullish falling wedge**
`A bullish falling wedge is a chart pattern in technical analysis that typically signals a potential upward trend reversal or a continuation of an uptrend after a period of consolidation. It is considered a reliable bullish signal.`
\

BTC Bitcoin Bullish Price Action Here's My Trade PlanBTC just broke to the upside! 💥 On the 🕓 4-hour timeframe, price action looks strong: higher highs and higher lows 📈⬆️. I’m waiting for a pullback 📉—once support is found 🛑 and structure breaks bullish again, I’m considering another buy opportunity 🚀💸.
Not financial advice.

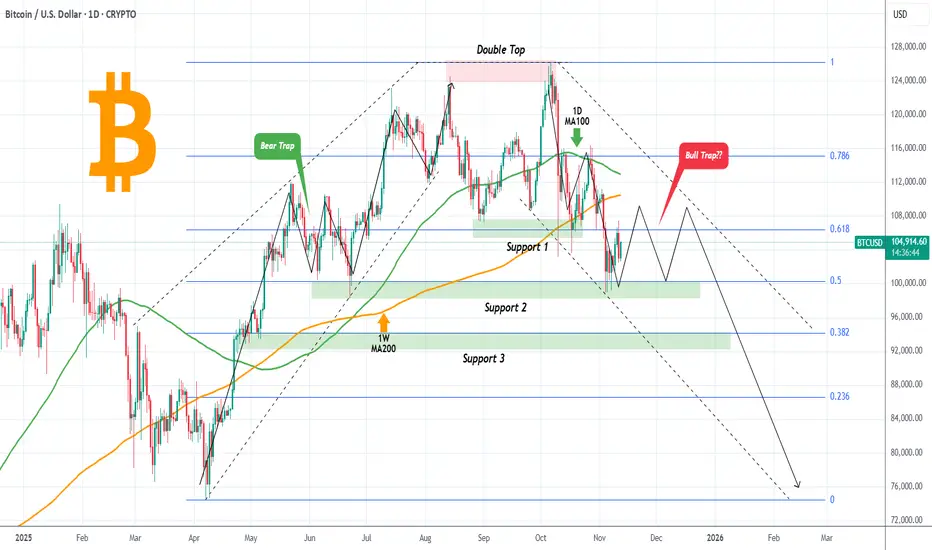
BITCOIN Is it following a symmetric downtrend?Bitcoin (BTCUSD) recently broke below the $100000 level for the first time since June and is currently on a short rebound. It has turned however all major MAs both the 1D MA100 (green trend-line) and 1D MA200 (orange trend-line) into Resistances, so the downtrend remains.
By doing so, we can see a highly symmetric pattern emerging, the inverse of the April - August uptrend. Following the (nearly) October 06 Double Top, the symmetrical downtrend has been testing and respecting all subsequent Support levels (so far Support 1 and 2), filling at the same time all Fibonacci gaps. See how accurately those Fibs formed key demand levels during the uptrend.
As a result, if this symmetry continues to hold, we can expect BTC to trade sideways for another month between Support 2 (Fib 0.5) and $110000 (roughly) before making the next leg down. Such price behavior typically confuses market participants and traps traders who stick to the former trend and haven't adapted yet.
Will it happen this time also and this potential ranged trading trap more buyers? Feel free to let us know in the comments section below!
---
** Please LIKE 👍, FOLLOW ✅, SHARE 🙌 and COMMENT ✍ if you enjoy this idea! Also share your ideas and charts in the comments section below! This is best way to keep it relevant, support us, keep the content here free and allow the idea to reach as many people as possible. **
---
💸💸💸💸💸💸
👇 👇 👇 👇 👇 👇
GBPCHFGBPCHF at a major SUPPORT zone. Getting some confirmation for reversal. Also looking for a Break of pattern.

Bullish bounce off?Bitcoin has bounced off the pivot, which aligns with the 61.8% Fibonacci retracement level, and could rise toward the 1st resistance, a pullback resistance level.
Pivot: 102,390.83
1st Support: 100,660.86
1st Resistance: 104,944.61
Disclaimer:
The opinions given above constitute general market commentary and do not constitute the opinion or advice of IC Markets or any form of personal or investment advice.
Any opinions, news, research, analyses, prices, other information, or links to third-party sites contained on this website are provided on an "as-is" basis, are intended to be informative only, and are not advice, a recommendation, research, a record of our trading prices, an offer of, or solicitation for, a transaction in any financial instrument and thus should not be treated as such. The information provided does not involve any specific investment objectives, financial situation, or needs of any specific person who may receive it. Please be aware that past performance is not a reliable indicator of future performance and/or results. Past performance or forward-looking scenarios based upon the reasonable beliefs of the third-party provider are not a guarantee of future performance. Actual results may differ materially from those anticipated in forward-looking or past performance statements. IC Markets makes no representation or warranty and assumes no liability as to the accuracy or completeness of the information provided, nor any loss arising from any investment based on a recommendation, forecast, or any information supplied by any third party.

Bitcoin 100k scenarioA scenario where it gets to 100k by end of year. Just saving this up there))
needs to be led by the important moving averages (50ma, 200ma...). lets go!

Bitcoin Rebounds — channel breakout signals!Have a good day, Traders! It's Leo. Let's look at the current BTCUSDT chart
Valid Support Zone: 98,000 – 102,000 — Price has formed a clear double-bottom structure here.
Breakout confirmation: Price has broken above the descending channel and both EMA20/50.
Next resistance / target: 115,000 — previous supply area aligning with major liquidity.
→ Short-term structure favors a bullish continuation as long as support holds.
Despite short-term volatility, Bitcoin remains supported by improving risk sentiment as U.S. yields retreat and Fed officials hint at a potential policy pause.
Scenario: A successful retest of the breakout zone could trigger momentum toward the 115K resistance. Holding above 102K keeps the bullish structure intact.
Bulls seem to be regaining control — will this momentum extend toward 115K? What’s your outlook for BTC this week?
