We are NOT finished.Weekly close has come in and, as expected, BTC has closed above the band once again.
Since the start of this cycle, Bitcoin has had the following pullbacks:
September 2023: 21%
August 2024: 34%
April 2025: 33%
November 2025: 21%
Tell me, people—what has changed? Has Bitcoin done anything different from what it’s been doing all cycle?
NO!
Yet 95% of sentiment is extremely bearish. The other 5% who aren’t bearish are patting themselves on the back because they “called the top”—you know, the same “top” everyone is staring at, the same top that can be calculated using basic math from the last two cycles.
Since I joined this space, I have NEVER seen sentiment this bad after only a 20% pullback. Complete madness. The only time I saw emotion this raw was during the COVID crash.
This level of bearish sentiment is what you find at the BOTTOM of rallies, not the top.
The idea that the top is in just because of “cycle length” is invalid—especially when EVERYONE is thinking the exact same thing. It’s never that easy with Bitcoin.
Mark my words: it WILL rally above 200k in 2026, and everyone who sold this year will be buying back in higher. That’s the nature of these markets.
Every cycle, you have to stay grounded, stick to the technical data, and ignore all the noise.
The technical are still holding strong—we are NOT finished!
1-BTCUSD

BTCUSD: Bulls Eye Recovery Toward $104K Resistance ZoneHello everyone, here is my breakdown of the current Bitcoin setup.
Market Analysis
BTCUSD is currently showing signs of a potential bullish recovery after bouncing from the key $100,600–$101,200 Support Zone, which aligns with the Wedge Support Line on the chart. This area has acted as a Buyer Zone multiple times in the past, with each test triggering strong upward reactions. The recent fake breakouts below support suggest liquidity sweeps and show that sellers have been unable to sustain momentum to the downside.
Currently, price was moving within a falling wedge structure, reflecting a controlled corrective decline. Throughout this move, several fake breakouts occurred along both boundaries of the wedge, indicating seller exhaustion and possible accumulation by larger buyers. After touching the Support Zone again, BTCUSD formed a bullish reaction, signaling a shift from selling pressure to buying interest. BTCUSD is now approaching the $103,500–$105,000 Resistance Zone, which previously acted as a strong supply level where corrective upswings were rejected. This zone also aligns with the Wedge Resistance Line, making it a key decision area for the next directional move. If buyers can sustain momentum above support, the market may set up for a continued bullish recovery.
My Scenario & Strategy
As long as BTCUSD holds above the $100,600–$101,200 Support Zone, the bullish recovery outlook remains intact. I expect price to continue moving gradually higher toward the $103,500–$105,000 Resistance Zone as the next key target. A confirmed breakout above $105,000 and sustained holding would signal a shift in structure, potentially opening the path toward $110,000 in the medium term.
However, if price breaks back below the Support Zone, the bullish setup becomes invalid and BTCUSD may revisit deeper support levels before any new recovery attempt develops. For now, structure favors bullish continuation, and pullback-based long entries remain the most favorable approach while support holds.
That's the setup I'm tracking. Thank you for your attention, and always manage your risk.

Bitcoin: Testing $100K after another pullbackBitcoin slipped back toward the $100K range this week, largely driven by a broader pull-back in risk assets and concerns over tightening monetary policy. A hawkish tone from the Federal Reserve and soft macro-economic signals weighed on sentiment, reducing near term upside momentum. On the other hand, underlying on chain and structural fundamentals remain sound: spot BTC-ETF inflows are still net positive, on exchange supply is staying low, and there are emerging analysts who now argue that Bitcoin is under-priced given its fundamentals. Certainly long term holders and followers of BTC and the crypto market know very well that historically, the crypto market had several strong shifts both toward the up- and downside.
BTC continued with its corrective move during the previous week. The price dropped below the $107K reaching its lowest weekly level at $99.180. BTC is closing the week around $101K. With the latest drop, RSI reached the level of 34, however, a clear oversold market side has not been reached. The indicator is closing the week at 36. The MA50 is now strongly converging toward the MA200, decreasing the distance between lines, indicating that potential cross might occur in the short future period.
Last week BTC returned to the levels from the start of this year, which could be treated as the current most significant supporting level for BTC. For the moment, there is a high probability that the market will spend some time testing these levels, before the next stronger move. In this sense, the $100K remains a supporting level, while the move toward the upside might lead BTC toward the $103K, with lower probability of $105K.

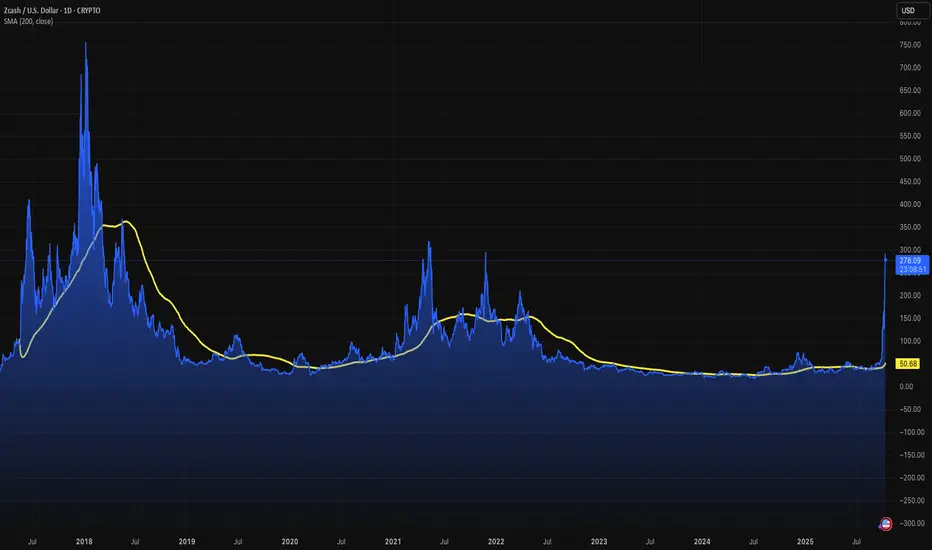
Zcash: Privacy at the edge of the next crypto cycleCrypto isn’t new anymore. We’re past the toddler years. Total crypto market cap has surged past $3 trillion again, and maturity is following price. Each cycle brings innovation. The next one will be about infrastructure, scalability, compliance, privacy.
Zcash fits that last bucket. We must saw from the outset that crypto is different to other asset classes in that it is very much sentiment driven. The network grows and becomes self-fulfilling.
It's a sentiment asset class, based on utility, confidence, and durability. Liquidity drives interest, interest builds trust, trust scales networks.
Zero-knowledge proofs aren’t theory, they’re live. Zcash lets you send fully encrypted transactions. No blockchain breadcrumb trail. That’s a big deal in a world that’s getting more watched.
Regulators are moving. The EU’s MiCA framework is here. The US Treasury wants more visibility over crypto flows. Even stablecoins are facing surveillance. But there’s a line, privacy isn’t crime. Legitimate financial privacy will be demanded by users who value security, not secrecy.
Zcash is one of the few projects positioned for this. Its tech is peer-reviewed, its encryption is compelling. As crypto grows, so will scrutiny. And with that, demand for tools that offer privacy without leaving the system.
With a market cap of $3.8 billion, Zcash is a fraction of Bitcoin’s $1.2 trillion or Ethereum’s $450 billion (as of October 2025). Yet, it outshines competitors like Monero, whose $3.2 billion market cap lags despite similar privacy goals, thanks to Zcash’s superior zero-knowledge tech and transparent framework that regulators can trust.
While privacy coins face scrutiny, Monero was delisted from major exchanges like Binance in 2024, Zcash’s design mitigates these risks, balancing user privacy with regulatory accountability.
Add to your watch list and accept this will have a lot of volatility in the coming months.
The forecasts provided herein are intended for informational purposes only and should not be construed as guarantees of future performance. This is an example only to enhance a consumer's understanding of the strategy being described above and is not to be taken as Blueberry Markets providing personal advice.
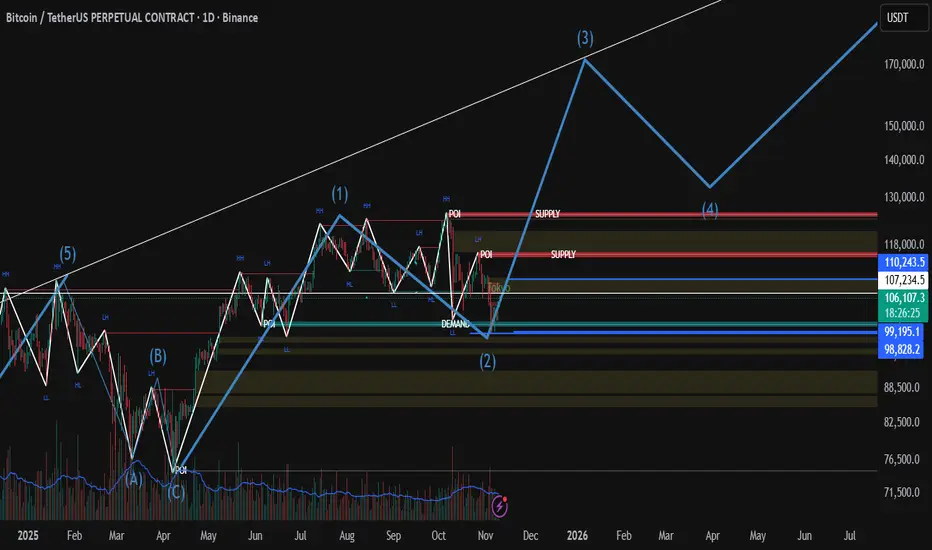
BTC can follow this Elliot Wave TrajectoryBTC can follow this Elliott Wave trajectory. However, it's not confirmed, as we have to analyse market conditions at each wave's dip. And November is expected to be bullish, and I hope December will be bullish too. Altcoins have also started to pump. Keep taking profits, though, and don't be too greedy, please. TC and Happy November 2025.
BTCUSD: Stabilize above 105,000BTC rose to break through and stabilizing above 105,000 today, surpassing last week's short-term resistance level. Next, we will focus on whether the key resistance level at 108,000 can be broken.
We predict that Bitcoin's movement today will fluctuate within the range of 104,000-108,000. If it can sustain a breakthrough above 108,000, we expect an upward trend to emerge this week.
Buy 103,000 - 103,500
SL 102,500
TP 104,500 - 105,000 - 105,500
Sell 105,500 - 106,000
SL 106,500
TP 104,500 - 104,000 - 103,500

BTCUSD – Signs of Recovery Within the Downward Channel?Currently, BTC is moving within a clear descending channel on the 4H timeframe, but bearish momentum has started to weaken. The 99,600 USD zone is acting as a key support level , where strong buying pressure tends to appear whenever price approaches this area.
The price structure suggests a possible retest of this support zone , followed by a rebound toward the upper trendline of the channel around 105,000 USD. The formation of higher lows in the short term indicates that buyers are gradually regaining control of the market.
I expect BTC to hold above 99,600 USD and start forming a short-term bullish reversal . If price breaks above the 105,000 USD resistance zone, the uptrend will likely be confirmed, opening the way toward 108,000 USD in the upcoming sessions.
Main Scenario:
Prefer Buy positions near 99,600–100,000 USD, taking short-term profits at 105,000 USD.
The bullish outlook remains valid as long as price holds above 99,000 USD.

Bitcoin: Not Dead Yet - Altseason Incoming...All In Before the Explosion: Bitcoin’s Next Leg and the Incoming Altseason Wave
Once again I'm ALL IN on IG:BITCOIN and a few selected ALTS.
Bull market NOT over.
🔥Altseason hasn’t even started warming up and this is not hopium ...
Here’s the raw macro truth the chart is yelling:
INDEX:BTCUSD is sitting cleanly inside the macro demand zone
Still riding the ascending channel that has carried every major leg of this cycle
No top. No breakdown. No weakness.
This is positioning , not exhaustion.
⏱ Cycle Structure:
• Each expansion leg: 14–15 weeks 📈
• Each correction: 16–18 weeks 📉
We’re exiting the correction window (ends Nov 10th🗓️)→ entering the next expansion phase.
📊 What the chart confirms:
• Long-term channel from Jan 2024 still intact → trend pointing to six figures.
• Weekly demand zone acting as controlled re-accumulation , not distribution.
• Clear trigger: break above $126K → macro ignition.
• Weekly RSI sitting on base support ⚫ → same level that preceded every major leg up.
• High-timeframe target for this cycle still $150K–$170K →parabolic to 220k+ 🎯
• Volume profile shows accumulation not distribution 🎯
📝 Scenarios:
1️⃣ Direct Blast-Off 🚀
Demand zone holds → $126K break → new ATH → trend accelerates into $160K–$170K.
2️⃣ Manipulation Flush 🩸
Wick below demand(flash crash to $90k) → mid-channel tap → violent reclaim → same final target.
❌ Invalidation:
Only a weekly close below the channel kills the structure.
Nothing else matters.
✅ Bottom Line:
This bull market isn’t cooling, it’s reloading .
Bitcoin is gearing for its next expansion wave, and alts will follow with the delayed, violent, inevitable altseason.
This next leg is where generational entries pay off or get regretted.
My stake is on IG:BITCOIN where is yours?

BUY~BUY~BUY~Currently, the price of Bitcoin has achieved a quadruple resonance of "technical breakthrough + capital inflow + bearish squeeze + macroeconomic support". The short-term bullish logic has upgraded from "rebound continuation" to "breakthrough breakthrough". The breakthrough of the key resistance opens up a clear upward space. The inflow of ETF funds and the liquidation of bears form a dual buying support. Although there is short-term overbought pressure, the trend intensity is sufficient to support further. The core of operation lies in "batch layout + dynamic stop-loss and stop-profit". Institutional investors can seize the opportunity of the pullback to establish core positions, while swing traders can follow the breakthrough signal to go long in a timely manner. At the same time, by strictly tracking real-time indicators, they can lock in profits at the peak of bearish squeeze and moderately reduce positions when the overbought signal appears, accurately seizing the definite opportunities of breakthrough-type market conditions.
Bitcoin trading strategy
buy:104000-105000
tp:106000-107000
sl:103000

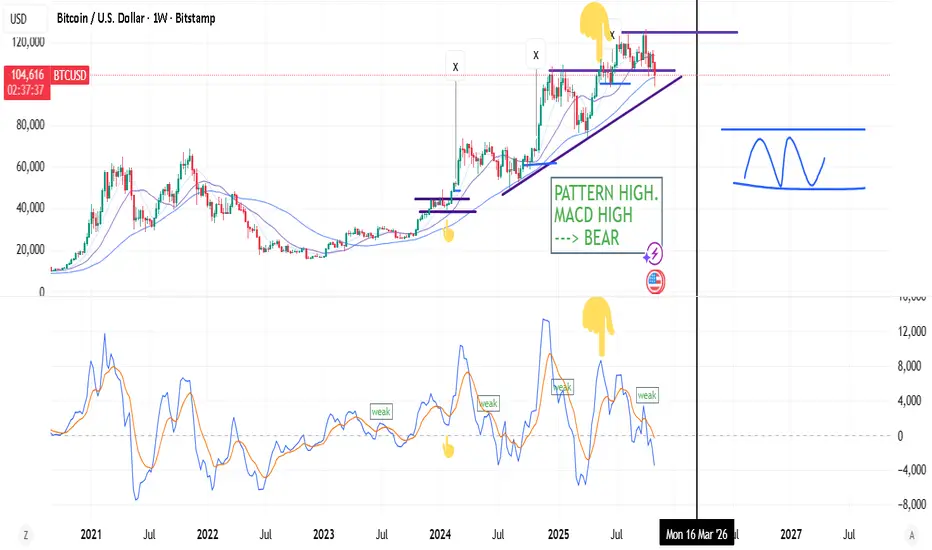
No soup for you, come back 1 yearif this 35 bar monthly cycle holds up like it has in the 2 previous cycles, top is in. I was expecting a better performance out of btc this cycle but my bias has changed as we have reached q4. the monthly 50 simple moving average aligns with the top of the previous cycle putting btc at a low of around 70k in the coming year.
3 years up, 1 year down, rinse and repeat.
let me know what you think will happen. is it different this time around? or is pattern about to repeat?

PATTERN logic + MACD LOWS/POTENCIAL = High probabilities.If you combine basic FACTORS of Patterns + MACD (weaknesses or Lows/Highs) you get pretty straightforward probability.
Weekly MACD above zero (and daily macd above zero) mean strong impulse, trend. But sometimes deep corrections in negative territory (bears) are not negative, because every chart pattern require strong "push" to break the pattern. I think you can see if there's smoke, in advance.
$BTC Possible TOP / Manipulation & then Distribution?Accumulation - Manipulation - Distribution
3 phases, and the manipulation part may be coming..

$BTC Monthly ViewWe are at the very beginning of the bear market.
Even if we have a 2nd Manipulation (NEW ATH), that's not necessarily happening, as we've already grabbed the liquidity but know that new ATH will not change the analysis.

$BTC Same zone. Same faith.Bitcoin is once again holding at the VWMA and SMA13 support on the monthly chart.
From past to present, the trend has never changed unless these supports were broken.
As long as monthly closes stay up...
Everything else is just noise.

Weekend structure: 101.4k reclaimed, next 104.5k?BTC showed clear accumulation this morning, taking out yesterday’s low at 101,422.74 and then rallying hard into Friday’s and Saturday’s highs.
Two targets above are still untouched — 104,191 and 104,550 — likely next in line if buyers stay in control.
Price is holding around 102,900, showing strength after that fakeout drop.
Watch how price reacts near 104k — if liquidity holds, we could see one more push before the next pullback.
Smart money moves first — absorption always comes before expansion.
Institutional Logic. Modern Technology. Real Freedom.

Bitcoin trading strategyCurrently, the price of Bitcoin stands at $102,200. This has achieved a triple confirmation of "technical bottom + capital bottom + emotional bottom". The short-term bullish logic combines both safety and profitability. The long-term institutional layout provides support, and the expected improvement in macro liquidity brings benefits. The clear reversal signal on the technical side indicates a correction is a good opportunity to increase positions. The core of the operation lies in "batch allocation + dynamic stop-loss and stop-profit". Institutional investors can seize the pullback opportunity to establish core positions, while swing traders can follow the breakthrough signal to go long in a timely manner. At the same time, by strictly tracking real-time indicators, they can avoid short-term volatility risks and lock in wave profits.
Bitcoin trading strategy
buy:101000-102000
tp:103000-104000
sl:100000

BTCUSD: Bearish Continuation & Short Signal
BTCUSD
- Classic bearish setup
- Our team expects bearish continuation
SUGGESTED TRADE:
Swing Trade
Short BTCUSD
Entry Point - 10376
Stop Loss - 10482
Take Profit - 10200
Our Risk - 1%
Start protection of your profits from lower levels
Disclosure: I am part of Trade Nation's Influencer program and receive a monthly fee for using their TradingView charts in my analysis.
❤️ Please, support our work with like & comment! ❤️

BTCUSD : Bulls Trying to Reclaim Momentum!Bitcoin has bounced sharply after a deep correction, hinting at a possible short-term recovery phase. If structure holds, we could see one more leg up before the next consolidation or reversal. Key zone to watch: $105,000–$106,000 for potential resistance.
Disclosure: We are part of Trade Nation's Influencer program and receive a monthly fee for using their TradingView charts in our analysis.

Bitcoin at a Decision Zone – Day 1👋🏻 Hey everyone! Hope you’re doing great! Welcome to SatoshiFrame channel.
✨ Today we’re diving into the 1-Hour BITCOIN analysis. Stay tuned and follow along!
🪙 Bitcoin on its one-hour timeframe is currently within a trading range, and due to the holidays, both volume and volatility have dropped to their lowest levels. According to the analysis, an important resistance has formed around $103,912, and a micro buyer support around $100,288. Once either of these zones is broken, Bitcoin could provide a trading opportunity.
📊 Bitcoin’s volume on the one-hour timeframe has now reached its lowest level, indicating that we are close to a potential move. This suggests possible upcoming volatility. As for the micro buyer floor, this level is crucial for buyers — when price reaches it, buying volume typically increases. To break this zone, it would require significant selling volume and large whale candles to overcome the long-biased traders.
🧮 My favorite oscillator, RSI, is also ranging between 30 and 70, which nicely overlaps with the identified support and resistance levels. A breakout from these RSI limits can confirm our risk level and validate potential trade entries.
✍️ You can read the possible scenarios for this trading range below. If needed, set your alert zones and use them accordingly. Don’t forget proper risk and capital management.
↗️ Long Position Scenario: A breakout above $103,912, accompanied by an increase in buying volume, would validate a potential long setup. This volume increase should also align with the oscillator, meaning RSI should break above 70 on the 1-hour or 15-minute multi-timeframe chart, along with increased market volatility.
📉 Short Position Scenario: A breakdown below the micro buyer floor at $100,288, with selling pressure and RSI falling below 30, could confirm a short position. However, it’s recommended to wait for a pullback after the breakout before entering the trade.
❤️ Disclaimer : This analysis is purely based on my personal opinion and I only trade if the stated triggers are activated .

BTC UpdateBTC has tested 50% rejection block on weekly time frame, forming a lower wick. This is clear indication that a trend shift from bearish to bullish market is on the way. As per normal market structure mapping, BTC has formed a LL, as you can see in the image below. Since BTC has swipped the RB liquidity, there's a high chance that CHOCH might soon occur and BTC might go bullish.

BTCUSD Tests Buyer Zone — Eyes Break Below $100KHello traders, here’s my current outlook on Bitcoin (BTCUSD). The market continues to trade within a broader bearish structure after breaking down from the previous rising channel. The price failed to hold above the $110,000–$111,000 Seller Zone, where multiple fake breakouts occurred, indicating strong bearish pressure and aggressive selling activity in that region. After the rejection from the Seller Zone, BTC shifted into a descending trend structure, forming lower highs along a clearly defined Resistance Trendline. Each corrective move to the upside has been capped by this trendline, confirming that sellers are maintaining control. Meanwhile, the Support Level around $100,200–$101,000 has acted as a key Buyer Zone, where price has repeatedly paused and reacted, suggesting that buyers are attempting to absorb selling pressure here. Currently, BTC is consolidating just above this Support Zone, but the overall momentum remains bearish. If the price fails to break above the descending Resistance Line, we could see a continuation of the downtrend, likely pushing toward a retest of the $100,200 Support Level. A confirmed breakdown below this level would expose the next downside support levels and reinforce the sellers’ dominance. However, if buyers manage to hold the price above $100,200 and force a breakout above the descending Resistance Line, a short-term corrective recovery could unfold toward the $103,000–$105,000 region. This area remains critical and is likely where sellers may look to re-enter the market based on previous reaction structure. For now, the market structure favors a bearish bias, with the trend down and sellers maintaining stronger control. I am watching for a reaction at the current support — if the level breaks, continuation lower becomes the primary expectation. Please share this idea with your friends and click Boost 🚀

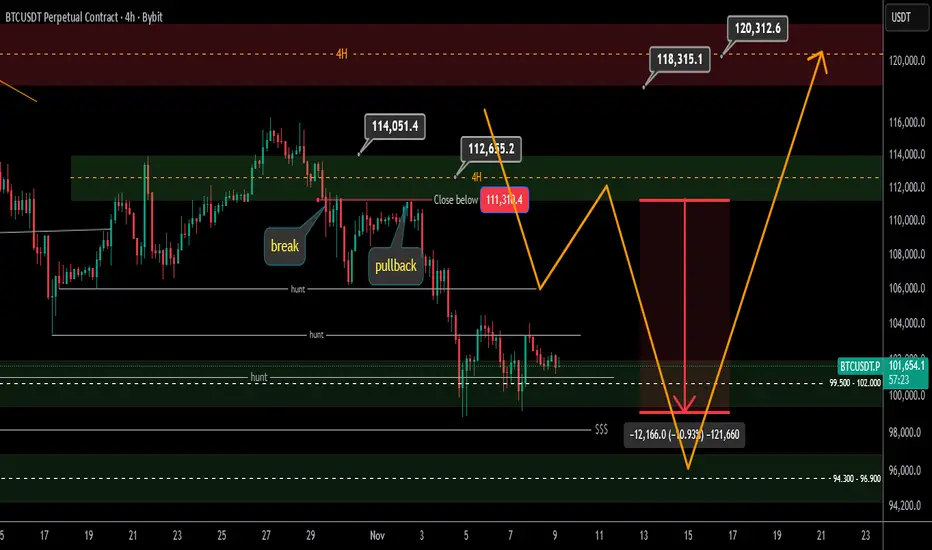
Bitcoin Update Time Frame 4 Hours
Hi Traders
Bitcoin Update Time Frame 4 Hours So far, according to the analysis, we have had losses and profits above $12,000, and as expected, three of the four liquidity levels we are considering have been hunted, and only the liquidity level of 98,000 remains, which, with the hunt of this fourth level at the support of 94,000 to 96,000 (more precise number on the chart), was looking for a trigger buy for high liquidity. I hope you are also in profit
Analysis link:
Bitcoin: 100K NOW Attractive For Investing.Bitcoin looks bearish to most, I can understand why BUT as bearish as this looks, the current price area still presents a potential area for a bullish reversal. The 98K low dates back to the June low which is now acting as the support. IF this level breaks, 95K is the next inflection point to watch for a swing trade long possibility. IF that is cleared, 90K becomes the level. The 88K AREA is the Wave 1 overlap WHICH MEANS: IF price tests this area and does not reject it quickly, that would confirm that Bitcoin is most likely in the BROADER corrective wave that I was talking about earlier in the year.
What I have just laid out here is a number of scenarios that may or may not unfold. The purpose is to be prepared for a market scenario and have a plan in case a confirmation appears. There is NO way to accurately forecast this. I evaluate price structures, and change my outlook based on changes or lack of changes in price structure. From this point I can gauge potential BUT require confirmations to gauge RISK. The illustration on this chart show the bounce scenarios that I am looking for this week which can take price back into the 105K AREA which is now an old support / NEW resistance.
The 100K area is also a MUCH more attractive location for investing, especially compared to the 125K AREA high. Keep in mind, as an INVESTOR, you assume the greatest risk. This means you must be open to the possibility of Bitcoin testing low 80Ks or even the 70Ks in the coming months. While I do believe this is a lower probability at this point, it CAN happen. As an investor you control risk with size that is proportional to your account and minimal or NO use of leverage for this precise reason.
I don't care why Bitcoin is weak now because fundamentally, not much has changed in terms of an inflationary environment. News is for content producers and frauds to monetize your attention. If it had any actionable value, they should have been calling the top at 126K instead of over reacting to it. This is why I rely on wave counts to guide my broader view of how Bitcoin is likely to behave in the near future. And also why I believe the broader bullish structure (Wave 4) is still intact until price overlaps Wave 1 at 88K. IF this level cannot be tested within this bearish attempt, it implies a broader Wave 5 is likely to follow which theoretically can see a test of the 126K high. The Federal Reserve's easing policy aligns with this scenario as well. We are also facing an information gap in the form of missing governments reports which can have a major affect, just something to think about.
Thank you for considering my analysis and perspective.
