$BTC SUNDAY UPDATE We’re still holding our short position BTC SUNDAY UPDATE
We’re still holding our short position from the last 85 days, and it’s been playing out exactly as planned.
Bitcoin dumped multiple times from the 116K–124K short range which has been our sell zone every time, and we’ve stayed patient, holding through every bounce.
Right now, BTC is trading around 110K, sitting just below the 1D 50 EMA, currently near 112.7K. If BTC breaks and holds above 112.7K, there’s a chance we could see 116K–117K, and that’s exactly where I’ll be adding more shorts. 🚨 My main target remains below 100K.
BANKS UNDER MASSIVE PRESSURE 🏦
Liquidity stress is building fast. The Fed may pause QT, but that doesn’t mean money is coming back. There’s no QE yet. Banks are struggling to stay liquid as repo borrowing just hit $50B in a single day and reverse repo usage spiked again.
That’s a clear sign the system is tightening. If this continues, we could see forced selling across risk assets. I’m still short on BTC until the Fed is forced to print again. That’s when the real rally begins. 💥
In simple terms:
🏦 Banks are showing signs of liquidity strain.
💸 QT is removing cash from the system.
📊 The Fed saw a surge in overnight borrowing.
#Bitcoin #BTC #Crypto #MarketUpdate #Liquidity #Fed
1-BTCUSD

BTC/USDT – 4H Technical OutlookBTC/USDT – 4H Technical Outlook
📊 Market Structure:
Bitcoin recently experienced a bearish shift in structure (CHoCH + BOS to the downside) after being rejected from the premium zone around 115,000.
After forming a strong swing low near 108,000, the market rebounded and printed a higher low, suggesting short-term bullish correction within an overall bearish context.
Currently, price is testing the EMA confluence zone near 111,000, which is acting as short-term resistance.
📈 Key Levels:
Resistance Zone (Equilibrium / Supply Zone): 113,500 – 115,000
Current Reaction Zone: 110,500 – 111,500
Support Zone: 108,000 – 109,000
⚙️ EMA Confluence:
The 89 EMA (blue) and 200 EMA (yellow) are both positioned above current price, confirming a bearish market structure.
Price is now testing the 89 EMA from below — a typical retracement area before continuation down.
📉 Momentum (Stochastic RSI):
The Stochastic RSI has turned down sharply from the overbought zone, indicating decreasing bullish momentum and possible continuation of the downtrend.
🎯 Trading Scenarios:
Scenario 1 – Sell (Trend Continuation)
Entry: 110,800 – 111,500 (retest of EMA zone)
Stop Loss: 113,000
Take Profit: 108,000 → 107,000
Confluence: EMA rejection + bearish structure + RSI reversal from overbought
Scenario 2 – Buy (Reversal Confirmation Only)
Entry: 113,500 – 114,000 (after clear breakout & retest)
Stop Loss: 112,500
Take Profit: 115,000 → 116,000
Confluence: Break above 89/200 EMA + BOS confirmation
💡 Summary Insight:
BTC/USDT remains bearish-biased below 111,500–113,500.
Expect a possible retest of EMA resistance before continuation toward 108,000.
Only a strong 4H candle close above 113,500 would shift momentum to bullish.

Bitcoin: Investors hesitant, BTC holds supportThe Fed cut interest rates by 25 basis points, but it is questionable whether another rate cut in December will occur, as previously expected. The US Government continues to be in a state of a “shutdown”. Fed Chair Powell noted that inflation might stay elevated in the future, while risks around the job market are emerging. Taking into account a lot of insecurities currently surrounding financial markets, investors are still not in the mood to place their funds into riskier assets. BTC price moves are pointing that investors are currently in favour of waiting for clearer signals in terms of macro clarity and regulatory moves in order to shift back their funds into the crypto market. In this sense, volatility is likely to remain elevated while the upside may be constrained until a clear trigger emerges in the future period.
BTC price tested the $116K level at the start of the week, but soon reverted back. The lowest weekly level at $106K was reached on Thursday, but the stronger down trend started after the FOMC meeting. The RSI is holding around the level of 45, but the clear oversold market side has not been reached. The MA50 and MA200 are getting closer to one another, but the potential cross is still not in store due to distance between lines.
BTC is closing the week by testing the $110K short term support level. Charts are pointing that the short recovery might lead BTC toward the $111K. A clear breach of this level would lead BTC back toward the $116K as currently strong resistance. Still, risks hold toward the downside, where levels around the $107K could be tested again.

Major Breakout Setup Forming on Bitcoin’s 1-Hour Chart👋🏻 Hey everyone! Hope you’re doing great! Welcome to SatoshiFrame channel.
✨ Today we’re diving into the 1-Hour Bitcoin analysis. Stay tuned and follow along!
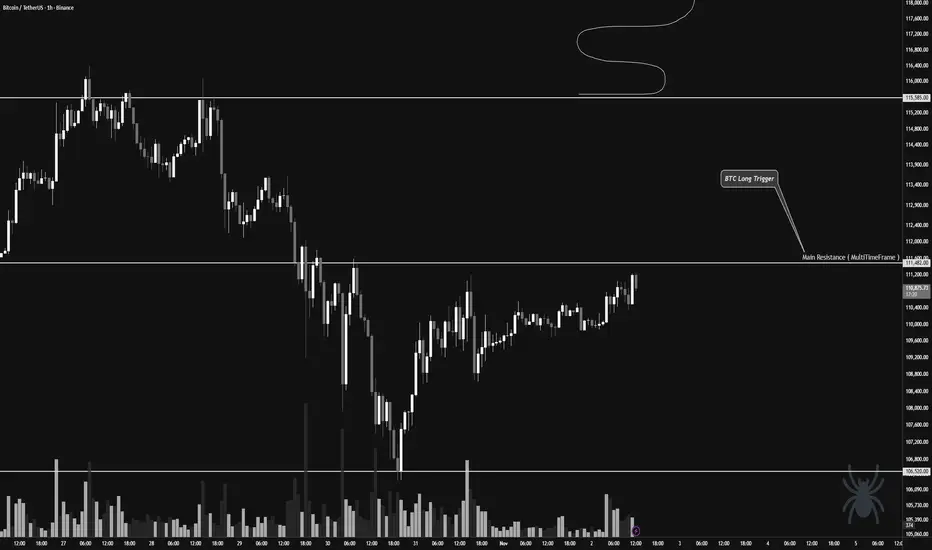
👀 On Bitcoin’s 1-hour timeframe, we can see that Bitcoin has built a multi-timeframe accumulation zone as the weekend began. It has now successfully broken above the top of this range, but we have a notable resistance area to keep an eye on.
The $111,482 price zone is a strong resistance level, and when price reached this zone, it faced heavy rejection and selling pressure. This area could provide the best trigger for a breakout. If Bitcoin manages to break above it, we could see a strong bullish leg and further upside momentum.
🧲 Bitcoin’s trading volume has slightly decreased over the past few days, so we’re waiting for volume expansion during the New York session to see what kind of reaction we get — this will guide our trade setup. Since there’s also a meeting between the U.S. and Chinese presidents tomorrow, we might prepare a speculative position ahead of that event to capture potential volatility and profits.
My current bias on Bitcoin remains bullish, as the trend hasn’t broken any significant support levels yet.
💵 Meanwhile, Tether Dominance (USDT.D) has reacted three times to its upper resistance zone on higher timeframes but failed to break above it. This suggests a bullish outlook for the crypto market, as a rejection in Tether Dominance could lead to downside movement there — fueling a strong bullish leg across the market.
✍️ The main long setup will trigger on a break above the $111,482 resistance zone. Confirmation can be taken from RSI oscillator signals and increasing buying volume.
We can open this low-risk long position (around 0.5% risk), and if tomorrow’s session brings clear bullish triggers, we can add to the position for larger exposure.
❤️ Disclaimer : This analysis is purely based on my personal opinion and I only trade if the stated triggers are activated .
From 107K to 104K — Bitcoin’s Next Stop Before the Big Drop?An update to my previous Bitcoin outlook — we’ve almost reached my 107K target.
Now, I’m setting a new short-term goal at 104K, though I believe we might even dip toward 100K.
Let’s see how the chart reacts as we approach the 104K zone.
On a larger scale, as I mentioned in one of my earlier posts, my global target remains around 83K.
The invalidation zone for this scenario is marked directly on the chart.
Let’s summarize 👇
📉 Nearest target: 107K (almost reached)
📉 Next target: 104K
📉 Possible drop to: 100K
🌋 Global target: 83K
👁️Follow me so you don’t miss future updates to my forecasts!

BTCUSD The Target Is UP! BUY!
My dear subscribers,
This is my opinion on the BTCUSD next move:
The instrument tests an important psychological level 10983
Bias -Bullish
Technical Indicators: Supper Trend gives a precise Bullish signal, while Pivot Point HL predicts price changes and potential reversals in the market.
Target - 11133
About Used Indicators:
On the subsequent day, trading above the pivot point is thought to indicate ongoing bullish sentiment, while trading below the pivot point indicates bearish sentiment.
Disclosure: I am part of Trade Nation's Influencer program and receive a monthly fee for using their TradingView charts in my analysis.
———————————
WISH YOU ALL LUCK

BTC Scalp Sell/Short Setup (15M)The trend and structure are bearish, and Bitcoin is approaching a bearish origin point. If it fails to break through this origin, the low that created this bullish wave will be at risk.
With this in mind, we can prepare a position for Bitcoin with a risk-to-reward ratio of 1:2.
The last bullish wave on the lower timeframes also has a bearish CH.
Let’s see what happens.
For risk management, please don't forget stop loss and capital management
When we reach the first target, save some profit and then change the stop to entry
Comment if you have any questions
Thank You

BITCOIN HEADING STRAIGHT TO HELL!🚨 BITCOIN HEADING STRAIGHT TO HELL! 🔥💀
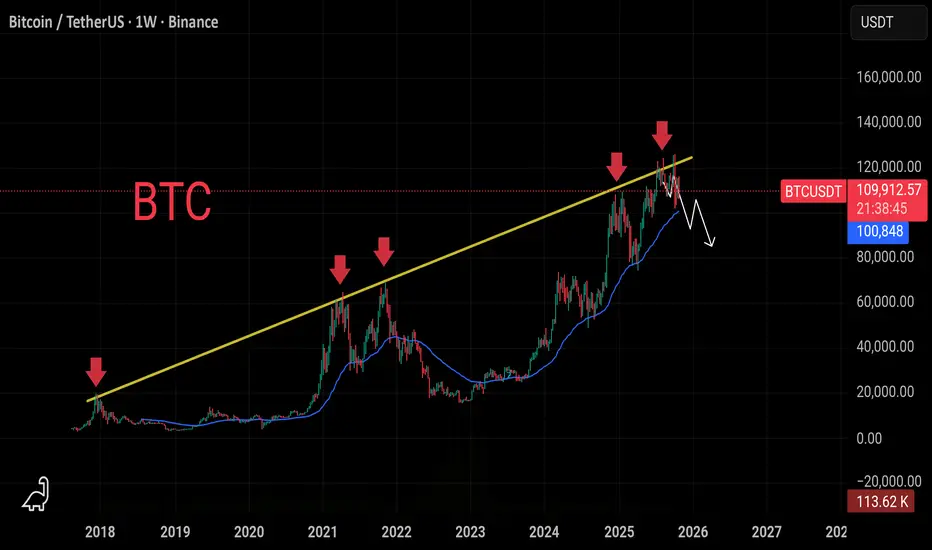
CRYPTOCAP:BTC holders history doesn’t lie. Every time Bitcoin hits a new All-Time High, an 80% bloodbath follows soon after.
Once we lose that 1W 50EMA and $100K support, expect a vertical free fall — no mercy zone ahead.
Panic early or be the exit liquidity.

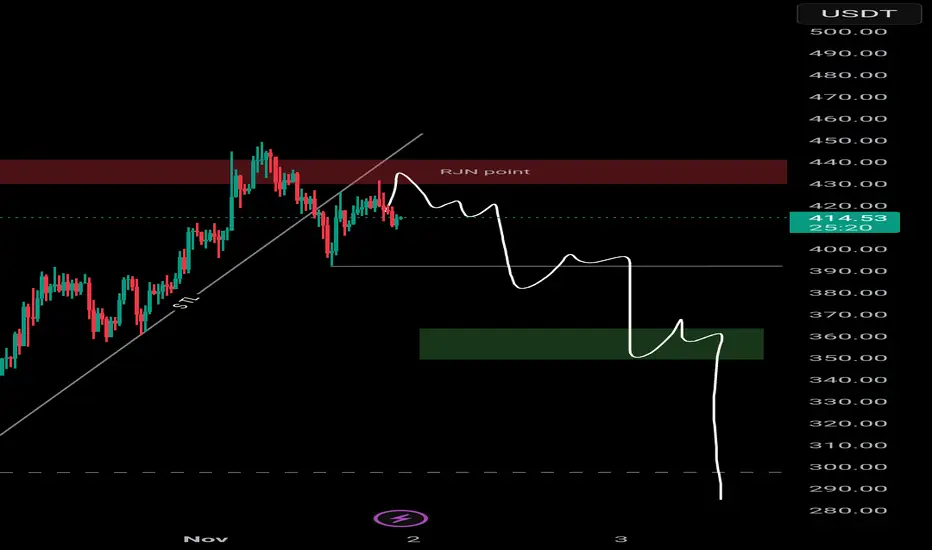
Shorted again near $430, expecting 20%+ pullbackCRYPTOCAP:ZEC 𝗦𝗵𝗼𝗿𝘁𝗲𝗱 𝗮𝗴𝗮𝗶𝗻 𝗻𝗲𝗮𝗿 $𝟰𝟯𝟬, 𝗲𝘅𝗽𝗲𝗰𝘁𝗶𝗻𝗴 𝟮𝟬%+ 𝗽𝘂𝗹𝗹𝗯𝗮𝗰𝗸🩸🔴
CRYPTOCAP:ZEC just slammed into the $450 resistance — looks like the party’s over for late FOMO buyers! 😈
I’ve stacked shorts around $430, expecting a sharp 15% - 20%+ correction as momentum fades out.
Next big buy zone on my radar: $300–$280, where I’ll watch for the next major bounce setup! ⚡
$ONDO 𝗪𝗲𝗲𝗸𝗹𝘆 𝗪𝗮𝘁𝗰𝗵 – $𝟮 𝗧𝗮𝗿𝗴𝗲𝘁 𝗜𝗻𝗰𝗼𝗺𝗶𝗻
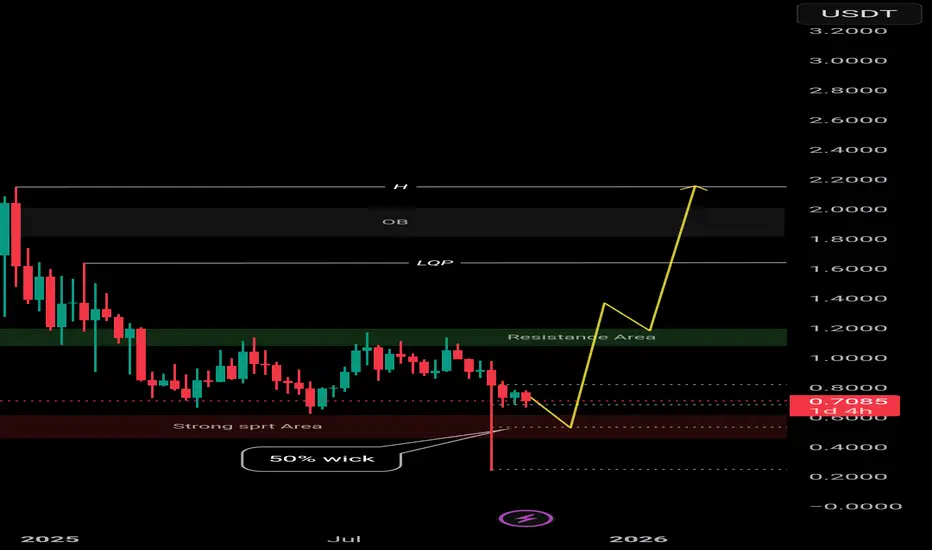
LSE:ONDO is pulling back into a well-tested support zone on the weekly chart after multiple rejections from the mid-range supply block. Price is hovering just above support — a level that has held strong several times before.
If buyers step back in, a rebound to $1.10 – $1.25 is very possible. But a break below could see LSE:ONDO sliding deeper into the next demand region before any meaningful recovery.
📈 Trade Plan:
🟢 Entry: $0.70 & $0.55 (50% wick)
🎯 Targets: $1.10 → $1.40 → $1.70 → $2.00
🔴 Support: $0.2
This is a critical weekly reaction zone — next candles will reveal whether bulls or bears take control. Eyes on ondo
If $GOLD is at its peak, is $BTC next?Gold has been rejected at the 0.618 level of the Fibonacci channel on the 3M chart.
The Stoch RSI demonstrates a striking similarity to past cycles:
The bullish structure, which continued in the overbought region in October 2010, peaked 273 days later in July 2011.
Momentum, which continued in the overbought region again in October 2019, reached its peak 365 days later in October 2020.
Today, history paints a similar picture once again.
The bullish structure, which began in the overbought region in October 2024, may have reached its peak approximately one year later, in October 2025, just as in previous cycles.
Gold appears to be completing its historical rhythm once again.
Note: The Bitcoin / Gold pair is developing in the opposite direction.

BTCUSD: Market Sentiment & Forecast
Remember that we can not, and should not impose our will on the market but rather listen to its whims and make profit by following it. And thus shall be done today on the BTCUSD pair which is likely to be pushed up by the bulls so we will buy!
Disclosure: I am part of Trade Nation's Influencer program and receive a monthly fee for using their TradingView charts in my analysis.
❤️ Please, support our work with like & comment! ❤️

BTCUSD price await one time breakout below 109850 before selling#BTCUSD price await one time breakout below 109850 before selling.
Multiple rejection have happened between 110150 and 109850.
Sell from 109850, target 108900, stop loss 110531.
Above 110300 shows bullish continuation on 2 times breakout.

Buying Idea For Bitcoin BINANCE:BTCUSDT
This is my outlook for BITCOIN
if you wanna buy now make sure you have fund and risk management
my advice is wait for POI and wait for confirmation but if not happend and the price will go up then wait for the retracement.
if price go fall chance to bear is very high
happy holiday and DYOR im not financial advice just sharing my idea

EURUSD - GBPUSD - BTC - AUDCAD - S&P500This weekly insights has a great possibility for a clear directions for

what if $BTC Bitcoin has been trading within this ascending channel for years.
It has repeatedly touched the red resistance line but has never broken through.
Now, it's quietly recovering within the lower band.
The next upward move is $200k which coincides with the red resistance line.

BTCUSD EXPANDING CHANNELThe chart highlights Bitcoin's recent price action within a significant, long-term pattern known as a Broadening/Expanding Wedge or Channel, which often signals increasing volatility and indecision between buyers and sellers.
1. Broadening Formation (Expanding Channel)
Structure: The price is contained within two divergent trendlines (one resistance, one support) that are moving away from each other. This is a pattern of increasing highs (Resistance) and decreasing lows (Support).
Significance: This pattern suggests high volatility and a lack of conviction, where large moves are fading out as they hit the trendline boundaries, only for the price to reverse and test the opposite boundary.
Pattern Goal: Broadening patterns typically resolve with a decisive breakout above the resistance or below the support, which then initiates the next major trend.
2. Key Price Action and Rejection
Recent High: The price recently tested the upper boundary of the broadening channel (Resistance) around the $126,000 - $127,000 area and was sharply rejected.
Current Move: Following the rejection, the price is now in a strong downtrend, characterized by large red candles, moving towards the lower boundary (Support) of the channel.
Breakdown Warning: The chart features a small horizontal box/range that was recently broken to the downside, acting as a minor level of resistance in the current move.
3. Key Support and Targets
Immediate Dynamic Support: The next major target for the current bearish move is the lower trendline of the Broadening Wedge, which currently sits around the $108,000 - $109,000 area.
Strong Horizontal Support: Confluence exists with a strong horizontal support zone just below the dynamic support, around $106,000 - $107,000. This level has acted as a critical floor previously (as evidenced by the large green candle wick around October 10th).
Critical Confluence Zone: The area where the dynamic trendline support meets the horizontal support ($106,000 - $109,000) is the most critical zone for a potential bounce.
4. Momentum (RSI)
RSI Reading: The Relative Strength Index (RSI) is currently in a strong downtrend, moving towards the Oversold (30) territory.
Bearish Momentum: This confirms the current bearish momentum and suggests that a strong bounce or reversal is unlikely until the RSI either hits oversold or the price reaches the major support confluence.
💡 Trading Implication
The technical structure suggests that the price is likely heading to test the bottom of the long-term pattern.
Bearish Continuation (Most Likely Scenario): The price is expected to continue its slide to test the $108,000 - $109,000 dynamic support, where buyers are likely to step in for a reaction bounce.
Critical Support Zone: The $106,000 - $109,000 zone is the "make-or-break" area. A decisive break and close below $106,000 would be a major bearish signal, likely resulting in a large downward move (a break of the entire long-term broadening pattern).

$btc idea for weekend big range to play ! BTC has big range bounce off at 0.78 fib level
1- bullish : if we can take one level of higher low around 111.7K and change this structure there is change we move higher from here likely sunday pump
2-bearish: if we have slow price action over weekend with slow bleed get below 108.4K we might sweep low of range or touch 0.786 level once again
what you think happen first ?

Has Bitcoin already priced in its next move ? | Day 56☃️ Welcome to the cryptos winter , I hope you’ve started your day well.
⏰ We’re analyzing BTC on the 1-Day timeframe .
👀 Bitcoin on the daily timeframe. After the flash crash it experienced, Bitcoin is almost building a box with a top at $114,559 and a bottom at $106,431, which by breaking these areas, it can get out of this trading range and give us a position.
The noteworthy point in the recent days is the Monday meeting between Trump and the President of China, which can determine the destiny of the market and give it a good direction.
🧮 The RSI oscillator, two key zones have formed for us in the areas of 54.5 and 36, and by the fluctuation limit crossing these areas, the next move of Bitcoin can begin.
🕯 Bitcoin’s volume on the daily timeframe has increased sharply after recording a new all-time high, and this has been a tendency toward increasing selling pressure. In the image, it is completely clear that you can see exactly what happened to the market after the flash crash it experienced.
📈 To take a position with this structural style that we currently have, you can refer to the multi-timeframe analysis of Bitcoin and extract the long and short position triggers, and if Bitcoin gives you an entry, enter the position around the anticipated top or bottom with low risk so that later you can add more volume to your position at higher or lower levels.
❤️ Disclaimer : This analysis is purely based on my personal opinion and I only trade if the stated triggers are activated .

BTCUSD Weekend Crypto Warriors MapBTCUSD
Weekend Crypto Warriors | October 31, 2025
Category: BTCUSD
🧭 Context
Mapping the Bitcoin liquidity sweep for the weekend.
If we get volatility today or tomorrow, there are high-probability BTCUSD targets in play. Friday’s price action never took out Thursday’s low at 106.281, and price was pushed back from the daily volume fractal at 106.463.
This week’s unfinished liquidity remains above Thursday’s and Friday’s price action, around 111.066 and 111.629. Price is therefore most likely to rotate toward that liquidity over the weekend.
📈 Technical Analysis POV
From a daily price action perspective, we can clearly see unfinished business on the chart, with liquidity targets positioned at 111.066 and 111.629.
🧭 Macro
U.S. Dollar Index (DXY) holds near 99.7, firm after the Fed’s 25 bp rate cut to 4.00–4.25%.
10-Year Treasury yield steady around 4.6% — still high enough to keep a bid under USD.
High yields + firm dollar = short-term resistance for risk assets like BTC.
Seasonal tailwind: historically, November delivers positive BTC returns — but follow-through depends on yield compression and macro risk appetite next week.
📊 Volume & Order Flow
Order flow activity has slowed notably since Thursday.
On October 30, 2025, BTCUSD recorded a daily trading volume of approximately $69.67 billion, marking a clear drop in participation compared to earlier in the week.
🎯 Plan
At this stage, price action is confirmed range-bound, so no directional bias is required.
We’ll stick to the proven BTC strategy — trade the range with tight micro stops, let positions cruise within structure, and take profits actively as momentum accelerates.
🧠 CORE5
Sweeps expose who’s reactive and who’s disciplined.
Your edge isn’t in predicting the move — it’s in reading the aftermath.
Patience turns chaos into clarity. Control turns clarity into profit.
- Institutional Logic. Modern Technology. Real Freedom.

Bitcoin - The manipulation!On the weekly Bitcoin chart, there’s a clear bearish rising wedge pattern, and right now it’s trading near the lower side of that wedge — getting ready for a downward weekly breakout.
But let me remind you of something important — this will likely be part of a psychological game played by market makers, so remember my words carefully:
- Bitcoin will break down from the wedge, giving a bearish signal, and many traders will enter short positions.
- It’ll even dip slightly below the 50 EMA, making everyone more confident in the bearish move.
- Then, it’ll reverse sharply upward, liquidating all the short positions.
Market makers always make you believe your plan is playing out perfectly — right before they turn against you and take your money.
So stay alert, place your buy orders slightly below the 50 EMA, and avoid using high leverage.
Best Regards:
Ceciliones🎯

BTC Retracement Setup After Liquidity Sweep at Key Resistance📊 Bitcoin 4H Analysis – Bullish Momentum Meets Key Liquidity Zone
Bitcoin continues to trade within a strong bullish trend on the 4-hour timeframe. Price has now tapped into a major resistance zone — the liquidity sitting above a previous external range high. This reaction suggests we may see a corrective move before the next leg higher. 🔁💡
I’ll be waiting for price to retrace back into equilibrium of the current bullish price swing, where premium turns to discount, to look for a high-probability long setup. ✅🎯
⚠️ Not financial advice — for educational purposes only.
