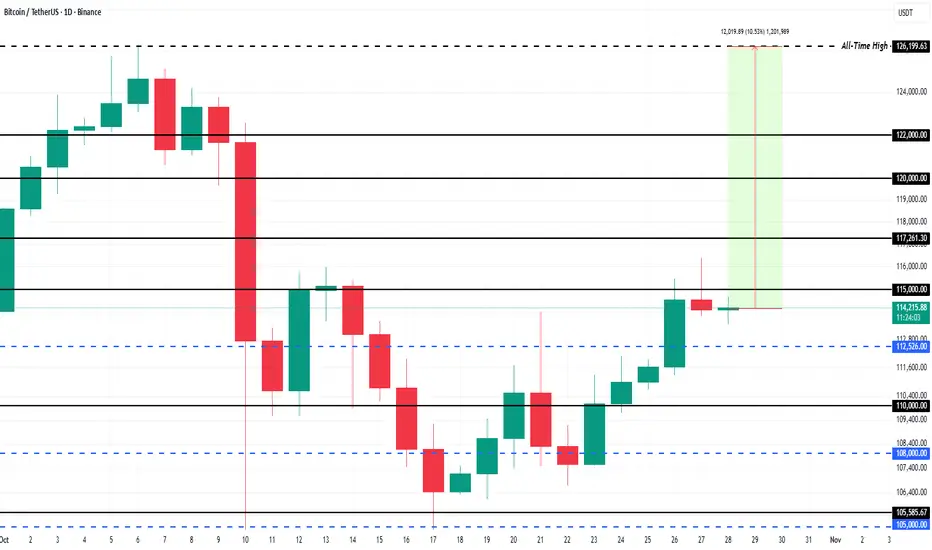
What To Expect From Bitcoin Price In November 2025At the time of writing, Bitcoin trades at $114,518, sitting just below the key $115,000 resistance level. With investor sentiment turning increasingly positive, BTC could soon push through this barrier. A confirmed breakout would likely trigger renewed momentum, driving prices toward higher resistance levels in November.
Bitcoin’s near-term target remains its all-time high (ATH) of $126,199, which requires a 10.2% rise from current levels. To achieve this, BTC must first clear strong resistance zones at $117,261 and $120,000, where heavy supply from profit-takers could temporarily slow progress.
However, if Bitcoin fails to sustain momentum above $115,000, short-term weakness could reemerge. A dip toward $110,000 remains possible if buyers lose conviction. Any move below this support would invalidate the bullish outlook.
1-BTCUSD
Bitcoin Breakout or a Deeper Rest Ahead ?👋🏻 Hey everyone! Hope you’re doing great! Welcome to SatoshiFrame channel.
✨ Today we’re diving into the 4-Hour Bitcoin analysis. Stay tuned and follow along!
👀 We’re looking at Bitcoin on the 4-hour timeframe. Bitcoin is currently in a bullish correction and awaiting tomorrow’s news. It’s worth noting that this upward correction is happening below the key resistance level at $115,555. A breakout above this zone could allow Bitcoin to continue the bullish leg it has already started.
🧮 Looking at the RSI oscillator, Bitcoin’s momentum previously entered the overbought area but has now exited and is oscillating below the 70 zone, which now acts as the current resistance level.
✔️ Let’s pay closer attention to Bitcoin’s trading volume — as price approached its major resistance, volume increased. However, given the upcoming news, this wasn’t enough to break resistance, and Bitcoin was rejected from that zone, pulling slightly downward. This downward move isn’t very strong and is accompanied by weak corrective momentum.
✍️ The current Bitcoin scenarios have been updated — you can now focus more closely on these scenarios in the next part of the analysis.
🟢 Long position scenario: A breakout above the key resistance level at $115,555, combined with rising buy volume and an RSI swing above the 70 zone, could mark the end of the correction and continuation of the bullish move.
❤️ Disclaimer : This analysis is purely based on my personal opinion and I only trade if the stated triggers are activated .

BTC/USDT: Symmetrical Breakout and Channel ContinuationHi guys!
Bitcoin has successfully broken out of a symmetrical triangle, confirming a bullish continuation pattern after several days of consolidation. The breakout was followed by a clean retest of the triangle’s upper boundary, which now acts as support.
Currently, the price is moving inside a rising parallel channel, showing a healthy bullish structure with higher highs and higher lows. As long as BTC maintains above the midline of this channel, the short-term trend remains upward.
In the coming sessions, price may continue oscillating within this ascending channel, forming a series of higher lows before reaching the next key resistance around $118,682 , and potentially extending toward the triangle’s measured target at $122,56 7.
On the downside, a confirmed close below the channel’s lower line would be the first sign of weakening momentum and could lead to a deeper pullback toward $112,000–$113,000.
Important levels:
Support: $114,000 / $112,500
Resistance: $118,682 / $122,567
Trend: Bullish above $114,000

DXY Long-Term big surprise revealed by Gold! Hi Guys,
I've been doing some research on the DXY and Gold charts and I've been reading news headlines
For the past 20 years and trying to link it with both DXY and Gold charts and I've found out
Some interesting facts that literally flipped the market upside down.
So I pointed each even with the corresponding candle and I would love to know what do you guys
Think about this so feel free to comment and share your opinion on what's really going on behind
The scenes.


Bitcoin Analysis - Bulls vs ResistanceBitcoin triggers have been activated just as expected. Personally, I don’t think it’s a bad idea to hold current positions — we’ve got some solid entry points already.
📈 Bitcoin is showing a bullish trend, and as we approach the upcoming interest rate decision, momentum could build even more.
Above the $116,000 zone, we could see a long trigger, but personally, since I already have two open entries from lower levels, I won’t be adding new ones for now.
💡 If the interest rate is lowered, there’s a chance we’ll see a few red candles initially, but overall, it should be positive for the crypto market.
Right now, Bitcoin is facing a key resistance zone — breaking above it could confirm a bullish continuation on higher timeframes. 🚀
Disclaimer:
This content is for informational purposes only and does not constitute financial or investment advice. © DIBAPRISM
Larry D.Kohn

Bearish reversal off major resistance?The Bitcoin (BTC/USD) has rejected off the pivot and could drop to the 1st support, which is a pullback support.
Pivot: 109,139.03
1st Support: 109,172.55
1st Resistance: 119,893.62
Disclaimer:
The above opinions given constitute general market commentary, and do not constitute the opinion or advice of IC Markets or any form of personal or investment advice.
Any opinions, news, research, analyses, prices, other information, or links to third-party sites contained on this website are provided on an "as-is" basis, are intended only to be informative, is not an advice nor a recommendation, nor research, or a record of our trading prices, or an offer of, or solicitation for a transaction in any financial instrument and thus should not be treated as such. The information provided does not involve any specific investment objectives, financial situation and needs of any specific person who may receive it. Please be aware, that past performance is not a reliable indicator of future performance and/or results. Past Performance or Forward-looking scenarios based upon the reasonable beliefs of the third-party provider are not a guarantee of future performance. Actual results may differ materially from those anticipated in forward-looking or past performance statements. IC Markets makes no representation or warranty and assumes no liability as to the accuracy or completeness of the information provided, nor any loss arising from any investment based on a recommendation, forecast or any information supplied by any third-party.

Stop!Loss|Market View: EURUSD🙌 Stop!Loss team welcomes you❗️
In this post, we're going to talk about the near-term outlook for the EURUSD currency pair☝️
Potential trade setup:
🔔Entry level: 1.15381
💰TP: 1.14051
⛔️SL: 1.16279
"Market View" - a brief analysis of trading instruments, covering the most important aspects of the FOREX market.
👇 In the comments 👇 you can type the trading instrument you'd like to analyze, and we'll talk about it in our next posts.
💬 Description: A breakout of the support area of 1.15000 - 1.16000 remains the main and more reliable sell scenario. More aggressive sell scenarios suggest entering near the current price, that is, from the local maximum of 1.16600. It is anticipated that the price will rapidly approach the 1.14000 area if the support area indicated is broken, as buyers liquidate their positions that have accumulated in large quantities below this level.
Thanks for your support 🚀
Profits for all ✅
❗️ Updates on this idea can be found below 👇

BTCUSD 4H Analysis: Eyes on a Bearish Setup!📉 BITSTAMP:BTCUSD 4H Analysis: Tapping the Bearish FVG — Liquidity Sweep Incoming!
The recent strong move up appears to have run its course, hitting a critical institutional point of interest.
The Setup: Rejection at the FVG
Price has aggressively tagged the 4-hour Bearish Fair Value Gap (FVG) and shown an immediate, sharp rejection. This zone, just under the $115,000 level, acts as our primary ceiling and a high-probability reversal area according to Smart Money Concepts (SMC)/ICT.
Key Observation: The candle wick into the FVG confirms that the institutional selling pressure is holding this range.
Bias & Targets
My bias is distinctly Bearish as long as the high of the FVG remains intact. We are now targeting liquidity below:
Intermediate Target (Initial Sweep): The first magnet is the Sell-Side Liquidity (SSL) marked around $113,106.96. This is a high-probability target to clear out the recent lows.
Confirmation Target (Range Low): A break below the SSL will confirm the continuation of the short-term downtrend, opening the path to the External Range Liquidity (ERL) at the range low, near $112,976.49.
Action Plan
Watch for a small retracement into the Bisi (Buy-Side Imbalance/Sell-Side Inefficiency) near $114,147.60 before the market commits to the next significant drop. The path of least resistance is now to the downside to sweep those stops!
Invalidation: A sustained break and close above the 4H FVG high.
What are your thoughts on this structure? Drop a comment below!
Greetings,
MrYounity

BTC/USD 1h short-term🧭 General context
• Bitcoin price is ~$114,470.
• The short-term trend remains upwards, which is confirmed by the black trendline.
• The last upward impulse brought the price from ~ USD 111,000 to ~ USD 117,000.
• Currently, the price is testing the support zone after a short correction.
⸻
📊 Key technical levels
• Resistances (green):
• USD 117,815 – local peak, strong resistance (potential TP for longs).
• USD 116,545 – medium resistance, possible retest in the short term.
• $115,518 – lower resistance, bulls decision point.
• Support (red):
• USD 114,667 – currently tested level (important intraday support).
• USD 113,545 – another strong support (close to trendline).
• USD 111,915 – the limit after which the upward trend may reverse.
⸻
⚙️ Trendline
• The trend line runs from approximately USD 110,000 and connects subsequent lows.
• The price is currently close to the trendline, so:
• Rebound → continuation of the upward trend,
• Breakout → possible decline to 113,500 or lower (up to USD 111,900).
⸻
📈 Oscillator (Stochastic RSI)
• It is located close to the oversold zone (approx. 8 p.m.).
• This means that the market is close to a potential rebound - a bullish signal (if the %K and %D lines cross upwards).

BITCOIN CLEAR REJECTION|SHORT|
✅BTCUSD made a liquidity grab above the previous high, price sharply rejected from the 4H supply area, confirming a fakeout and shift in order flow. The market structure suggests redistribution, with inefficiency below acting as the draw on liquidity. Expect short-term delivery toward $114,000. Time Frame 4H.
SHORT🔥
✅Like and subscribe to never miss a new idea!✅

BTC has a bright future and is bullish with no regretsThanks to the positive news of the easing of Sino-US trade tensions over the weekend, BTC has gradually recovered from the severe consolidation it has experienced repeatedly since the brutal crash on October 10. This modest recovery appears to confirm the continuation of its upward trajectory.
From the perspective of technical indicators, the MACD golden cross continues to increase in volume and is always above the signal line, further strengthening the bullish sentiment of BTC. At the same time, from the 4H chart, the Bollinger Bands have expanded significantly as prices have risen, indicating that short-term volatility has increased. The fact that BTC prices have remained largely near the upper Bollinger Band suggests that, at this point, the market is more likely to continue its upward trend than to reverse.
However, it is worth noting that the small cycle is trending downward, and the divergence between RSI and price suggests that there may be profit-taking in the short term. Therefore, in the short term, BTC may face a small pullback to retest support before rising.
Pay attention to 114000-113000 below. If it retreats here, you can consider going long on BTC with a light position, with the target at 115000-117000.

LTC: long position!The month of trading proved to be good (LTC).
The general trend shows an increase in prices, with the last buy signal being given in the range of 92-94 USDT, after which the price continued to move up to the current level of about 102.39 USDT

BITCOIN SIGNAL: SHOCKER TARGET REVEALED!!! (warning) Yello Paradisers! Enjoy the video!
And Paradisers! Keep in mind to trade only with a proper professional trading strategy. Wait for confirmations. Play with tactics. This is the only way you can be long-term profitable.
Remember, don’t trade without confirmations. Wait for them before creating a trade. Be disciplined, patient, and emotionally controlled. Only trade the highest probability setups with the greatest risk to reward ratio. This will ensure that you become a long-term profitable professional trader.
Don't be a gambler. Don't try to get rich quick. Make sure that your trading is professionally based on proper strategies and trade tactics.

History Repeats? BTC Dominance Rejected at the Same Zone AgainBTC Dominance is currently facing rejection from the key resistance zone after multiple failed attempts to break above it.
If it continues to struggle here and fails to reclaim the upper zone, a potential drop could follow — which might give altcoins some room to breathe and rally.
Keep an eye on how dominance reacts here; this zone has historically triggered major trend shifts across the market.
DYOR, NFA
Thanks for reading! Appreciate your support and engagement 🙏

ZCASH Breaks 3-Year Accumulation!$ZCASH has finally broken above its 2021 high after spending over three years in a long accumulation phase. This breakout above the major resistance zone signals a clear shift in momentum and could mark the start of a strong bullish cycle.
As long as the price holds above the breakout zone, the structure remains solid, any retest toward $240–$260 could offer a healthy entry point before the next leg higher. Momentum looks powerful here.
DYOR, NFA

BTC/USDT — New Volume Entry Zone Forming - 117KBTC/USDT — New Volume Entry Zone Forming 💥
Bitcoin is stabilizing above the pre-cycle range and building new volume around the $115K zone.
This could mark the next accumulation area before continuation if support holds here.
📊 Key Range: $115K–$116K
📈 Focus: Maintaining this new volume base for further upside to 117K

Bitcoin gains ground on improved risk sentimentIt is all about risk appetite right now driving Bitcoin prices. The rally in BTCUSD in the last few days has has coincided with renewed optimism surrounding trade negotiations between the United States and China. This is also why gold has fallen below $4K today and the S&P 500 has reached fresh record highs. Trump struck an optimistic tone, telling reporters he “really feels good” about a deal, with reports suggesting that China could resume soybean purchases and ease restrictions on rare-earth exports. In return, Washington may scale back its recent tariff threats.
Anyway, it is risk on and BTC is holding firm right now, with the crypto also creating a bullish reversal after it refused to hold below prior low at 107250 and the 200-day average a couple of weeks ago (see circled). That fake out has subsequently pushed BTCUSD back above 110K, 112K and now 115K. Key support is now 112K where the breakout from yesterday commenced and where the 21-day exponential converges.
Next upside resistance levels to watch include 116K, which was being tested at the time of writing, followed by 120K, which is a more significant level to watch.
For now, the path of least resistance is to the upside, even if we see a return to 112K support.
By Fawad Razaqzada, market analyst with FOREX.com

GBPCHF Range/Rise?GBPCHF has been around it's lowest point consolidating. Big probability of it going back to Resistance and BreakingOut this week or next. Waiting for confirmation to take a BUY at least close to Resistance with Trail Stopping to lock in profits.

Bitcoin Analysis 4 HoursBitcoin Time Frame 4 Hours
Currently between two 4-hour balances
Supports 114 and 112 and resistances 118 and 120
Liquidity ranges are characteristic
As long as we are above the green balance, we tend to rise, especially since the bearish balance (red) has not yet pulled back and for further correction and low liquidity hunt, we bet on a 4-hour candle below 111, so for now, there is more upside and pullback with buyer support in the market for resistances

BTCUSD SELL IDEACurrent price: around $114,976
Recent structure: The price made a CHoCH after forming a lower high around $115,600, signaling a potential shift from bullish to bearish momentum.
BOS confirmation: A break of structure downward confirms sellers taking control.
Supply zone: A red zone above ~$115,400–$116,000 shows a bearish supply area, where price could retrace to before continuing lower.
Expected move: A short-term pullback (retracement) toward ~$115,200–$115,400 before a continuation down toward the demand zone near $113,200–$112,800.
📉 Sell idea summary:
Bias: Bearish
Entry zone: ~$115,200–$115,400 (after retracement)
Target: ~$113,200
Stop loss: Above ~$115,600

Will Bitcoin on 4H Push Higher or Take a Breath? | BTC 11👋🏻 Hey everyone! Hope you’re doing great! Welcome to SatoshiFrame channel.
✨ Today we’re diving into the 4-Hour Bitcoin analysis. Stay tuned and follow along!
👀 Looking at Bitcoin on the 4-hour timeframe, we can see that after breaking its multi-timeframe resistances, it is currently located near the price resistance of $115,793. If Bitcoin breaks this area, it can move toward its next resistance at $121,000.
🧮 Observing the RSI oscillator, we can see that it is currently in its OverBuy zone, and the important point here is to wait for it to exit the overbought area and form a new oscillation structure.
🎇 Pay attention to Bitcoin’s volume, which has been increasing up to this point. Even as it reaches the current resistance, buying volume is still rising and buyers are trying to push prices higher. But since there’s potential for selling pressure, we wait for volume to decrease a bit and allow the market to rest.
✍️ The scenario ahead for Bitcoin is independent of any trade or position, but we can use it to better understand Bitcoin’s corrective or resting behavior.
🛡 Bitcoin has just experienced a beautiful bullish leg across multi-timeframes, and the effects of this upward wave have also extended into higher timeframes such as the 4-hour and daily charts. Price, in a multi-timeframe structure, now requires a short-term correction and a pullback to fill lower buy orders. Keep in mind that traders typically take profit in such zones.
❤️ Disclaimer : This analysis is purely based on my personal opinion and I only trade if the stated triggers are activated .

BITCOIN – THE LAST DANCE AT THE BORDER OF DEATHTraders,
I believe Bitcoin is potentially setting up for a swing fail pattern around 117.500.
A swing fail pattern, very simply, is when price runs the previous high, takes out the liquidity sitting above it, and then fails to hold above that level. In other words, it clears the stops, shows strength for a moment, and then turns. It is the market taking a breath before it bites.
Here is how I see it and why I am positioned for shorts, not longs.
1. Structure into 117.500
The zone around 117.000 to 117.500 is, for me, the kill zone.
Why?
There is a clean previous high that has not been taken yet
There is visible imbalance from the last fast drop sitting in that band
We have London morning wick liquidity above us that I believe price still wants to clean
The math and harmonics I am running line up in the same area
When I say the math lines up I am talking about measured extensions and harmonics off the leg that started around 103k to 104k and impulsed higher. My 1.618 extension clusters around 116.7 to 117.5. The 1.272 and 1.414 levels already got respected on the way up. This last one is usually where you get the overextension and the last grab. On top of this, the 1.618 extension confluences with the HTF Golden Pocket.
We also sit right on top of what I call the border of death. Above 117.500 I do not want to see Bitcoin hold. If it does hold and build acceptance up there then this entire idea is invalidated and I will adapt. I am not married to bias. I am married to data.
2. Order flow and participation
Let us talk about what is behind this move, not just what it looks like.
Spot CVD is still depressed compared to the beginning of the run. That means real buyers paying cash are not the ones driving price higher. This is not a classic spot accumulation bid. This is not strong hands owning the level.
Stablecoin margined CVD and coin margined CVD both curled up into the most recent leg. So who is lifting price It is perps. Not investors, not patient buyers, just leverage.
Open Interest is also telling us a story.
Stablecoin margined OI is grinding back up into the highs.
Coin margined OI is starting to climb again.
That means people are adding new exposure on the way up. They are not just covering shorts anymore, they are now chasing longs into the high. This is where positioning gets fragile. The crowd thinks we are going to keep going. I start thinking about harvesting that belief.
The floor under us is not built by conviction. It is built by leverage.
We have seen this before. The desert looks quiet before the sandstorm picks up.
3. What I am expecting
I am expecting a sweep of the high into roughly 117.500.
Clean the liquidity. Fill the imbalance. Tap the last little pocket of inefficiency that is still sitting there. Show strength on the surface.
Then reject.
That rejection is the tell for me. If we push above the high and then snap back below it on force, that confirms the swing fail for me.
From there I am looking for rotation much lower.
4. The target zone if this plays out
If this plays out the way I think it can, I am looking toward 98k.
This is not a random number. That is basically the next meaningful pocket of imbalance below. That is the next unfair area that never got re tested. Price likes to rebalance. The market eventually revisits the places it skipped when it was moving too fast. We call it inefficiency but it is really just unfinished business.
Will it instantly teleport there No. This is a path idea, not a straight line prediction. But 98k is where I think equilibrium lives if this whole run unwinds.
5. Risk management and positioning
Because of this view I have adjusted.
My earlier thesis from October 16 is, in my eyes, no longer valid in its original form. Never say never, but I am not trading that idea anymore.
I have closed all long positions. I am no longer here to squeeze the upside. I am here to stalk shorts.
Does that mean I am instantly full size short here No.
I am not interested in guessing tops. I am interested in letting the market reach for the level I want, and only then taking the trade with data behind it.
If Bitcoin breaks through 117.500 and starts holding acceptance above that level, I will back off this idea. No ego. No stubbornness. I am here to survive. Survival is the only way you ever get to mastery.
6. Summary
I believe Bitcoin is setting up for a classic swing fail pattern at around 117.500. I think price will hunt that liquidity, stop out shorts, convince late longs they are right, and then turn. I think the next meaningful re balance sits much lower, around 98k.
This is not guaranteed. Nothing in trading is guaranteed. Trading is probability, not fantasy.
But right now the flow, the harmonics, the imbalance, the extensions, and the psychology of the crowd all rhyme in the same place.
And when the market whispers in the same tone across different tools, I listen. I am ThetaNomad.
