Bitcoin's massive fall to $50,000. OMGA massive bankruptcy for a strategy company with Bitcoin falling to $50,000, and this event will be the driving force behind the price explosion to $500,000 over the next 10 years, making it the biggest investment opportunity of the century. So, follow the market direction without bias and know that huge companies have gone bankrupt before with the fall of even gold, but gold has always recovered and remained a store of value, and this time it is Bitcoin's turn to test.
Patterns, fundamentals, technicals, and all indicators and oscillators confirm this scenario, so let's remain unbiased.
1-BTCUSD

BTCUSD – CHANNEL RESPECT & BULLISH CONTINUATION SCENARIO 📌 BTCUSD – CHANNEL RESPECT & BULLISH CONTINUATION SCENARIO (H1 Analysis)
1. Market Structure – Dow Theory Perspective
On the H1 timeframe:
- BTC has consistently printed Higher Highs (HH) and Higher Lows (HL) inside a well-defined ascending channel.
- The recent corrective move into the ENTRY ZONE aligns perfectly with the channel’s mid-support.
- Buyers have shown early signs of stepping back in, forming a localized HL and rejecting lower prices.
According to Dow Theory:
➡ An uptrend remains intact as long as price continues forming higher lows and doesn’t break key structure support.
➡ BTC is currently maintaining all bullish conditions.
This confirms that the pullback is structural, not a reversal.
2. Channel Confirmation & Price Reaction
The ascending channel remains active and respected:
✔ Price rejected the upper resistance of the channel
✔ A healthy retracement is ongoing
✔ The market is approaching the ENTRY ZONE with decreasing bearish momentum
The reaction behavior is typical of bullish continuation within a trend channel.
There is no sign of market breakdown as long as price stays above the SUPPORT ZONE.
3. Key Zones to Watch
🔹 Support Zone (Entry Zone)
Located at the mid-range of the channel — a high-probability area for buyers to return.
This zone has historically shown strong demand and fits perfectly into the channel geometry.
🔹 Resistance Zone
The upper boundary of the chart and liquidity zone.
This is where previous rejection occurred, and where TP2 & TP3 are aligned.
4. Bullish Scenario – Primary Outlook
BTC is expected to follow a standard:
pullback → bullish rejection → continuation upward structure.
🎯 TP1: Minor channel resistance (short-term reaction zone)
🎯 TP2: Previous strong resistance zone
🎯 TP3: Channel top & extended liquidity zone
As long as BTC holds above the SUPPORT / ENTRY ZONE, upward continuation remains the highest-probability scenario.
5. Alternative Scenario
If BTC breaks below the support zone:
- Price may retest the lower channel boundary
- Market would enter a deeper correction phase
- Trend remains bullish unless the lower channel is broken
This scenario is less likely but still important to consider.
6. Technical Summary
✔ BTC continues respecting the rising channel
✔ Price is forming clean HL patterns
✔ Pullback is controlled — not impulsive
✔ Liquidity targets remain untouched above
✔ Structure supports bullish continuation
Everything aligns with a high-probability bullish continuation setup.
🔥 Conclusion
BTC remains in a well-defined bullish channel, and current price action is moving exactly according to prior projections. As long as price stays above the SUPPORT / ENTRY ZONE, the market strongly favors an upward continuation toward TP1 → TP2 → TP3.
This is a clean, structure-based opportunity for channel traders, trend traders, and momentum traders alike.

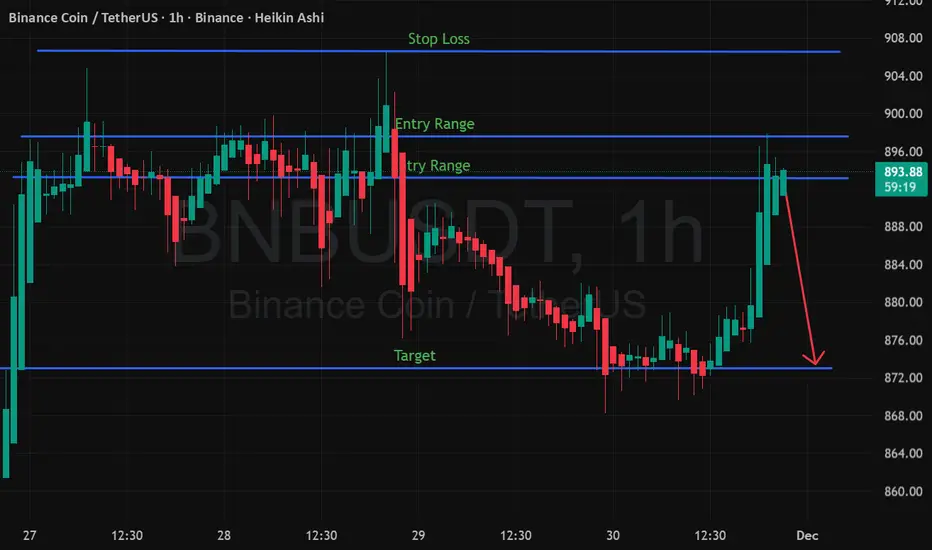
BNB Sell Signal Generated — Levels Inside🔽 Trade Setup
Sell Zone: 893 – 892
Stop Loss: 910
Target: 875
📊 Why This Matters
BNB has shown signs of weakening momentum near the upper resistance band. The recent candle structure plus volume behaviour suggests sellers are stepping in, creating a short opportunity in this zone.
🎯 Target Expectation
Price is expected to test the 875 support zone, where demand previously reacted strongly. Risk-to-reward remains favourable as long as price stays below 910.
⚠️ Risk Management
Always follow your SL and manage position size according to your strategy.
This is not financial advice — only for educational purposes.
Bitcoin to hit $32K($32000) level Feb 2022Bitcoin is expected to reach $32,000 level to finishing Head and shoulder pattern .

BTC Quick Outlook 2026As long as Bitcoin trades below 100K, downside pressure dominates. There’s roughly a 55% chance of dropping to 78–76K and about a 30% chance of a deeper fall to 70–66K. If these drops occur, the typical rebound target is 92–100K, and only a solid daily close above 100K opens the path toward 108–112K and potentially 116–124K. If price climbs without a deeper correction, the realistic ceiling remains 108–112K, with a stronger scenario reaching 116–124K.

Bitcoin prediction 2025-NovBitcoin price has a motive to buy and it's now retraced to a bullish order block as way of correcting price with same Bullish bias from earlier trade call.

BTCUSD 30M — Range Break Setup | Potential Downside RetracementBITSTAMP:BTCUSD
After an impulsive rally, BTC formed a distribution range near resistance. The recent lower-high rejection indicates sellers entering the market. If price breaks below the marked entry zone, bearish continuation becomes favorable toward key demand zones.
Key Scenarios
❌ Bearish Case (Primary Setup) 📉
Break and retest below the range low confirms continuation.
🎯 Target 1: 88,094
🎯 Target 2: 85,898
🎯 Extended Target: 80,560
✅ Bullish Invalidation 🚨
A clean breakout and holding above 91,200 shifts bias to bullish continuation toward 93,140.
Current Levels to Watch
Resistance 🔴: 91,200 – 93,140
Support 🟢: 88,094
Major Demand 🛡️: 80,560
⚠️ Disclaimer: This is for educational purposes only — not financial advice.

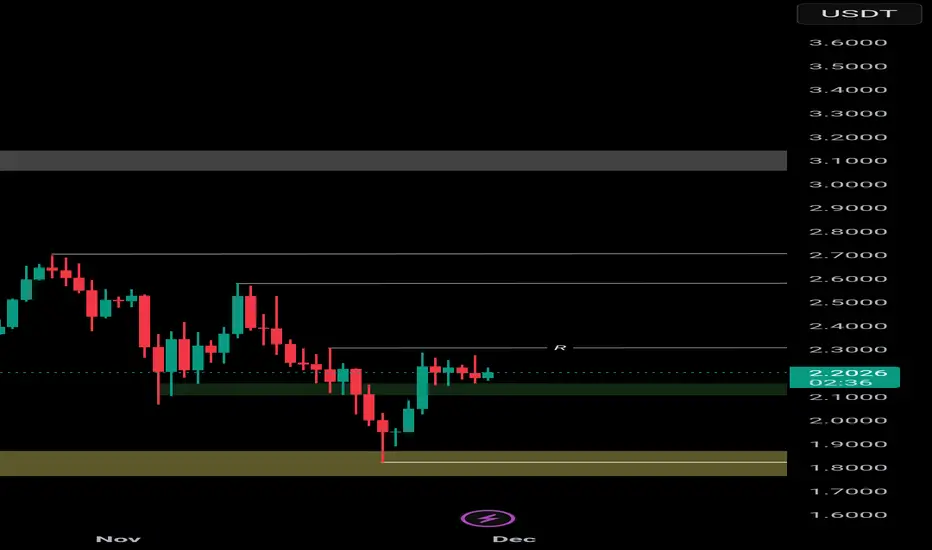
$XRP 𝗕𝗼𝘁𝘁𝗼𝗺 𝗙𝗼𝘂𝗻𝗱? 𝗡𝗲𝘅𝘁 𝗕𝗶𝗴 𝗥𝗮𝗹𝗹𝘆 𝗠𝗮After weeks of correction, XRP has found solid support around $2.10–$2.20, showing clear buyer strength. This level has held firm despite market pressure, suggesting the deeper corrective phase may be over and paving the way for a potential trend reversal. Long-term holders are stepping in, and fresh buying interest is growing as traders look for early entries.
▪️ Wave-5 Setup Strengthens
Technically, XRP appears to have completed a classic Wave-4 corrective pattern, often the precursor to a strong Wave-5 rally. Once momentum kicks in, Wave-5 can deliver significant upside.
🟢 Key levels to watch:
🔸 Resistance: $2.40–$2.60 — a clean daily close above this zone could confirm Wave-5 is underway.
🔸 Support: $2.10 — holding this level strengthens the bullish thesis; a drop below could delay the move.
▪️ Catalysts & Risks
✅ Strong support and momentum
✅ Completion of corrective structure
⚠️ Failure to break $2.50 resistance
⚠️ Broader market volatility
XRP is showing early signs that the bottom may be in. The coming days could reveal whether bulls are ready to take control.
BINANCE:XRPUSDT
BTC Short-Term 15m Chart📉 BTC 15M — Short-Term Analysis
1. Key Levels from the Chart
Support
$90,400–$90,450 – strong, repeatedly tested (orange zone).
$90,178 – lower support (thin red line).
$89,460 – deeper daily support.
Resistance
$90,900–$91,000 – local resistance zone.
$91,214–$91,545 – SMA 72 / SMA 200 (yellow and blue) = strong dynamic resistance.
$91,800–$92,200 – higher structural resistance.
🧠 2. Market Structure
Short-term trend (15m)
Price remains below the SMA 200 and SMA 72 → bearish momentum.
Lower highs and lower lows are visible → bearish structure.
Narrower range: 90,400 – 90,900 → price compression / consolidation.
📊 3. Indicators
MACD – neutral / slightly bearish
Histogram hovers around zero → lack of strong momentum.
Recent downward crossover → downward pressure.
RSI – 48 (neutral)
Not oversold yet, but:
RSI is forming a bearish divergence from previous highs.
RSI often bounces from 50 in a downtrend → confirms bearish pressure.
🔎 4. What's happening now?
The price is retesting the $90,400 zone, a key defensive level for bulls.
The structure indicates:
supply pressure,
buyers exhausting themselves below the 200 SMA,
possible breakout below if 90,400 breaks.
🎯 5. Short-Term Scenarios (15m)
🔻 Bearish Scenario (more likely)
If 90,400 falls:
Target 1: 90,180
Target 2: 89,460
Target 3: 88,960
The structure strongly suggests this because:
Price below the 200 SMA
Weak momentum
No strong rebound from the lows
🔼 Bullish Scenario (only after breaking 90,900)
If the market rebounds from 90,400 and breaks 90,900:
Target 1: 91,200 (SMA 72 + 200)
Target 2: 91,550
Target 3: 91 800

BTC Short Supply Zone Rejection BTCUSD – Short Setup Explained (Smart Money Concept)
Price is currently trading inside a **minor consolidation zone**, showing weak bullish momentum. Market structure suggests a possible **liquidity grab** before a strong move down.
**🟧 Key Points:**
* Price may push up into the **upper supply zone** to collect liquidity.
* After grabbing liquidity, a **sharp rejection** is expected.
* Confirmation will come once price breaks below the **mid-range demand zone**.
* Final target is the **major demand zone** below, where buyers previously stepped in.
Trade Idea:**
* **Entry:** After liquidity sweep at supply
* **Stop-Loss:** Above supply zone
* **Take-Profit:** Major demand zone (bottom support)
**Bearish** – Expecting a pullback after liquidity sweep

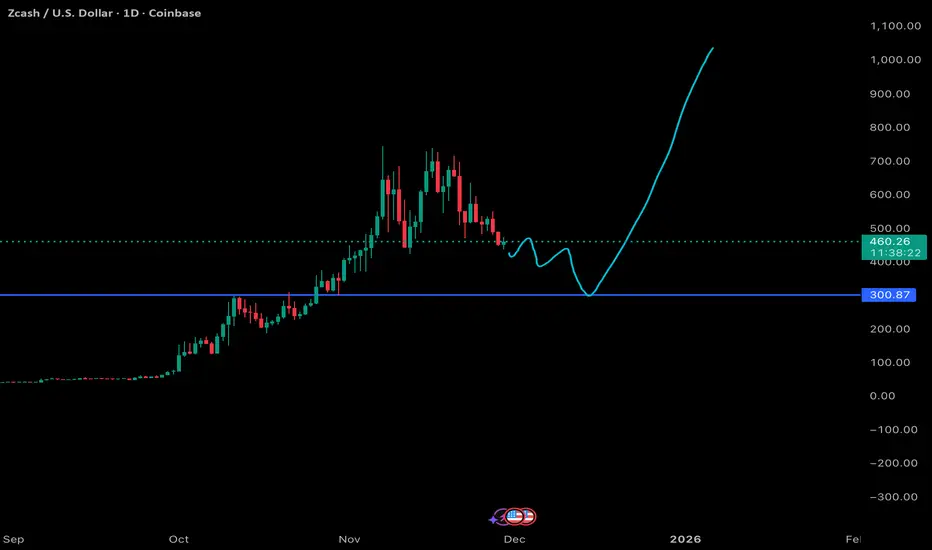
ZEC Update - My thoughts heading into Nov 29 2025 Weekend ZEC is grinding lower with momentum still favoring sellers. The structure is cleanly pointing toward the 300 zone, which lines up as the next high conviction support.
Until price tags that level, ZEC likely keeps lagging and chopping in a controlled bleed. A reaction or base is most probable only once that 300 level is tested, where a stronger bounce could finally develop.
TURBO/USDT : SELLHello friends
Given the good pump we had, this currency was unable to stabilize the price above the specified resistance, which means that buyers were unable to decisively break the resistance and when this happens, the price can correct.
This analysis is purely from a technical perspective and is not a buy or sell recommendation.
*Trade safely with us*

BITCOIN Has the price reached the bottom ?!Despite the rise that is happening now, I still see more downsides
I expect to see a test of 13.800$
This support is very important and we should not see the closing of a month candle below it
The situation of the global economy is not good, so I do not expect to see large liquidity entering the markets in these months
Please support the idea by pressing the like button and writing your opinion in the comment box
Good luck 🌹

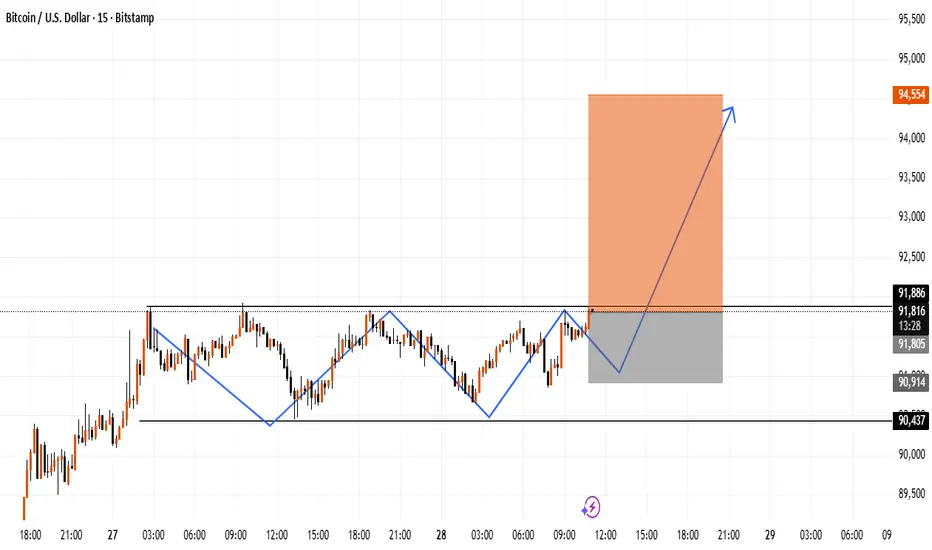
BTC Short-Term Structure Break With Potential Upside ExpansionThis chart highlights a short-term range on BTC where price has been reacting around the same horizontal zone multiple times. A clear internal structure shift can be seen, followed by a deeper pullback into the recent demand area. If price maintains support above this zone, it may open room for an upside continuation toward the next liquidity level.
The marked move is a possible price scenario, not a certainty.
This idea is shared for market observation and educational analysis only.
BTCUSDT - What's Next? Bullish is over???BTC Daily & 4H Outlook
Bitcoin is showing mixed signals across the 1D and 4H timeframes. On the daily chart, BTC failed to hold the strong support zone and has now officially flipped it into a resistance. The drop also swept liquidity down to the 80.600 area before rebounding from the daily OB, which gives us a temporary relief bounce. Right now, price is pushing upward and may retest the resistance/supply zone above.
If BTC rejects strongly from that resistance, the market could be in trouble again because the downside target reopens toward the 83k–86k region. This area becomes even more important when we look at the 4H chart, where we still have a key support between 85.650–85.000. This zone must hold—if it breaks, then 83k becomes likely, and a worst-case scenario returns us to the 80k sweep zone.
For BTC to reclaim momentum and shift into a bullish structure, the market needs to break out above the major supply at 93.240. A clean breakout and confirmation would show strength and could trigger the next leg toward 98k–100k. If that happens, we may also see a strong positive impact on altcoins.

Delta son goes to his mommy Just fantasies with no basis. A dream.
---
Hang Glider
High on the ridge I run and leap,
The ground falls back, the winds unfold;
My fragile wings no longer sleep,
They tense and sing in currents cold.
I carve a path through open blue,
A silent frame, a borrowed sky;
For just one glide I feel it’s true:
The earth can live without me, I.

BTC. End of correction long.Only if we can take the 94.6 level the true long confirmed. Otherway it flat between 85 -95 +/-

btcIt is currently moving in the green and red box area. It has grown by 14% since we said to buy. To reach the red lines, it must not miss the green box and break the red box at the same time. Otherwise, we will return to the previous area.

BTCUSD _ Daily
Fake breakout or starting a range!
Price reacted on the resistant area on lower timeframes, expected to touch the resistance line again in near future.
BTC : Channel Breakdown RetestPrice has come back to retest the broken channel and is being rejected again. What matters now is to see if buyers can sustain follow‑through, because that will decide if this is just a relief bounce or the start of a real reversal. For now, it still looks like nothing more than a bounce.
Historically, when Bitcoin reaches oversold territory on the daily RSI, it often forms a bullish divergence rather than reversing immediately on the first oversold tag, price makes a lower low while RSI prints a higher low.
My scenario anticipates another push down in price while RSI refuses to make a new low, creating a classic bullish divergence that frequently precedes strong relief rallies.
This price action still fits my broader strategy, as the current rejection and potential bullish divergence keep the scenario alive for another leg up in December, with upside potential toward at least the 115k

BTCUSD | Rejected BTCUSD dropped when reaching my zone I posted in one of my other ideas.
Looking for BTCUSD to make move down from here and make a new low.
Let me know what you think!
Stay safe out there and do your own due diligence, this is not investment advise!

Bitcoin - The classic bullrun top creation!🗿Bitcoin ( CRYPTO:BTCUSD ) created the bullrun top:
🔎Analysis summary:
A couple of weeks ago, Bitcoin retested a major decade long resistance curve. Since Bitcoin then already created bearish confirmation, we are currently seeing an expected crackdown. Considering all the underlying trends, this bearish cycle is still not over yet.
📝Levels to watch:
$70,000 and $50,000
SwingTraderPhil
SwingTrading.Simplified. | Investing.Simplified. | #LONGTERMVISION

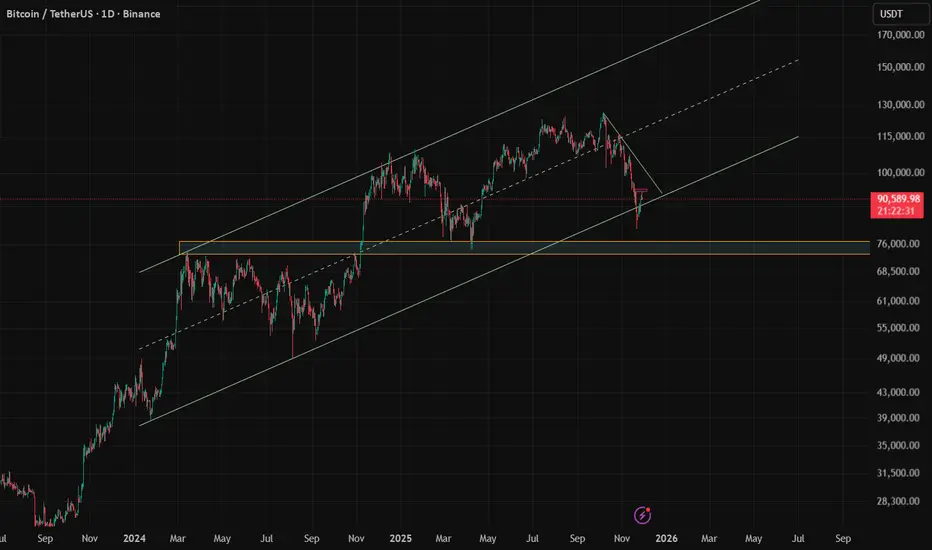
Back in the Channel – Eyes on New ATHs AheadBitcoin: Back in the Channel – Eyes on New ATHs Ahead 🚀
We're slowly seeing confidence return… and this is not just another bounce. This chart shows BTC reclaiming the massive ascending channel that has governed price action since early 2023. Price just wicked perfectly back into structure — a key reclaim above 88,652 has flipped the narrative back in the bulls' favor. 📈
Three key things stand out:
Channel structure is intact — this is a clean re-entry.
Support held above 88,652 — major validation point.
Targets now shift to 115,054 → 124,144 → 138,800 — each level has history and structure behind it.
New ATHs may not come tomorrow, but with this kind of technical structure, early 2026 could bring serious fireworks . If the bulls stay disciplined, this is a textbook reaccumulation setup inside a macro trend.
Longs are valid as long as we hold above 88,652. Let price do the talking.
Thought of the Day 💡
Respect the structure, not the emotions. Charts like this don’t lie — it's the humans that waver. The higher the timeframe, the stronger the truth.
Disclaimer: What you read here is not financial advice — it’s high-level market philosophy from the FXPROFESSOR himself. Risk is real, and your capital is your responsibility. Learn, adapt, evolve.
One Love,
The FXPROFESSOR 💙
My worries: 79k was NOT checked as support And that is the major support on my chart. There is still over 40% likely that we need to check that 79k level.... but hey: i will be LONG over 88,652 — eyes on 115K → 124K → 138K 🚀 (just remember to play the levels: long over/short under!)
