BTC 4H Analysis | Day 8🥳 Hey everyone! Hope you’re doing great! Welcome to SatoshiFrame channel.
✨ Today we’re diving into the 1-Hour Bitcoin analysis. Stay tuned and follow along!
👀 On Bitcoin’s 4-hour time frame, as shown in the chart, we can see that after a series of declines, Bitcoin has consolidated inside a large 4H range (box). This box has been classified by traders and is currently being “priced in” for the market’s next move. For now, price is still some distance from the top of the box, but the mid-range area, where price is currently hovering, could be a good zone for a potential long setup.
⛏ Multi time frame levels (1H and 15M) have already triggered signals for traders, and price is now moving toward $111,144. A breakout above this level could confirm a long entry. However, breaking this resistance may be challenging and could have a lower win rate, so we’ll use a more conservative risk approach for this move.
🧮 Looking at the RSI oscillator, it’s forming a short-term oscillating resistance near the overbought zone. The 65 level aligns beautifully with the $111,144 price resistance, meaning if RSI breaks above this threshold, that resistance could be taken out, allowing momentum to push further into the overbought region.
🕯 Bitcoin’s volume over the past few days has been strong enough to support powerful moves, but the activity has been mostly indecisive, aimed at liquidity collection within the range. If you pay close attention, you’ll notice extremely precise triggers forming at the box’s highs and lows. In short, large amounts of capital that are expected to exit gold are still in a phase of indecision, and Bitcoin hasn’t yet absorbed that risk capital.
🧠 I’m considering two main scenarios for Bitcoin’s position:
🟢 Scenario 1
Breakout above the $111,144 resistance, accompanied by RSI crossing above 65 and a noticeable increase in buy volume, signaling intent for a Bitcoin pump.
🟢 Scenario 2
Set a buy stop with a larger stop size, staying positioned for a gradual breakout. As Bitcoin breaks higher levels, we can scale in with additional volume.
❤️ Disclaimer : This analysis is purely based on my personal opinion and I only trade if the stated triggers are activated .
1-BTCUSD

BTCUSD H1 | Price Approaching 61.8% Fibonacci ResistanceBased on the H1 chart analysis, we could see the price rise to the sell entry which is a pullback resistance that aligns with the 61.8% Fibonacci retracement and could reverse from this level to the downside.
Sell entry is at 111,337.31, which is a pullback resistance that aligns with the 61.8% Fibonacci retracement.
Stop loss is at 113,598.16, which is a pullback resistance.
Take profit is at 104,475.94, which is a swing low support.
Stratos Markets Limited (tradu.com ):
CFDs are complex instruments and come with a high risk of losing money rapidly due to leverage. 68% of retail investor accounts lose money when trading CFDs with this provider. You should consider whether you understand how CFDs work and whether you can afford to take the high risk of losing your money.
Stratos Europe Ltd (tradu.com ):
CFDs are complex instruments and come with a high risk of losing money rapidly due to leverage. 70% of retail investor accounts lose money when trading CFDs with this provider. You should consider whether you understand how CFDs work and whether you can afford to take the high risk of losing your money.

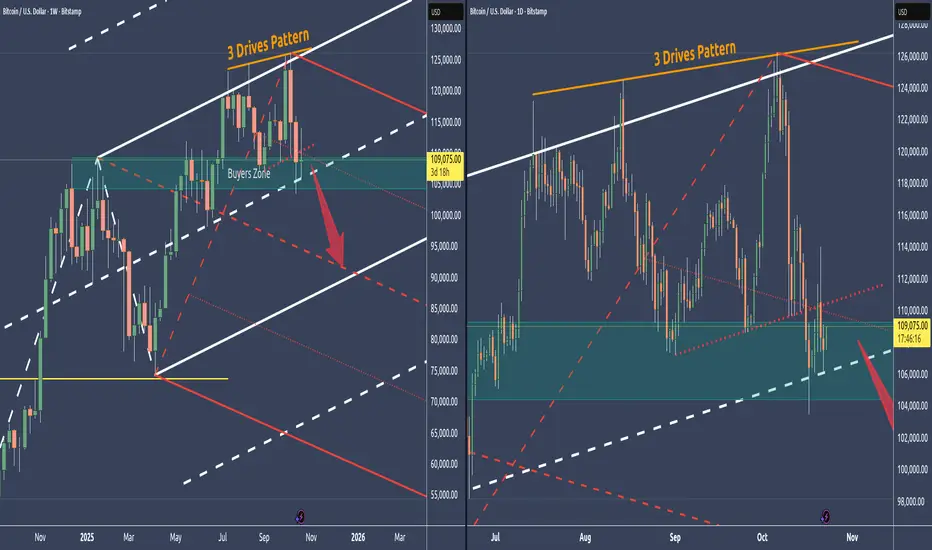
Bitcoin - We've reached the last line of support🔱 The Buyers’ Zone represents the last major support before price potentially drops toward the red centerline. 🔱
👉 The 3-Drives pattern, signaling exhaustion in the current move.
👉 Broader markets are highly stretched; a broader trend reversal would likely pull Bitcoin down with it.
👉 The slanted support line in the dayli chart is now resistance that could not be washed away.
Given these conditions, there’s a strong possibility that this final support zone won’t hold, leading to a deeper flush.
For targets I see the red Centerline, and even the L-MLH, which gives us a natural support.
Stay sharp and trade safe—wishing you a profitable week ahead
OIl rised.OIL moved as we had analyzed. Possibly could rise more before rhe markets closed this week.

Stop!Loss|Market View: BTCUSD🙌 Stop!Loss team welcomes you❗️
In this post, we're going to talk about the near-term outlook for the BTCUSD ☝️
Potential trade setup:
🔔Entry level: 107751.78
💰TP: 96726.16
⛔️SL: 114171.76
"Market View" - a brief analysis of trading instruments, covering the most important aspects of the FOREX market.
👇 In the comments 👇 you can type the trading instrument you'd like to analyze, and we'll talk about it in our next posts.
💬 Description: The main scenario for sell via a breakout of the lower border of the global accumulation of 110,000 - 122,000 remains. The price has already tested the lower border 4 times, indicating clear seller initiative. Following a downward breakout, the price is expected to approach at least the 100,000. A target near 90,000 is also looked for.
Thanks for your support 🚀
Profits for all ✅
❗️ Updates on this idea can be found below 👇

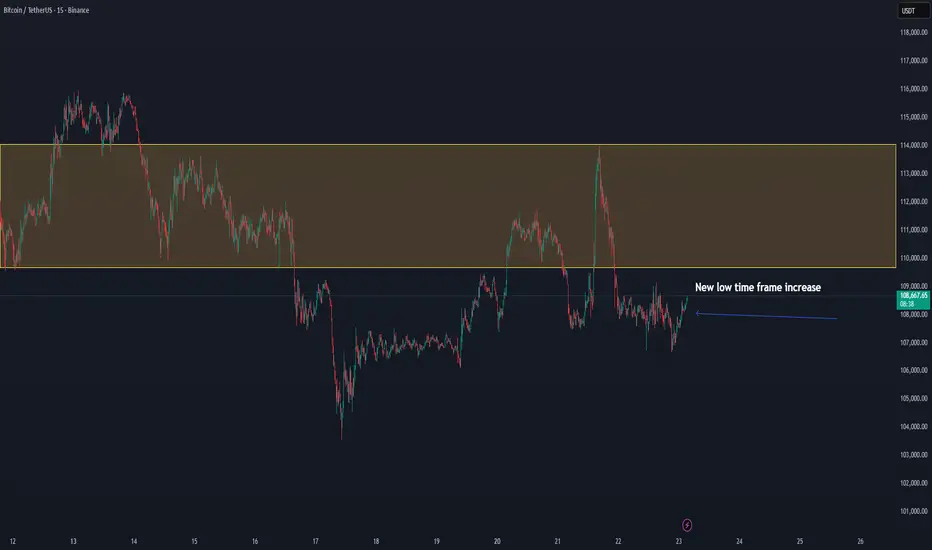
BTC/USDT — New Low-Timeframe Expansion Forming, Potential 114k+Bitcoin is beginning to show strength in the new low-timeframe structure, reclaiming the $108K zone with rising momentum. This confirms a short-term bullish shift after the recent consolidation.
The key resistance range between $110K–$114K remains the main obstacle, but if BTC maintains higher lows and continues to push within this structure, a move toward $118K becomes likely.
📊 Technical Overview:
Support: $106K–$108K
Range Resistance: $110K–$114K
Next Upside Target: $118K
Bias: Bullish on low-timeframe momentum
BTC’s ability to sustain above the $108K region suggests growing buyer confidence — confirmation above $110K could trigger continuation toward the upper range.
📈 Outlook: Low-timeframe expansion
🎯 Targets: $110K → $114K → $118K
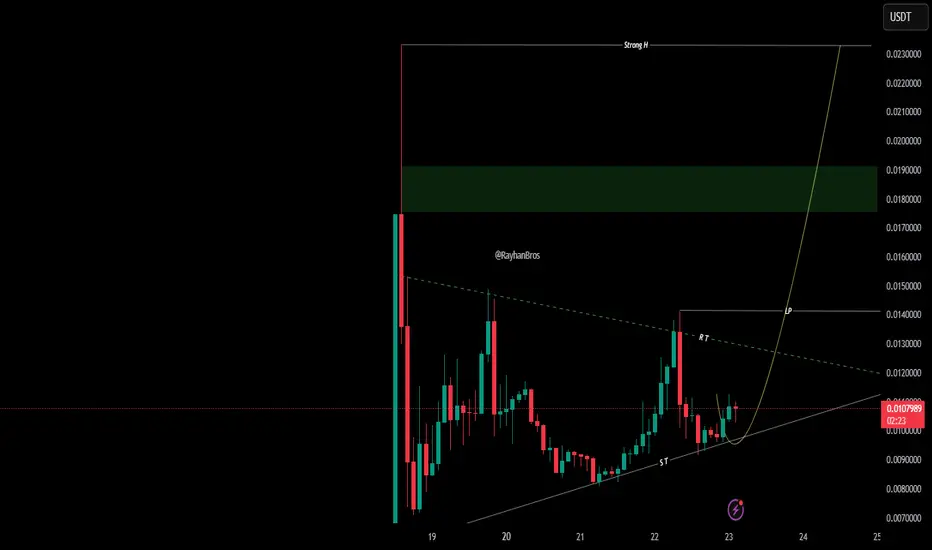
$RVV Breakout Watch
Looks like the rocket’s fueling up 🚀—chart says it loud and clear! BITGET:RVVUSDT
$EPT/USDT is showing early signs of a breakout attempt, $EPT/USDT is showing early signs of a breakout attempt, but confirmation is still pending. If the price stays above 0.00382, a pump is possible, but any drop below this level could weaken the setup and invite more selling pressure. A sustained close above 0.00382 could trigger momentum toward 0.005–0.006.

Bitcoin Needs To Roll Over Soon To Avoid Short-Covering RallyWhile I believe Bitcoin still has further downside potential in the coming weeks, there’s also scope for a near-term bounce based on how futures traders are currently positioned.
Matt Simpson, Market Analyst at City Index and Forex.com.

EUR/USD Approaching Critical Zones: What’s Next? On the upside, the key resistance zone around 1.1880–1.1900 has capped rallies multiple times. A break above this level could open the door for a strong upward move.
On the downside, if price fails to hold the ascending support line, it could drop toward the key support zone around 1.1300–1.1350.
Summary: Watch how price reacts around the ascending support line, this will likely dictate the next big move.
DYOR, NFA
Thanks for reading! Appreciate your support and engagement 🙏

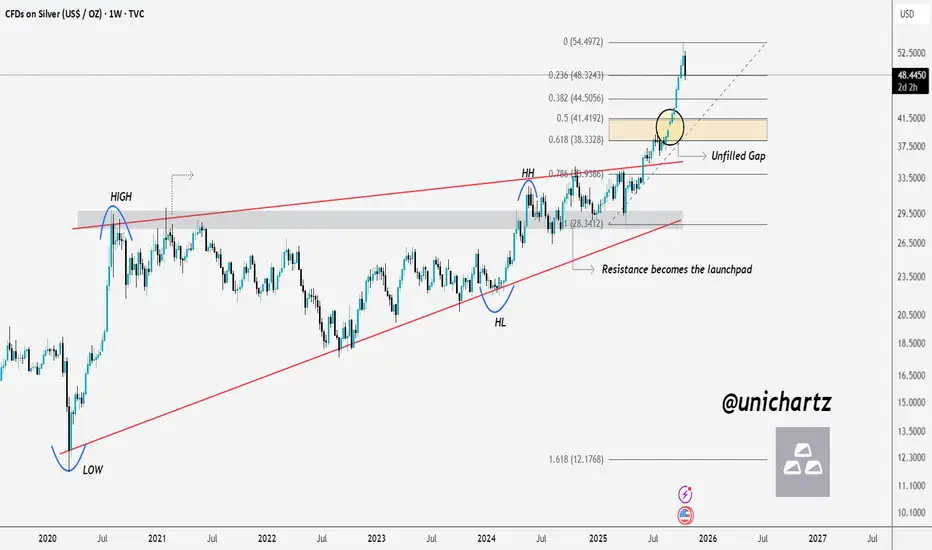
Correction Incoming – Silver Eyes Fib ZoneSILVER Weekly Analysis 🪙
At first, Silver faced strong rejection from the resistance zone, but once it finally broke out, the price came back to retest that same resistance — which then turned into a powerful launchpad, sending prices to new all-time highs.
Currently, the price is showing early signs of a correction. I’m expecting a possible retest of the Golden Fib Zone (0.5–0.618), where there’s also an unfilled gap near the 0.5 level. A move toward that area would make sense before the next major leg higher.
Resistance becomes the launchpad.
DYOR, NFA
Thanks for reading! Appreciate your support and engagement 🙏
BTC in an Rising Wedge patter pattern?If this Rising wedge pattern is correct, and BTC loses volume we can see it drop 30+%. Double top around 110-111k probable.

MAV/USDT; SAFE BUYHello friends
Given the decline that this currency has had, we have found support areas using Fibonacci and have created a double bottom in the specified area and are expecting it to break its trading range and move to the specified targets.
Observe capital and risk management.
*Trade safely with us*

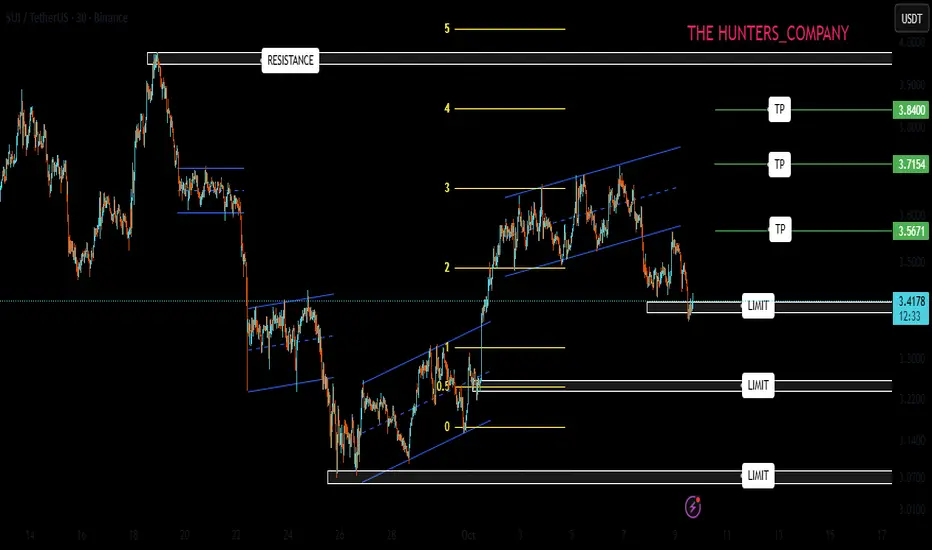
SUI/USDT ; A decline is the best buying opportunity.Hello friends
Given the price decline that we are witnessing, the price has created good channels at the specified support and buyers have entered and supported the price, which is a good sign for the currency.
Now, given the trend reversal and the price being pushed up by buyers, we can buy in steps with risk and capital management and move towards the specified targets.
We have also identified an important level that if the price reaches it, a correction can be expected and it is very important to take profits in these areas.
*Trade safely with us*
BITCOIN SIGNAL: NEXT MASSIVE MOVE IN THIS DIRECTION IS FORMING!!Yello Paradisers, I hope you are doing fine. This is a video for you. Enjoy. I hope you are enjoying it. Smash the rocket button if you want. I will see you again next time. You can also share this video. I will be retweeting everybody who gonna mention me and TradingView.
And Paradisers! Keep in mind to trade only with a proper professional trading strategy. Wait for confirmations. Play with tactics. This is the only way you can be long-term profitable.
Remember, don’t trade without confirmations. Wait for them before creating a trade. Be disciplined, patient, and emotionally controlled. Only trade the highest probability setups with the greatest risk to reward ratio. This will ensure that you become a long-term profitable professional trader.
Don't be a gambler. Don't try to get rich quick. Make sure that your trading is professionally based on proper strategies and trade tactics.

BITCOIN (BTCUSD): Bullish Move From Support Confirmed?!
There is a high probability, that Bitcoin will bounce from
a key intraday horizontal support.
As a confirmation, I see a valid bullish CHoCH and a breakout
of a resistance line of a falling parallel channel.
I expect growth at least to 110.800 level.
❤️Please, support my work with like, thank you!❤️
I am part of Trade Nation's Influencer program and receive a monthly fee for using their TradingView charts in my analysis.

BITCOIN - Clear bearish sign!Bitcoin is currently forming a clear corrective pattern — a rising wedge that has broken downward, retested the breakdown, and is now continuing a gradual decline.
This correction is expected to bottom around the $85K level, after which Bitcoin will likely enter a consolidation phase, form new structures, and we’ll keep updating the outlook as new developments occur.
Also, note that the EMA 25 just crossed below the EMA 50, forming a death cross — a bearish signal.
You can consider entering a short position from here, but keep your leverage low and wait for a slight pullback before entering the trade.
Many people won’t like what I’m saying — they’ll tell you “Bitcoin is heading to $200K!” — but that’s just the nature of the market. Everyone sees what they want to see.
Corrections, retracements, and emotional reactions are all part of the cycle. The smart ones are those who read the structure, not the hype.
Best Regards:
Ceciliones🎯

BTCUSD SHORT Jan.1 You try, 2026. jan 1. Short position
Target 1
Target 2
Target 3
check out my profile!
Easy!

BTC 1H Analysis | Day 7🥳 Hey everyone! Hope you’re doing great! Welcome to SatoshiFrame channel.
✨ Today we’re diving into the 1-Hour Bitcoin analysis. Stay tuned and follow along!
👀 On the one-hour timeframe of Bitcoin, we can see that after last night’s pump, Bitcoin failed to break through the resistance zone at $113,400 and was rejected downward from this area. It’s currently sitting at its support floor around $107,537, and losing this level could lead to a further decline.
🧮 The RSI oscillator has now formed two important zones — 50 and 38 — and when the fluctuation limit crosses these zones, Bitcoin may start its next move with increased volatility.
🕯 Last night, Bitcoin had good buying volume while approaching its resistance, but the key point was that it was then pushed down sharply by heavy selling pressure, losing even its multi–timeframe support floors. Keep in mind that Bitcoin needs an increase in buying or selling volume to break through these identified levels.
🧠 I’ve explained the upcoming Bitcoin scenarios in the following paragraph.
🟢 Long Position Scenario: A breakout of the nearest resistance zone at $109,383, along with the RSI crossing above the 50 level and buying pressure strong enough to absorb all the sell orders in this area.
🔴 Short Position Scenario: The current level Bitcoin is sitting at is a very critical support. Losing this support at $107,537, combined with the RSI dropping below 38 and increased selling pressure, could trigger a continued downward move, pushing Bitcoin toward its lower support zones.
❤️ Disclaimer : This analysis is purely based on my personal opinion and I only trade if the stated triggers are activated .

C'mon Do something! -BTCC’mon… do something! 😤
This sideways phase = pure laziness.
So, 100k test incoming or not? 🧐
#Bitcoin

btc on buy reverse#BTCUSD we await price to drop below 107851 to buy, which will retrace back 110150.
Buy limit at 107851, target 109533-110150, stop loss 106900.
Below 106800 holds continuation on sell target 103k

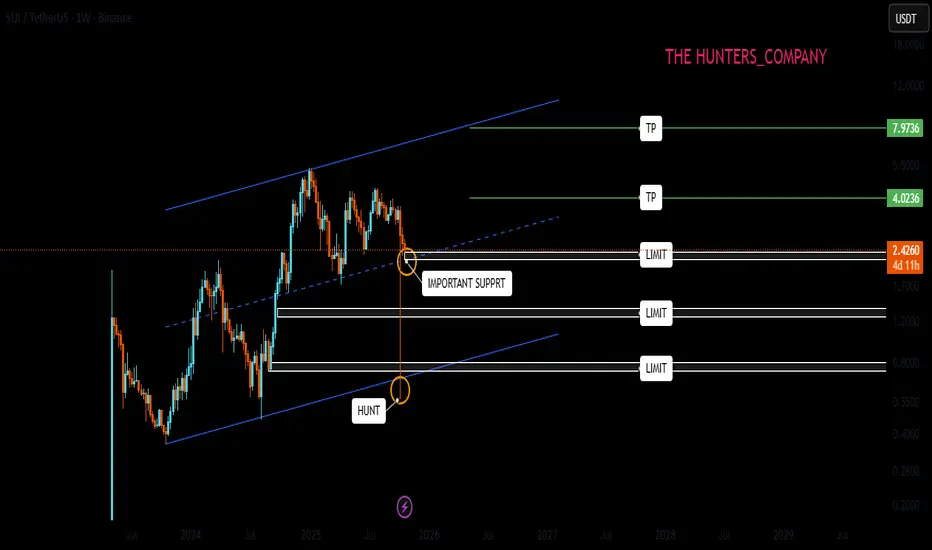
SUI ; The future of SUIHello friends
You see a long-term weekly channel that after setting a new ceiling in the weekly, the price corrected until the bottom of the channel even came below the channel, which many thought was destroyed, but the price returned and is now in an important range.
This weekly candle that guided you to the bottom of the channel is very important. There are many orders in the shadow of this candle and it is possible that the price will correct up to 50% of the shadow of the candle.
For this reason, the best way to buy is to manage risk and capital, and buy in steps in the specified areas and move with it to the set goals.
*Trade safely with us*
Bitcoin Daily Analysis – October 22, 2025🟠Bitcoin remains in a phase of uncertainty, with market sentiment heavily influenced by global macro events. Developments around interest rate decisions, U.S.–China tariff policies, and ongoing geopolitical tensions in the Middle East could all play a decisive role in shaping Bitcoin’s next move.
🕰️ In this phase, patience is the key to success — avoid rushing into large positions until we see clearer confirmation of trend direction and market risk appetite.
🎯 Until the broader trend becomes more defined, traders can take advantage of short-term long and short triggers on lower timeframes, while maintaining strict risk management and discipline.
Disclaimer:
This content is for informational purposes only and does not constitute financial or investment advice. © DIBAPRISM
Larry D.Kohn
