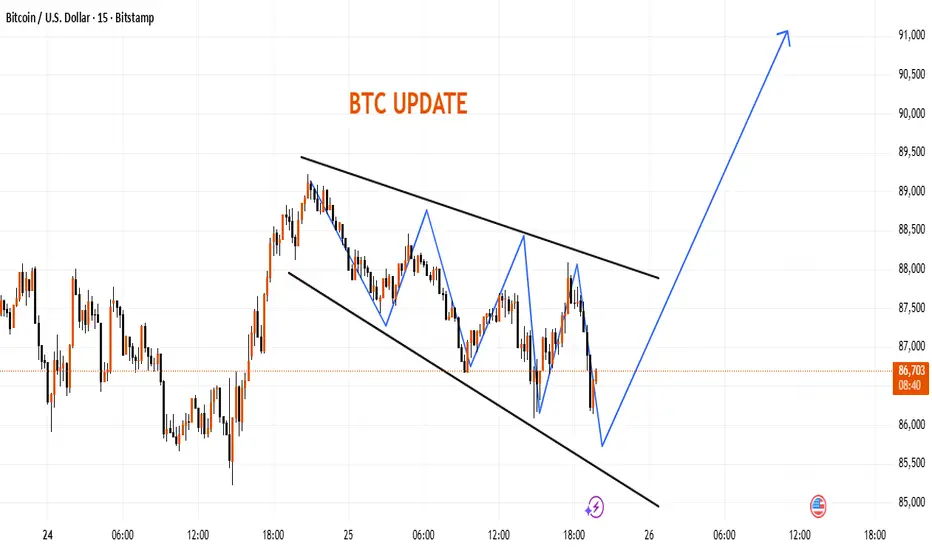
BTC/USD (1H Timeframe) ...📌 BTC/USD (1H Timeframe) – Target Analysis
My chart shows:
Price moving above an ascending trendline
Price breaking above the Ichimoku cloud
A clean space above for an upward move
This setup indicates bullish continuation.
---
🎯 BTC Target (Based on my Chart)
✔ Main Target
$91,500 – $92,000
This matches the “Target Point” my marked and is a valid resistance zone based on the chart structure.
---
📈 Why This Target Is Valid
Price is holding above my trendline support
Price has broken out of the cloud, indicating bullish momentum
No major resistance between $87,500 → $91,500
---
📌 Suggested Trade Plan
Entry: Already near breakout zone ($87,000 – $87,600)
Stop-Loss: Below trendline / cloud → $85,800 – $86,200
Take Profit: $91,500 – $92,000
1-BTCUSD

BTCUSD — Bullish Above 82,725 With Long-Term Target at 141,300BTC remains bullish as long as price holds above the key support at 82,725. This zone is the base of the current structure, and maintaining it keeps the long-term target at 141,300 in play. In a bearish scenario, price cannot break above the key support zone; any move toward it while trading below is only a corrective bounce. Holding above 82,725 supports continuation toward 93,723, 103,830, and ultimately 141,300,

Bitcoin Extends Its Downward Pressure as Sellers Stay FirmBitcoin remains pinned under selling pressure as expectations for a potential Fed rate cut in December have yet to translate into real policy action. Although several Fed members have softened their tone, the current interest-rate environment continues to discourage capital inflows into risk assets, leaving BTC without a solid catalyst for a rebound.
Market liquidity is still weak, institutional flows show consistent outflows, and investor sentiment leans toward caution. With no strong driver to counter this defensive mood, Bitcoin continues to follow the broader risk-off trend.
Technically, the H4 chart preserves a bearish structure, defined by a sequence of lower highs and lower lows. Repeated red FVG zones overhead signal active selling pressure, while the Volume Profile reflects distribution rather than accumulation.
Given the alignment of macro signals and chart behavior, the downside remains the dominant scenario. The next key level is the 86,000 USD support area; a breakdown there would likely open the path toward 84,000 USD.

$BTC: BOTTOMING ATTEMPT I highlighted the Double Top formation with a target of 89,000, which has now been surpassed. Technically, the long-term uptrend has been significantly weakened by the loss of the trend line that connected the HIGHER LOWS lows since August 2024. Bitcoin (BTC) has not been this oversold since June 2022. Currently, BTC shows three consecutive weekly candlesticks below the lower Bollinger Band. Today, we observed a slight improvement in the likelihood of a market bottom, as BTC reclaimed the 89,000-resistance level with a sudden rise. It is crucial to maintain the current weekly higher low at 85,200. A short covering squeeze could help push the price to the resistance level at 98,250, where the 0.382 retracement lies, and there appears to be a potential air pocket.
The market would benefit from the Federal Reserve's supportive measures to enhance liquidity and drive momentum higher.
Positive news for BTC includes:
• The probability of a December rate cut has risen to 85%, up from 30% one week ago.
• There are reports of potential discussions to replace Fed Chair Powell.
• Former President Trump’s reported candidate: Kevin Hassett (an ally known for a pro-tariff approach and dovish stance).
Takeaway:
Today's recovery above the 89,000-resistance level modestly increases the likelihood of a market bottom. The current weekly higher low at 85,200 must be preserved. A short-covering rally could facilitate further gains toward the next resistance at 98,250, which aligns with the 0.382 retracement level, as there may be a potential air pocket.

Bitcoin: Internal countermoveBitcoin currently appears to be forming an internal countermove within the ongoing orange wave a. Nevertheless, our primary outlook remains that this a-wave will ultimately extend into our green Target Zone, which ranges from $62,395 to $51,323. From this low, we expect another corrective move to the upside before the final downward leg of the wave (ii) correction—an overall pattern that has been developing since January—reaches completion.

Downside protected, upside unprotected — BTC to 500kThere's a ton of intriguing action unfolding with Bitcoin right now. Several cycle low indicators I track have started firing off around the $80K mark—pretty wild if you ask me. Let's break them down step by step.
1. 2-Week RSI Signal
It's a straightforward fact: the two-week RSI is sitting at 42, a level that has consistently marked cycle lows in the past. So, at $80K, we've got our first major cycle low signal.
2. Fear & Greed Index
Historically, after a cycle top, the first wave down has driven the Fear & Greed Index to a reading of 10 in the last two cycles.
The rest of the time? It's signalled cycle lows or major bottoms ahead of massive rallies.
#### What This Means: History Rhyming (Again)
This setup screams repetition—Bitcoin has now topped out after exactly 1,064 days, mirroring the last two cycles. On this first corrective wave, Fear & Greed has already plunged to 10. But here's where it gets really telling: layer in the Sharpe ratio for some nuance.
As the chart shows, the Sharpe ratio has dipped into negative territory—a rare event that *only* occurs during true cycle lows.
Invalidation & Bear Market Confirmation
The chart makes it crystal clear: Bitcoin is primed to echo the last cycle's playbook, with a full rejection at the 0.382 Fibonacci retracement. In the prior two cycles, after the initial drop from the cycle high, any subsequent rally completely fizzled out right there at 0.382.
If Bitcoin fails to rally and close decisively above that level by mid-January 2026, the odds skyrocket for a full-blown bear market. Keep an eye on it—this could be the pivot that defines the next leg.
What do you think then?
500k or 67k by October 2026?
Still fully on the upside boat. Risk is heavily skewed to the top side, not down

Bitcoin short term.Think simple. Basic 5 waves Elliot.
* The purpose of my graphic drawings is purely educational.
* What i write here is not an investment advice. Please do your own research before investing in any asset.
* Never take my personal opinions as investment advice, you may lose your money.

The trendline that's bounced 100%+ twiceBTC just tagged the 2022 ascending support on the weekly. Touched twice before — Sept 2023 and Aug 2024 — both led to 100%+ rallies. Third touch now at $85-90K. History doesn't repeat, but it rhymes. Eyes on this level.

BTC - WEEKLY ANALYSISCOINBASE:BTCUSD BINANCE:BTCUSDT
BTC saw strong volume today, and some other coins also showed strength — but is this a reversal or a trap? Let's analyze it
BTC recently made a low at 80,524, after which a reversal candle formed and the market showed strength. Now, if BTC breaks the recent low again, then the next long setup will form between 74–77k. If the low does not break and the price moves directly upward, then the 90.7k–94.4k zone is a sideways zone where you shouldn’t open long or short positions because the movement will likely be limited. Just above that, the 96.2k–101.5k zone acts as a bearish zone, and a rejection can be expected from there
If the market forms red candles in this bearish zone, I will short with a 106.4k stop-loss, keeping leverage and margin low

mrmoney limited BITCOIN trading ideabitcoin is in a strong bullish momentum since it tapped into our monthly demand zone giving us a overall bullish moves

Difficult and imperfect swing trade setup on BTCUSD dailyCOINBASE:BTCUSD has broken below its rising channel and is now exhibiting a downward trajectory. This shift creates a potential swing-trading opportunity arising from two distinct scenarios:
A reversal of the current downward trend, leading to a renewed bullish movement, or
A temporary pullback within the continuation of a broader bearish trend.
On the weekly timeframe, the first major traditional moving average above the current price is the 50-week moving average, positioned at approximately 100,000 USD. The daily chart reflects a similar structure: the nearest significant moving average above is again the 50-day moving average, also situated near 100,000 USD. This alignment establishes a notable—albeit high-risk—swing-trade setup. Should the price initiate even a micro bullish trend within a larger bearish context, the most probable target for such a move would be a reversion toward the 50 DMA at around 100,000 USD.
Supporting this thesis, several momentum indicators—specifically the RSI, Rate of Change (ROC), and MACD—are beginning to turn upward from recent troughs. This emerging positive momentum suggests that underlying buying strength may be forming, which would be consistent with the early stages of a bullish swing within a broader bearish structure.
A potential entry trigger on the daily chart would occur once price breaks above and remains above the 10 DMA for a sustained period (e.g., a 1- to 3-day confirmation filter, depending on risk tolerance). Historically, such moves have provided reliable signals on at least four consecutive prior occasions as depicted in the chart.
However, caution is warranted: daily closes above the 10 DMA are common, and many such moves fail to persist. This is why a multi-day filter is proposed—to increase the probability that the breakout represents a genuine shift rather than short-lived noise.
Proposed Trade Parameters
Entry: Break and sustained hold above the 10 DMA (estimated near 90,000 USD).
Take Profit (TP): Reversion to the 50 DMA (approximately 100,000 USD).
Stop Loss (SL): A daily close back below the 10 DMA (likely around 95,000 USD).
Risk–Reward Ratio: ~1:2.
Important Caveats: This setup is inherently imperfect, as both the entry and stop-loss levels are determined by moving averages and the trade itself yields a relatively modest risk–reward profile. Moreover, the rationale for a bullish retracement is based solely on technical patterns—specifically, the observation that counter-trend rallies frequently occur even within pronounced bearish phases. There is, at this point, no anticipated fundamental catalyst or macro-level justification supporting an imminent bullish move; the thesis is grounded entirely in probabilistic technical behaviour.

HUGE SPIKE ON BITCOIN - BTCUSDBitcoin has triggered a spike and opened a trade, just as I had seen it and thought it would play out due to its price and recent highs

SPY WEEKLY LIVE 26 NOV 2025This is Spy weekly where I have clearly discussed why not to long here. Best is not to trade if you are not sure otherwise chances are you might get stuck at the top.
NOTE:STAY AWAY FROM GOING LONGS

BTCUSD BearishBitcoin has consolidation between 58150-60300 levels. Now bears control the market. 54800 level is bearish target.

BCHUSDT LongBitcoin cash H4 chart, consolidation between 433.5 _ 474 levels. Now price is at support level, if we find any buy signal on lower timeframe we can buy. Let's see!

BTCUSD LongBitcoin has a potential upside of +12%. If the price wants to remain in a bullish structure, this is the time for it to move up and retest the 99K level. The bullish structure will be confirmed once the price breaks above the 89,300 level.
Risk–Reward: 1:3.

The end of crypto being an alt investment?If ever there was evidence that crypto has become normalized and absorbed into mainstream institutional behaviour—moving more like a unified asset class and less like a collection of wild outliers—this is it.
Across four randomly selected coins with very different purposes and market caps ( COINBASE:BTCUSD - top left, COINBASE:XRPUSD - top right, COINBASE:SOLUSD - bottom left and BINANCE:TRXUSD - bottom right):
2 out of 4 ranged 35–40% in an almost identical pattern over the same period
3 out of 4 ranged 35–48% in an almost identical pattern over the same period
4 out of 4 ranged 20–48% in an almost identical pattern over the same period
These similarities raise the question: are we now past the era of:
Huge, isolated crypto swings?
Crypto consistently moving counter to the S&P, FTSE and other indices?
Crypto acting as a true alternative asset class?
Not quite.
Yes, institutional capital is now clearly in the market, but how crypto behaves still depends heavily on how those institutions manage their allocations.
Crypto remains capable of sharp, counter-intuitive moves—but with less of the explosive upside (or catastrophic downside) that defined the early years. Crypto volatility is likely to be lower than before—but still far above that of major indices or mega-cap equities (the “Apple/Google/Amazon equivalents” of traditional markets). And crucially, crypto can still move counter to the stock market, as shown in the second image where BTC (and most major coins) fell while equities rallied.
This also leads us to the following - the three investor archetypes now dominating crypto:
The Whales – Formerly wealthy early adopters, but now overwhelmingly institutional players. Their capital, risk management structure and access to liquidity eclipse everyone beneath them.
The Sharks – Yesterday’s whales. Powerful enough to cause volatility and trigger widespread stop-loss cascades, but no longer able to dictate the market the way they once could.
The Nemos – Retail investors, small and scattered, swimming in the wake of the larger fishes while trying (often desperately) to “find Dory*.”
At the same time, crypto has shown increasing correlation with stock market trends—particularly between April and October—further evidence of institutional influence and a sign that crypto is becoming mainstream, integrated, and less viable as a true alternative asset class capable of life-changing returns (or losses).
Notes:
* Dory: Alpha – mythical, elusive, and mostly found in pixel form (cinemas, and charts on social media trading apps :-) ).

ANFIBO BTCUSD – Relief Rally or Deeper Flush? [11.26]
Hi guys, Anfibo’s here!
BTCUSD D1 Swing Trading Plan
Overall Picture
Bitcoin has just printed a sharp multi-day selloff on the D1 chart, breaking below the mid‐range support and tapping the 1.618 Fibonacci extension around the 80k zone. This move also cleaned out liquidity below recent lows – exactly where the chart marks “Liquidity taken”.
From here, price is likely to form a relief rally / corrective pullback rather than a full trend reversal. The key area I’m watching is the 0.618 – 0.786 retracement cluster from the last impulsive drop, which aligns with the 98k–99k zone and previous structure support now turning into resistance (“Support for confirmation reduction” on the chart).
As long as BTC trades below the 108k invalidation area, I’m treating any push into that resistance band as a shorting opportunity within a broader bearish leg.
Macro Context
Fundamentally, BTC is still trading in a risk-off environment:
Price has dropped around 20% in November, putting this month on track to be the worst November since 2018.
From the October all-time high, BTC is currently down about 36%, keeping it inside a bear-market zone despite occasional aggressive bounces.
Some forecasts suggest we could see a local bottom forming this week, but until structure confirms, we treat every rally as a potential lower high.
This backdrop fits well with a strategy of selling premium levels instead of chasing breakdowns late.
Trading Plan – Medium-Term SHORT Setup
We will react if price retraces into our pre-defined zone, not try to guess every candle.
>>> Scenario #1 – Short the 0.618–0.786 Retracement (Primary Plan)
If BTC continues its relief move toward the 98k–99k resistance band, I’ll look for bearish confirmation there:
Short entry: 98,000 – 99,000
Stop loss: 108,000 (above the resistance box and swing structure)
Take profit targets:
TP1: 77,000 – retest of the prior liquidity zone
TP2: 65,000 – next major downside support
TP3: 58,000 – confluence with the 2.618 Fibonacci extension (~56k area) and a deep psychological support zone
Idea: fade the corrective rally into premium prices, in line with the dominant D1 bearish swing. This is a swing short, not a scalp.
>>> Scenario #2 – No Deep Pullback, Direct Breakdown
If BTC fails to reclaim 90k convincingly and rolls over again from lower levels:
I will not chase shorts at the very bottom.
Instead, I’ll wait for a smaller intraday pullback to fresh resistance (for example, retests of broken supports below 90k) and mirror the same downside target area around 77k → 65k → 58k.
This keeps us aligned with the trend while avoiding emotional entries after vertical drops.
Risk Management
Treat this as a medium-term swing trade – keep position size modest and avoid over-leveraging.
Wait for clear bearish reaction (rejection wicks, momentum shift, or market structure break on lower timeframes) before entering around 98k–99k.
Maintain Risk:Reward ≥ 1:2 towards at least TP1; scale out gradually at the lower targets.
Do not average into losing shorts above 108k – that area is our structural invalidation.
If price reclaims and holds above 108k on D1, step aside and reassess the entire bearish thesis.
Conclusion
BTC remains in a bear-biased structure on D1 after a violent selloff and liquidity grab near 80k. While the market may be searching for a short-term bottom, the technical map still favors a corrective rally into resistance followed by another leg down, especially if price respects the 98k–99k supply zone.
By planning our shorts at clearly defined levels and respecting invalidation, we let the market come to us instead of chasing every move.
TRADE THE LEVELS, STAY DISCIPLINED, AND DON’T LET VOLATILITY CONTROL YOU, GUYS! 💛📉

mij btc ideahis is my perspective on Bitcoin.
Bitcoin has fallen sharply in the last few weeks to $86,000-$87,000. There's a lot of fear in the market, which presents many opportunities. My idea is that Bitcoin will rise to its old alt-high or to $140,000 in the coming months to create liquidity so that retail traders will fully invest in crypto while hoarders will slowly take profits. After that, a bear market will emerge, and I see Bitcoin possibly falling back to around $60,000 or even lower in the next two years.

BTC Lower-Channel Structure UpdateBitcoin is moving inside a descending channel, with price testing the lower boundary again. The structure shows repeated swings between the channel levels, indicating short-term range behavior. A reaction from the lower zone could lead to a move toward the mid or upper range if momentum improves.
Bitcoin Target 60K - Here's why (...you should hedge now)🔱 Bitcoin is behaving like a model student when it comes to the fork framework. 🔱
The first re-test at the white centerline, followed by a drop down to the red centerline, and then to the white lower median line parallel was already impressive. And the story isn’t over yet!
In the past days we’ve seen a re-test at the white L-MLH. Bitcoin failed to trade its way back into the fork. That leaves further price losses as the likely outcome.
The next targets are:
👉 the 1/4 level at around 76,000
👉 the white warning line at about 70K–72K
👉 the final move to the red L-MLH at around 60K
This decline would go hand in hand with continued sell-offs in the major indices like the Nasdaq and S&P 500. It would also support my previous post regarding a massive rise in TLT.
(props to @coinwide for the heads-up!)
🚨 A hedge would be appropriate now, before the VIX ignites its rocket and option prices explode.
Wish you all the best out there!

BTCUSD Long: Demand-Zone Rebound Targets $91,000 ResistanceHello traders! BTCUSD continues to trade inside a well-defined Descending Channel, confirming a strong bearish structure where the market consistently forms lower highs and lower lows. Throughout the chart, price repeatedly respects both channel boundaries, showing that sellers continue to dominate the trend. Earlier in the chart, Bitcoin created a Range Phase, indicating consolidation before sellers regained control and pushed price back down toward the mid-channel zone. Each time BTCUSD approached the channel’s upper boundary, it reacted with a clear pivot rejection, which initiated new downward waves — a classic pattern showing persistent sell-side pressure. A notable highlight is the Fake Breakout below the $84,000 area, where liquidity was swept before buyers stepped back in. This move created a strong reaction and initiated the current upward correction. The Demand Line drawn from recent lows has supported the price, helping BTCUSD climb back toward the mid-channel area.
Currently, Bitcoin is trading just above the $84,000 Demand Zone, which previously generated significant buying interest. The structure suggests that buyers may continue defending this zone, especially as price remains supported by the rising demand trendline. However, BTCUSD is still positioned below the $91,000–$92,000 Supply Zone, where sellers previously took control and where another reaction may occur.
My scenario, If buyers maintain momentum, price may attempt a corrective push toward the $91,000 resistance level — a key supply area aligned with the descending channel’s mid-line. A rejection here would be fully in line with the prevailing bearish trend. Manage your risk!

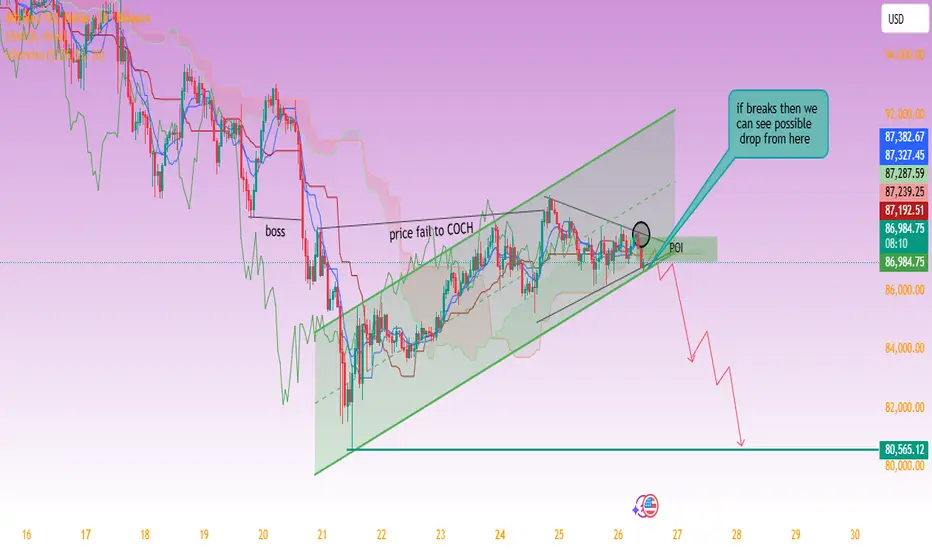
BTC Rising Channel Breakdown Setup – Bearish Continuation Possib1. Rising Channel (Bearish Structure)
Price has been climbing inside a rising wedge / ascending channel, which is typically a distribution pattern during a downtrend.
2. Price Failed to COCH (Change of Character)
You labeled “price fail to COCH” — this means buyers failed to flip the trend into bullish structure.
This is bearish confirmation.
3. BOS (Break of Structure) earlier
There was a clear BOS on the left side — confirming macro bearish flow.
4. Compression into the Channel
Price is moving slowly upward with weak momentum, forming a squeezing structure.
5. POI (Point of Interest) at the bottom trendline
You marked a zone under the trendline.
A break into this zone is where momentum shifts from bullish to bearish.
6. If Trendline Breaks → Expect a Drop
Your chart shows an arrow downwards toward 80,565 as the main downside target.
This aligns well with:
Trendline support
Ichimoku cloud weakness
Rising channel breakdown pattern
Prior liquidity levels
📉 TRADE PLAN (Bearish Setup)
This plan follows the logic of the chart you provided.
🔻 Trade Type: Short Position (Sell)
Because price is at the end of a rising wedge and showing weakness.
✨ ENTRY (Sell Entry):
86,750 – 86,600
After a confirmed break and candle close below the ascending trendline + POI.
✔ Wait for a clean break and retest of the POI/trendline.
🛑 STOP LOSS:
87,350 – 87,450
Place the stop above:
The small circle you highlighted
Last minor swing high
Ichimoku resistance
This keeps maximum SL tight and structure-based.
Risk: ~600–800 points
🎯 TAKE PROFIT (Exit Levels):
TP1 – Safe Target (Liquidity Grab)
84,800 – 85,000
TP2 – Mid Target (Channel Origin)
82,500 – 83,000
TP3 – Main Target (Your Chart Target)
80,565 – 80,000
This matches your projected drop.
📐 Risk–Reward Ratio (Approx):
If using:
Entry = 86,650
SL = 87,400
TP3 = 80,565
➡ RR ≈ 1 : 8+ (excellent)