$BTC Range Bound Market UpdateAfter the great sell-off this month, CRYPTOCAP:BTC entered a rangebound environment - Range high (88,400) and Range Low (80600).
It is expected that the market will remain rangebound unless a solid break occurs from either RH or RL.
LTF Trade plans:
1) Sweep of Q2 VAL, Monday's low, and previous week VAL @ 84600 isa long scalp opportunity.
2) Break below previous week VAL @84600, Scalp short towards 82,300
3) Sweep of RL (80600) Coinciding with pyVAH is a trigger for swing long.
1-BTCUSD

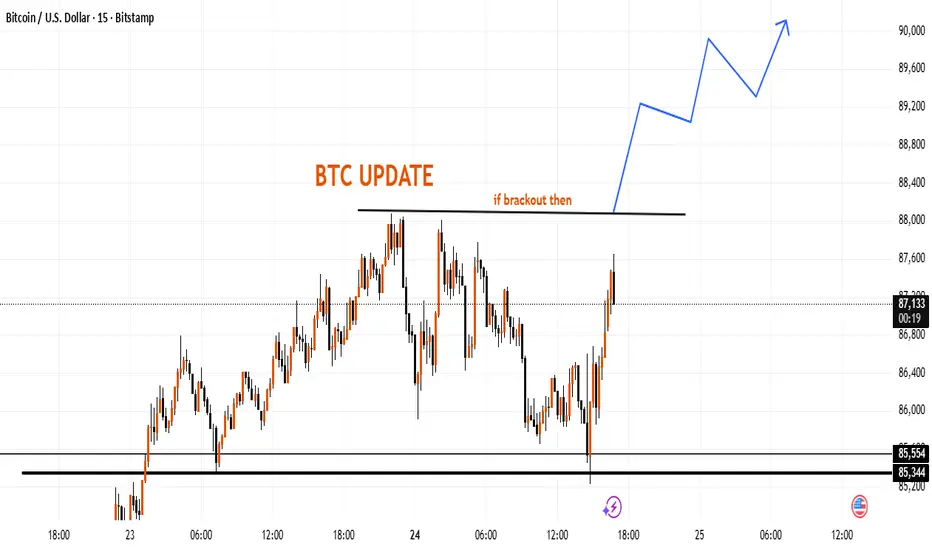
BTCUSD Technical (Bullish Plan)Bitcoin is trading within a well-defined accumulation zone where buyers are gradually stepping in after a corrective move. The chart shows a clear bullish structure forming above local support, indicating that the market is preparing for another upward expansion. As long as price remains protected within this support region, bullish momentum can continue toward the marked Target Points, aligning with previous reaction levels and liquidity zones. The upward arrows highlight the potential continuation path, showing how market structure and volume support the bullish outlook. Overall, this setup reflects a disciplined, structure-based analysis with clear zones, logical targets, and a well-defined trend continuation outlook.

BITCOIN:LIVE TRADEHello friends
considering the decline we had, the sellers made a bottom and the buyers came in. The sellers again broke the previous bottom with strength and made a bottom, and the buyers came in and raised the price and succeeded in hitting a higher ceiling.
And in the pullback, the open price is supported and here we can enter a buy transaction considering the support of buyers and hitting a higher ceiling, of course with risk and capital management and be careful not to make emotional decisions.
*Trade safely with us*

BTCUSD resistance retestThe BTCUSD currency pair continues to display a bearish outlook, in line with the prevailing downward trend. Recent price action suggests a corrective pullback, potentially setting up for another move lower if resistance holds.
Key Level: 88,530
This zone, previously a consolidation area, now acts as a significant resistance level.
Bearish Scenario (rejection at 88,530):
A failed test and rejection at 88,530 would likely resume the bearish momentum.
Downside targets include:
78,850 – Initial support
76,800 – Intermediate support
74520 – Longer-term support level
Bullish Scenario (breakout above 88,530):
A confirmed breakout and daily close above 88,530 would invalidate the bearish setup.
In that case, potential upside resistance levels are:
90,140 – First resistance
92,770 – Further upside target
Conclusion
BTCUSD remains under bearish pressure, with the 88,530 level acting as a key inflection point. As long as price remains below this level, the bias favours further downside. Traders should watch for price confirmation around that level to assess the next move.
This communication is for informational purposes only and should not be viewed as any form of recommendation as to a particular course of action or as investment advice. It is not intended as an offer or solicitation for the purchase or sale of any financial instrument or as an official confirmation of any transaction. Opinions, estimates and assumptions expressed herein are made as of the date of this communication and are subject to change without notice. This communication has been prepared based upon information, including market prices, data and other information, believed to be reliable; however, Trade Nation does not warrant its completeness or accuracy. All market prices and market data contained in or attached to this communication are indicative and subject to change without notice.

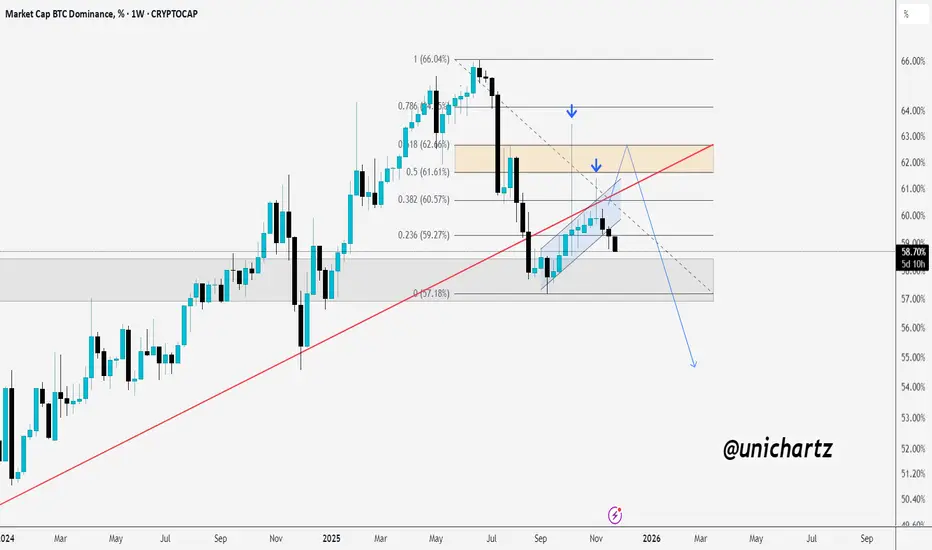
BTC.D Pullback Could Open Doors for AltsBTC dominance has broken below its long-term trendline and is currently holding near the 58–59% support zone, but momentum still appears weak.
The key resistance area sits between 61% and 62.5%, and any retest of this zone may struggle to break higher, especially with its alignment to major Fibonacci levels.
If BTC dominance fails to reclaim this zone with strength, the broader structure points toward continued downside, potentially targeting the 57% level and possibly lower if that support breaks.
A continued decline in dominance would generally favor altcoins, so it’s best to wait for clear confirmation before making any decisions.
DYOR, NFA
Please hit the like button if you like it, and share your views in the comments section.
BITCOIN IS IN A TRIANGLE UNTIL THE END OF 2025: EVERYTHING WILL 📣 Hello everyone!
I bring to your attention my medium-term view until the end of 2025 within the framework of this Bitcoin trading idea solely from the point of view of TA and my understanding of the chart.
🔹 Briefly and to the point:
1️⃣ I believe that Bitcoin's growth in October will be limited and right now the price is already close to local highs.
2️⃣ I expect an unexpected, disappointing drop in the BTC price after the recent ATN upgrade to $125,000 at the beginning of the month.
3. Anyone who flew into a long breakout will be thrown out of the market, many will believe in the beginning of a bear market and prematurely open short positions.
4️⃣ In November-December, I expect another small wave of growth, which will push the price of BTC a little over $130,000
5️⃣ I expect big events for Bitcoin in Q1 2026, but more on that later.
That's all for today, I wish you good luck in making independent trading decisions and making a profit. Please analyze the information you receive from me, always think only with your head!
Goodbye! ✊

BTC + POWER OF THREE (XAMD)BTC + POWER OF THREE (XAMD)
X + Accumulation + Manipulation + Distribution
X: Reversal or Continuation

BTC to 100,000$CRYPTOCAP:BTC – Elliott Wave Roadmap (4H Chart)
Still tracking a higher-degree Wave 4 completion before the macro trend resumes upward. Structure is behaving exactly as a textbook corrective.
🧩 What the chart shows:
🔻 Wave (1) & (2) already completed
• Strong impulsive (1)
• Shallow corrective (2) inside the channel
🔻 Wave (3) extended:
• Deep, high-momentum decline
• Clean sub-waves inside the downward channel
🔵 Wave (4) bounce currently unfolding:
• Reaction up from the (3) low
• Expected to remain below channel resistance
• Most likely forming a zigzag or flat before final drop
🔻 Wave (5) down still pending:
• Should take price into the C/4 completion zone
• Likely near the lower channel + horizontal support cluster
🟢 After Wave 4 completes:
• Expect a major trend reversal up
• First target = break out of the channel
• Mid-term goal = region around the previous X high
📌 Summary:
BTC is preparing a Wave (4) corrective bounce → final (5) dip → major upside leg.

INTERVIEW: Hope phase - EXCAVO’s View 25/11/25
1. Do you believe the bear market has already begun? If yes - from what moment?
Yes. The bear market started in November 2025.
My cyclicality chart shows it clearly: not a single scenario points to continued upside.
Every chart I posted on TradingView confirms the trend reversal.
2. What was the main signal confirming the reversal?
The 153rd week of Bitcoin’s growth — a historic exhaustion point that almost always marks the end of a cycle.
3. What BTC levels are critical for the downside scenario?
The key horizontal level is $74,000.
At minimum, I expect a clean wick below it.
4. What fundamental factors accelerated the bear market?
A massive overbought environment.
The 2-year AI bubble pushed valuations far above fair value.
The market became overheated — even though AI is here to stay.
5. Technical factors confirming the decline?
We’re dropping without any real reason.
Any small headline triggers selling.
October 11 wasn’t about Trump — it was a whale manipulation on big exchanges.
That’s how late-stage cycles behave.
6. Why did most traders fail to see this reversal?
— Short memory
— Conditioned for 3 years to “buy every dip”
— No exit plan
— No clear framework
— And of course: they weren’t following EXCAVO 😉
7. Where could BTC go in the coming weeks?
First: liquidation of short positions.
We may even spike up to $94,000.
But that would be a trap before continuation downward.
In December, I expect the formation of one of the cycle bottoms.
8. Which scenario seems more likely — panic drop or step-by-step bleed?
Most likely: a step-by-step bleed.
9. Is a fake bounce possible before further decline?
Yes. I already mentioned it: a short squeeze → then a big drop.
Practical Part
10. What are you personally doing in this market?
I’m waiting.
Observing.
Studying.
You don’t need to be in a trade every day.
Overtrading destroyed more traders than any correction.
11. What should beginners do now?
Exactly what professionals do: wait for their entry point.
We’re hunters in the bushes — we shoot only when the target is close.
12. What should traders revise in their strategy right now?
— Understand where we are in the macro cycle
— Identify what’s working
— Remove what’s not
— Accept that the bear market will be long and exhausting
Right now we’re in the hope phase.
Disappointment is ahead.
Best regards EXCAVO
If you have any questions, feel free to ask. In the next post, I can do another interview based on the questions you leave under this one.
BTCUSD: Bulls Aim for Recovery Toward $92,000 Resistance ZoneHello everyone, here is my breakdown of the current Bitcoin setup.
Market Analysis
BTCUSD continues to move within a clearly defined Downward Channel, respecting both the descending resistance line and the lower support boundary. After a prolonged bearish continuation from the major Range structure seen earlier, Bitcoin broke several intermediate support levels before reaching the Support Zone around $84,000, where strong buyers stepped in. A Fake Breakout below the channel support triggered aggressive buying activity, sending the price back above the Support Zone and forming a short-term recovery structure. From this point, BTCUSD made a corrective bounce and even managed to break above a minor descending resistance, confirming a temporary shift in momentum.
Currently, price is approaching the Resistance Zone near $88,000–$90,000, which aligns with the upper boundary of the Downward Channel. This area has previously generated strong sell-offs and remains the key obstacle for buyers. A clean breakout above $90,000 would signal bullish continuation and may lead to a deeper recovery toward the next liquidity cluster near $92,000–$94,000. As long as BTCUSD holds above the $84,000 Support Zone, the short-term structure supports a bullish correction. However, if price gets rejected from the $90,000 resistance and fails to stay above support, sellers may regain control and push the market back toward the lower channel boundary.
My Scenario & Strategy
From my perspective, BTCUSD maintains a bullish corrective outlook while respecting the Support Zone around $84,000. The first target remains the $90,000 Resistance Zone, which matches both horizontal resistance and the channel’s upper boundary. A confirmed breakout above $90,000 would open the path toward $92,000–$94,000, where the next reaction levels are located. I will look for long opportunities during pullbacks toward the Support Zone or along the rising minor trendline that formed after the fake breakout.
If BTCUSD breaks back below $84,000, the bullish scenario becomes invalid, and a continuation of the major downward trend may follow. For now, price action supports a bullish recovery setup as long as buyers defend the Support Zone.
That's the setup I'm tracking. Thank you for your attention, and always manage your risk.

BTC long-term TAIt's been a while since the lasts posts, let's keep it up!
Bitcoin is entering an extreme bearish area on weekly time frame, the uptrend that lasted since March 2023 has been officially broken. The recovery may take anywhere between 6 to 12 months, no one can tell precisely but it's going to take some time.

BTC/USDT Building an Early Base, High Chance to Retest 93K-108+BTC/USDT — Building an Early Base, High Chance to Retest 93K → 108K+
Bitcoin is forming a stabilization zone between 80K and 93K, which could mark the start of a deeper recovery phase. The recent bounce off the lower boundary suggests that buyers may be re-entering, setting up a potential long-term trend shift.
Key Technical Points:
📉 Support Zone: The lower range around 80.6K has held, showing strong demand at these levels.
🔁 Current Structuring: BTC’s price action shows a gradual range build — this isn’t just a short-term bounce, but a possible formation of a base.
🎯 First Upside Target: A clean breakout above 93K would signal renewed strength and is likely to trigger further buying.
🚀 Extended Target Potential: If momentum confirms and volume supports the move, BTC could aim for the 100K+ region. This would align with a multi-wave recovery to reestablish higher long-term structure.
Trade Outlook:
Holders: This could be a key accumulation setup — building on strength around the base may pay off if the breakout runs.
Short-term traders: Watch for a breakout above 93K with volume as your trigger for re-entry or scaling in.
Risk: If BTC fails to reclaim 93K decisively, a retest of the 80K base is still possible.
Summary:
There’s a realistic and structurally sound scenario where BTC could recover from this base and push toward 93K, with a strong shot at going 100K+ if the breakout materializes. Conditions are setting up for a potential multi-wave uptrend, but confirmation will be critical.

BitcoinBTCUSD
- Change of Characteristics
- Completed " 1234 " Impulsive Waves
- Break of Structure
- Fair Value Gap
- Resistance Level

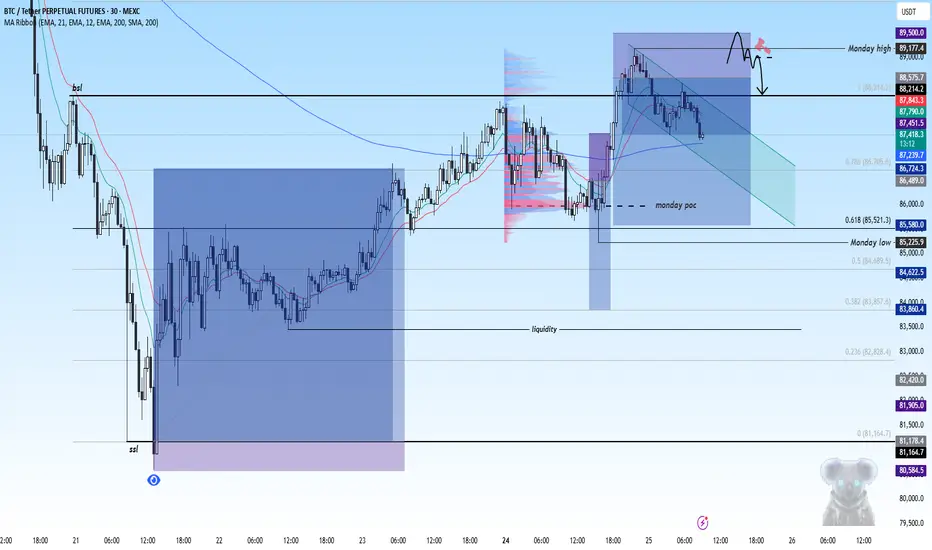
Bitcoin short scalpTaking partial profits here on $BTC...
Keep an eye on the monday range... Will add/re-enter if #Bitcoin sweeps monday high and get back in the range again...
#trading #CryptoMarket #BTC
BTC - NEW ATH in December or DROP?Hello BTC Watchers 📈
Bitcoin has, historically, been very bullish in Decembers. We see the most drastic increase in 2020, when BTC climbed over 140%.
During the times that BTC corrected over December, it's been 10% and 31%.
This makes it hard to predict seeing that it seems to be different every year with one year even trading in a tight range.
A few things we can do to clarify the possible direction of BTC This December:
1️⃣ Check the Macro
From a macro perspective, Bitcoin has increased and been increasing since April, with the hard drop only showing now in November.
This could mean two things - the correction before a final leg up or, the beginning of the bearish cycle.
2️⃣ Check Technical Indicators
a) The moving averages is pointing towards short-term BEARISH, since we are trading UNDER the 200d Moving averages(green line):
b) The Bollinger bands are showing an expansion (aka widening) but to the bottom, as the price is trading on the lower BBands, also indicating strong selling pressure for the short to near term:
3️⃣ Watch the News
Bitcoin has been coming up in many seemingly "bullish" articles. This is usually a bad sign before the liquidation - create hype, and then short the market.
Conclusion:
I'm leaning towards a soft pump in December to soften the blow of the current correction , but not a new ATH. The next increase will likely be a "fake-out" before the real bearish season starts in the new year.

BTC – Key Level Watch and Structural OutlookThis chart highlights an important resistance zone around the 88,000 area. If price manages to move firmly above this level, the market may continue forming a higher-timeframe structure toward the 89,000–90,000 region.
The lower zone near 85,300–85,550 remains a notable support area where previous reactions occurred.
This outline is based purely on market structure and potential price behavior, not a trading instruction.
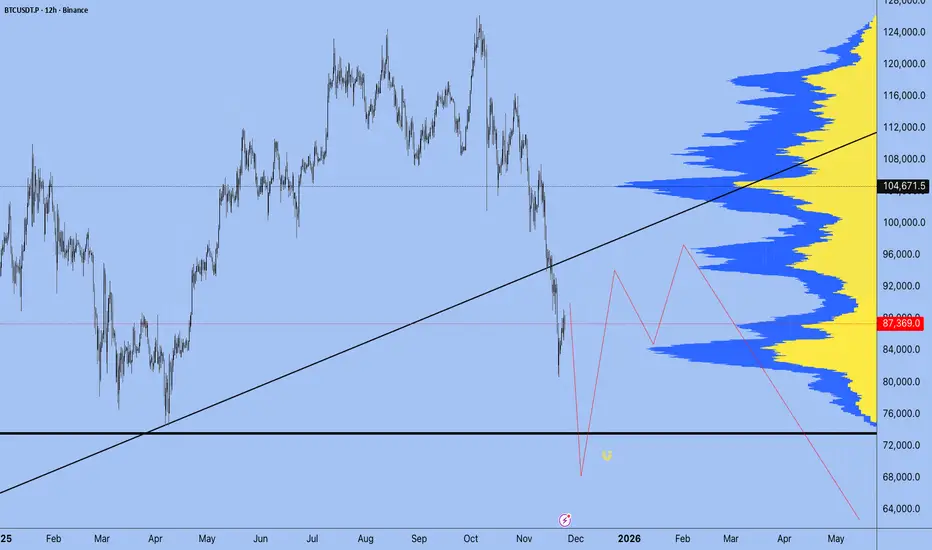
Bitcoin Market Truth: Whales, Corrections, and the BraveHello my friends,
I have carefully analyzed Bitcoin for you.
Markets never move straight up; they progress with corrections. Whales often take profit along the way. Think of it like running a supermarket: you buy apples at the cheapest price so that when customers purchase from you, you make a profit. Whales use the same logic. They trick people into thinking prices are falling, but in reality, their goal is to balance supply and demand. They feed on the losses of others.
For me, the most suitable buying zone is between 85,000 and 74,000 dollars. From this range I will enter the trade, with my first target at 107,000 and my second target at 120,000 dollars.
This business belongs to the fearless and the brave. If you act out of fear of losing money, this is not for you. Those who cannot manage risk should look for other paths.
My dear friends, every single like you give is my greatest motivation to continue sharing these analyses. Thank you to all who support me—you are the reason I keep going.
Each of my followers is like family to me, never forget that.
⚠️ And remember this: In trading, don’t trust everyone who calls themselves a “trader.” Most of the people you follow don’t earn a cent in their real accounts. This is not an easy business. Around 90% of people lose consistently, while only about 10% make money regularly. Many YouTubers or influencers you see online don’t actually profit with their real money. In fact, some of the celebrities you follow come to me asking for analysis. I won’t expose names, but these are the facts.
Respect and love

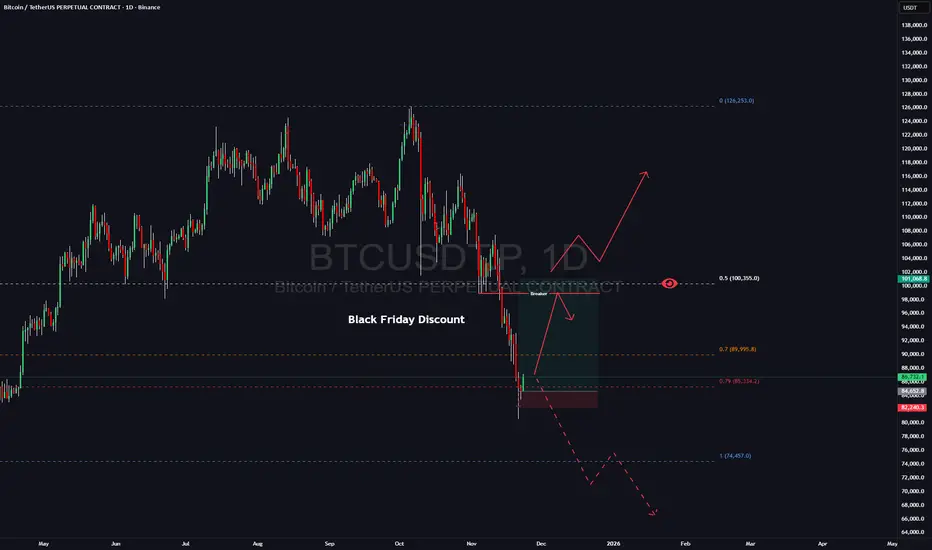
BTC Is Preparing Monster Move: My Bullish Roadmap to New High!A lot of people are already calling for the end of the BTC rally and welcoming a new bear market. Whether that’s true or not — the chart will show. I approach the market with a neutral mindset and let price action speak for itself.Plus dont forget we have Black Friday coming and probably crypto market decided to give you a nice discount)
From my perspective, Bitcoin has simply tapped the weekly discount zone. Historically, BTC often delivers a 20–30% corrective move, which is completely normal within a bullish cycle. And with Black Friday approaching, it seems the crypto market decided to offer its own “discount.”
I’ve taken a long position from this area, with my first target set at 94–96K, where I plan to secure the majority of my profits.
My stop is positioned around 82K — if the market goes against me, I’m fully comfortable with the risk.
I’ve also added some spot positions and will share detailed analysis on those in upcoming posts.
Once we reach the 94–96K zone, I’ll reassess the market. Price can shift in either direction from there, which is why that area is my main profit-taking zone while letting the remainder of the position run.
Follow me for further updates and trade breakdowns.
XAUUSD: triangle compression🛠 Technical Analysis: On the 4-hour timeframe, Gold (XAUUSD) is consolidating within a massive symmetrical triangle, indicating a period of indecision and building volatility. The price action is currently compressing near the lower support trendline of the formation. The Moving Averages (SMA 50, 100, 200) are converging, further confirming the squeeze. The projected trade setup anticipates a bearish breakout below the triangle's support. A confirmed close below the trendline opens the path for a decline toward the immediate support zone at 3,893, with a medium-term target potentially reaching the 3,700 level marked on the chart.
🌍 Fundamental Analysis: The precious metal is under pressure as the market anticipates key US economic data due later this week. Investors are closely monitoring the upcoming US GDP (Preliminary) and Core PCE Index figures. Stronger-than-expected data could reinforce the Federal Reserve's hawkish stance (or delay rate cuts), boosting the US Dollar and yields, which traditionally weighs on non-yielding assets like Gold. Additionally, liquidity may thin out approaching the US Thanksgiving holiday, potentially leading to sharper, erratic moves upon any breakout.
📉 Trade Parameters (SELL):
Entry Point : Sell on the confirmed breakdown of the triangle support (approx. 4,060 – 4,070).
Take Profit: 3,893, medium-term target at 3,700
Stop Loss: Above the immediate structure or SMA cluster (approx. 4,150).
⚠️ Disclaimer: This is a hypothetical trade idea based on current analysis; market conditions and price direction are subject to change based on news factors and volatility.

Bearish momentum to continue?Bitcoin (BTC/USD) is reacting off the pivot which is a pullback resistance and could reverse to the 1st support.
Pivot: 89,178.40
1st Support: 81,214.21
1st Resistance: 93,070.41
Disclaimer:
The opinions given above constitute general market commentary and do not constitute the opinion or advice of IC Markets or any form of personal or investment advice.
Any opinions, news, research, analyses, prices, other information, or links to third-party sites contained on this website are provided on an "as-is" basis, are intended to be informative only, and are not advice, a recommendation, research, a record of our trading prices, an offer of, or solicitation for, a transaction in any financial instrument and thus should not be treated as such. The information provided does not involve any specific investment objectives, financial situation, or needs of any specific person who may receive it. Please be aware that past performance is not a reliable indicator of future performance and/or results. Past performance or forward-looking scenarios based upon the reasonable beliefs of the third-party provider are not a guarantee of future performance. Actual results may differ materially from those anticipated in forward-looking or past performance statements. IC Markets makes no representation or warranty and assumes no liability as to the accuracy or completeness of the information provided, nor any loss arising from any investment based on a recommendation, forecast, or any information supplied by any third party.

Bitcoin Price Approaches Key Support: Rebound Toward 98,700?BITSTAMP:BTCUSD is approaching a key support zone, an area where buyers have repeatedly stepped in before and triggered notable reversals. That price history alone makes this level worth watching very closely. Price is pressing into this zone again, and the current structure suggests bullish potential if we see clear signs of rejection, such as a strong bullish engulfing candle, long lower wicks that show absorption of selling, or a visible increase in buying volume.
If this support holds, I expect price to push up toward the 98,700 area, which fits well with a short-term rebound scenario. If, on the other hand, price breaks below this zone and starts to hold underneath it, the bullish idea is invalidated and the door opens for a deeper downside move.
In my view, the best approach here is to let the chart confirm the story at this level. Watch how candles close, how volume reacts, and only consider long setups if the market clearly defends this zone. Solid risk management is essential: position size, stop loss placement and invalidation levels all need to respect the potential volatility around such an important area.
This is simply my personal view on the current support and resistance structure, not financial advice. Always confirm your own setup and trade with disciplined risk management. Good luck out there.

BITCOIN FREE SIGNAL|SHORT|
✅BTCUSD tapped supply and left a clean VFG inefficiency above the rejection wick. A return into that VFG for refinement offers optimal entry, aligning with bearish order-flow toward sell-side liquidity below.
—————————
Entry: 88,900$
Stop Loss: 90,154$
Take Profit: 87,164$
Time Frame: 2H
—————————
SHORT🔥
✅Like and subscribe to never miss a new idea!✅

TOTAL Market Cap at key support, 100 EMA + Sto/RSI = BULLISH!The Total Market Cap is holding key trendline support going back many years, including the
Covid crash. Price is also holding at the 100 Week EMA and the stochastics RSI is turning up, which has been a good predictor of price on the weekly time frame.
So I would expect some kind of a bounce here especially now that the FED watch tool is showing we're back to an 85% chance of a further rate cut in December.
However the markets are very fragile and certainly can see another deeper drop come in December possibly forcing the FED to do a additional rate cut in January.
All of this leads toward possible QE and liquidity injection into the economy which would get these markets moving again.
I can see us hitting you highs in 2026 probably kicking off around May where Jerome Powell is replaced when his term is up with a more friendly fed chairman.
And then starting the money printers back up again.
For now, at least the markets aren't bleeding and haven't broken this key Market structure.
We will know soon enough.
