Temporal Drift Alpha | Rotating Volatility | Hidden Rhythm🧠 Deep Dive: Hidden Alpha in Odd Intraday Charts
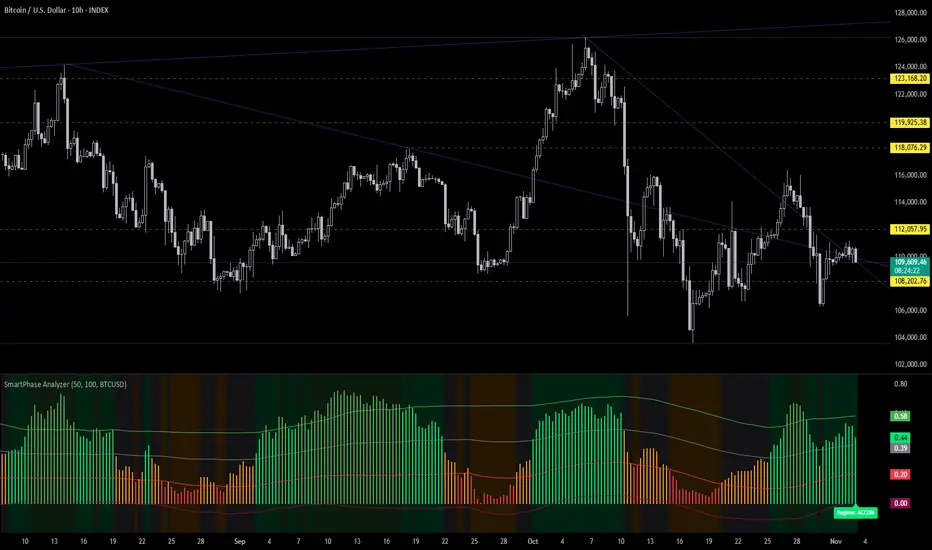
Been experimenting lately with non-standard intraday timeframes on TradingView — specifically the 10-hour chart — and it’s producing some really interesting results.
My 1D strategies only needed minor calibration to fit intraday conditions (mainly risk and signal sensitivity tweaks), but once adjusted, they started performing significantly better on 10H than on standard 4H / 12H / 1D setups.
Here’s why I think it’s happening 👇
⚙️ 1. Uneven time alignment = session drift
10H doesn’t divide evenly into 24H, so candle start times rotate across the global trading cycle (Asia → London → NY).
That means each bar is pulling from a different combination of regional liquidity and volatility windows — you’re not seeing the same “slice” of the day over and over.
- 06:00 → overlaps Asia close + London open
- 16:00 → overlaps US open
- 20:00 → catches late NY + early Asia handoff
This rotation keeps repeating every couple of days, giving you asynchronous snapshots of how the market behaves between sessions — and that’s where inefficiencies tend to hide.
📊 2. Structural alpha exposure
By breaking away from the standard 8H / 12H / 1D alignment, you end up:
- Capturing transition volatility (session overlaps)
- Avoiding compressed daily smoothing
- Getting more responsive structure shifts for trend/momentum setups
It’s basically giving you a rotating volatility lens. You’re still seeing the full picture, but through different angles each cycle.
🧩 3. Strategy behavior differences
On the 10H:
- Momentum filters trigger cleaner — fewer false breaks
- Mean reversion signals reset faster after exhaustion
- BB, RSI, EMA-type systems react smoother, since the noise from hard session resets (like 00:00 UTC) is reduced
I’m seeing way fewer “dead zones” between signals — and overall smoother PnL curves, even with identical logic.
📈 4. Practical takeaway
Odd-hour timeframes like 10H act like a “rotating frame sampler” for the market.
They shift through liquidity regimes automatically — giving you a natural form of temporal diversification.
If your 1D systems are solid but a bit laggy or overly smoothed, try re-anchoring them on 10H, 14H, or 22H and recalibrating your risk and confirmation filters slightly.
There’s legit structural alpha buried in how these bars cut across the global cycle.
🧠 TL;DR
10H charts = not random noise.
They’re asynchronous time slices that expose unbalanced session transitions — something most backtests miss.
I’ll be running deeper tests on return bias and volatility clustering per candle start hour (06:00, 16:00, 20:00, etc.), but early signs point to repeatable behavior .
This could be one of those tiny structural edges that compounds over time.
Sometimes alpha isn’t in new indicators — it’s in how we slice time. ⏳⚡️
10H
SasanSeifi| Where is the Next Support?Hey there, ✌ In the 10-hour timeframe, the Dow Jones Index has been correcting from the 43,300 price range. With a structural break around the 42,700 to 42,500 zone, the price entered a corrective phase, reaching down to 41,700. Currently, it is trading around 42,000.
The general outlook leans more towards a bearish scenario. One potential scenario is that after some slight upward fluctuations or sideways movement, if the 42,500 supply zone doesn’t break, we may see further correction to lower levels around 41,400 and 41,300. Following this, a range-bound movement is possible upon reaching these levels.
Should there be a correction in the price trend, it’s important to watch the price reactions in these zones to better understand the continuation of the movement. Additionally, if demand picks up and the critical 42,500 level breaks and holds, we could see a further price rise toward the 42,700 and 43,000 levels.
💢This analysis is my personal viewpoint and not financial advice. If you found this helpful, please like and comment – I’d love to hear your thoughts! Happy trading! ✌😊

SasanSeifi|Is a Move Towards the 0.00800 Target on the Horizon?Hey there, ✌ BINANCE:BOMEUSDT In the 10-hour timeframe, as you can see, the downtrend line has been broken and the price is currently trading above the EMA60 and around the high of 0.0006700.
The outlook is more bullish, and it is expected that after a minor correction and a possible pullback, or if the price breaks above 0.00680 with momentum and stabilization, it may rise towards the target of 0.00750 and the bearish order block level at 0.00800.
To better understand the ongoing trend, we need to observe the price reaction at these levels. ⭕ The key support level is at 0.00600.
This analysis is my personal viewpoint and not financial advice. If you found this helpful, please like and comment – I’d love to hear your thoughts! Happy trading! ✌😊

SasanSeifi|Metis Analysis: Potential Breakout Ahead?
In the 10-hour timeframe, as you can see, The price has touched the downward trend line four times and is now trading around the critical $32 level. Given the previous interactions with the trend line, a breakout seems possible.
If the trend line is broken, we can expect the price to rise towards targets around $35, followed by a potential further increase to the $37-$38 range after a minor correction. To understand the ongoing trend better, observe how the price reacts to the $35 level. Key support is at $29-$28.
This analysis is my personal viewpoint and not financial advice. If you found this helpful, please like and comment – I’d love to hear your thoughts! Happy trading! ✌😊

ZEUS: Ready for a Breakout? Hey there, let's review the KUCOIN:ZEUSUSDT chart on the 10-hour time frame. As you can see, the price is currently trading within a descending trend line. In the short term, if we witness a break above the descending trend line and the 0.20 cent price level, the scenario I have in mind is that the price may rise towards the liquidity zone at 0.22 cents. After a pullback, the price could potentially move towards the second target of 0.2455 and the supply zone at 0.27. However, please note that this potential trend depends on breaking through the specified levels. Important support zones to watch are 0.16 and 0.15.
Remember, this is just my personal analysis, not financial advice. Do your own research and make informed decisions.
Happy trading!✌😎
Sure, if you have any more questions or need further clarification, feel free to ask. I'm here to help!✌
if you found my analysis helpful, I would appreciate it if you could show your support by liking and commenting. Thank you!🙌
