DOW SHORT RE-ENTRY 41200 SL & TP ON CHARTRe-entering DOW short as explained on the last entry I was cautious of the DXY crashing through 104.00 and going for a liquidity sweep of 103.800 level & it done exactly that, which invalidated the last entry... not a problem as simply gives me a more premium price for second entry as bias remains t

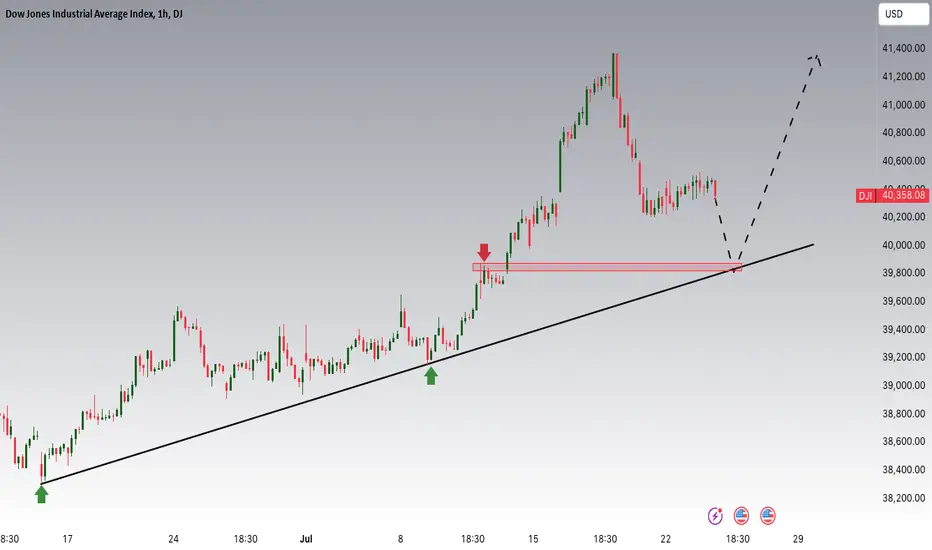
US30 Is Approaching The Main TrendHey Traders, in today's trading session we are monitoring US30 for a buying opportunity around 39800 zone, US30 is trading in an uptrend and currently is in a correction phase in which it is approaching the trend at 39800 support and resistance area.
Trade safe, Joe.

US 30 - Ranges overview Here is a quick look on the current ranges on US 30
I've noted the 4H FVG (yellow box) which we currently filled and currently trading back towards the LTF sellside. The attentive guys and girls amongst you will have noticed that I've taken short scalp based on the LTF based on the 4H FVG....
Sim


PART 2: 67years back in timeContinuation of the cyclic Movement of the DJI market.
Make sure you watch the previous post and check back for PART 3

3rd week sell offUS30 to continue on a downtrend for this week. looking at a risk to reward of 1 to 9. a sweet swing. look at chart for more details.

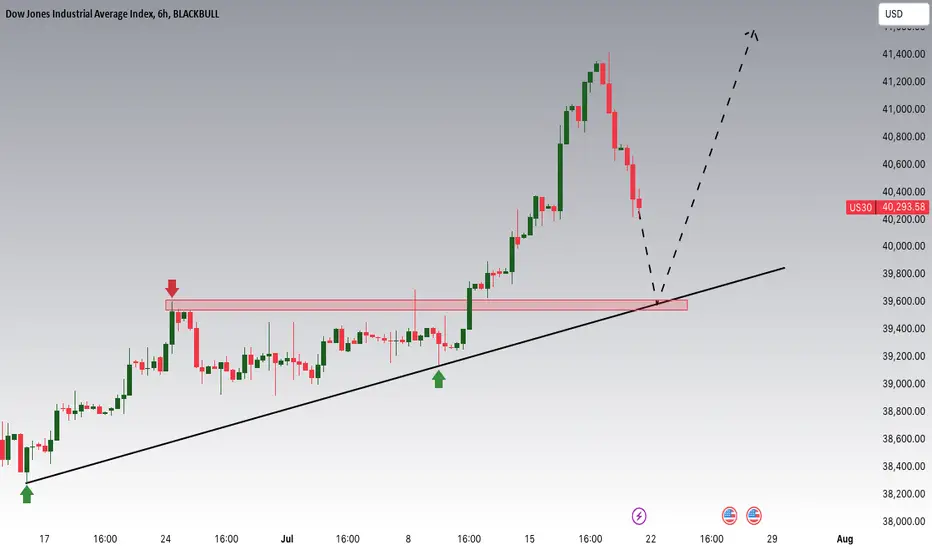
Dow Jones is approaching an important supportHey Traders, in today's trading session we are monitoring US30 for a buying opportunity around 39600 zone, US30 is trading in an uptrend and currently is in a correction phase in which it is approaching the trend at 39600 support and resistance area.
Trade safe, Joe.
Start Down Jones Beurscrash 2023/24 Start Down Jones Beurscrash 2023/24
End of cycle! For the second time since the creation of the Dow Jones Industrial Average in 1896, we are entering a depression period. Intended to reset the world economy. Part of the fourth industrial revolution.

LONG IDEA ON US30Price has formed a W pattern by breaking 40. range and turning it into support. After price failed to break the 41. level, it bounced back to 40. level giving us good entries for long, we should see price pushing towards 42. range


See all ideas
Frequently Asked Questions
Dow Jones Industrial Average Index reached its highest quote on Jul 18, 2024 — 41,448.5 USD. See more data on the Dow Jones Industrial Average Index chart.
The lowest ever quote of Dow Jones Industrial Average Index is 18,191.3 USD. It was reached on Mar 23, 2020. See more data on the Dow Jones Industrial Average Index chart.
Dow Jones Industrial Average Index is just a number that lets you track performance of the instruments comprising the index, so you can't invest in it directly. But you can buy Dow Jones Industrial Average Index futures or funds or invest in its components.