ARB 1D 71 LONG SCOREARB — quick snapshot (17 Jan 2026)
Positives (weighted)
Fundamentals: Grayscale funds list (+1), Arbitrum stablecoin settlement layer (+1), ARB in Grayscale candidates (+1), Wyoming stablecoin on Arbitrum (+1).
TA components: EMA order +30 (strong trend), deviations +5 (normal range), series +0.5 (mild impulse), spreads +3 (healthy spread), FVG +7 (bullish gaps), liquidations +2.5 (short squeeze), narrative +20 (long bias), plan +14 (validated plan).
Price action: downtrend slowdown +2, HH/HL +4, microstructure +1, rising channel +2.
Total positive weight: +95.0
Negatives (weighted)
Fundamentals: ARB share 0.94% / $19.7m (−2).
Unlock pressure −10; next on 16 Feb 2026 — strong downside pressure.
Price action: equal highs (−3).
Total negative weight: −17.5
Context (unweighted risks)
Flat macro regime; Jan–Feb high‑risk window (US budget/shutdown, FOMC 27–28 Jan, BoJ minutes 28 Jan).
Bias: Long, but tactical only; keep risk tight.
EMA STRATEGY:
TA:
LIQUIDATIONS:
1d

OP 1D LONGBINANCE:OPUSDT
Long Score: 70.5 (me) / 47.5 (system)
Panel context:
- Narrative: global + local = LONG
- Fundamentals: buyback proposal (vote Jan 22; 50% Superchain rev) + institutional push + RLUSD to OP (bullish)
- Risk: major unlock supply (next unlock Jan 31) → expect volatility
- Phase/EMA: TOTAL_BULL EMA stack (trend-follow bias)
- PA: HH/HL + ascending channel; “hunt up” possible
- FVG: bull support 0.33–0.3488 / 0.28–0.3035; nearby bear FVG 0.34–0.366 (reaction zone)
My charts:
EMA PHASE:
TA:
LIQUIDATIONS:

BABY LONG 1DLong/Short Score: 47.5 (me) / 63 (dashboard)
Panel context:
- Narrative: global + local = LONG
- Fundamentals: a16z invested $15M (positive catalyst)
- Phase/EMA: trend-break phase → break to LONG (needs confirmation)
- Dev: 4H + 1D normal (no major overheat)
- Unlocks: strong unlock pressure (risk factor)
- PA/Structure: HH/HL microstructure + flag / rounded bottom; “shelf” support area
- Liquidity: “hunt up” possible → expect spikes, stick to invalidation
My dashboard:
FVG/FRACTALS:
LIQUIDATIONS LEVELS:
SYSTEM SCORING:

CAKE LONG 2026-01-16 My Long/Short Score: 77
- Narrative: global + local = LONG
- Fundamentals: proposal to cut max supply by ~50M (~11%) (positive)
- Phase/EMA: TOTAL_BULL EMA stack (strong trend)
- Dev: 4H + 1D in normal range (no major overheat)
- FVG: New Bull FVG support 1.914–1.893 (HTF); extra support 1.997–2.028 (LTF)
- PA/Liquidity: upside liquidity sweep → follow-through possible, but expect stop-hunt noise
- Fakes: elevated (choppy) → accept volatility, keep strict risk rules
My personal indicators dashbord:

ENA 1D SHORT SETUP 16/01My personal Long/Short Score: 36 (mixed, short-leaning)
Panel context:
- Narrative: global + local = SHORT
- Macro: flat / risk-sensitive tape → trade only, no “investment holds”
- Unlocks: strong unlock pressure (downside supply risk)
- Phase/EMA: mixed/chaotic EMA order, but multi-TF bars mostly below EMA → weak trend
- PA: volatility compression / transition to range → wait for reaction, not market chase
- Liquidity: “hunt up” (short squeeze risk) → confirmation first
- Key levels: Entry ~0.23 | SL 0.2538 | TP 0.1966 → 0.18 → 0.15
Data from my indicators:

MET 1D SHORT SETUPPersonal Long/Short Score: 32-34.5
Panel context:
- Phase: bearish EMA stack
- Series: 1H overstretched below EMA (pullback → continuation risk)
- Fakes: clean trend / fewer traps
- PA: Fractal High formed (LH confirmed) + LL/LH downtrend
- Levels: Res 0.2842 / 0.2999 | Sup 0.2357 / 0.2317 / 0.2183 / 0.2031
- FVG: Support 0.247–0.2495 + 0.2368–0.2377; Bear FVG overhead 0.3574–0.4271 (far)
- Liquidity: “hunt up” possible → wait for confirmation
- Unlocks: next unlock 23 Jan (extra supply risk)
Plan:
Entry: 0.2478 (confirmed rejection / failed EMA reclaim)
Stop: 0.2842
Take 1 (Point B): 0.232 → +1% to equity (sell 50%)
After Take 1: move SL to BE → rest in Price Discovery

#BTC/USDT Let Bitcoin make a new ATH#BTC
The price is moving in a descending channel on the 1-hour timeframe. It has reached the lower boundary and is heading towards a breakout, with a retest of the upper boundary expected.
We are seeing a bearish bias in the Relative Strength Index (RSI), which has reached near the lower boundary, and an upward bounce is expected.
There is a key support zone in green at 87300, and the price has bounced from this level several times. Another bounce is expected.
We are seeing a trend towards stabilizing above the 100-period moving average, which we are approaching, supporting the upward trend.
Entry Price: 87988
First Target: 88350
Second Target: 88722
Third Target: 89287
Remember a simple principle: Money Management.
Place your stop-loss order below the green support zone.
For any questions, please leave a comment.
Thank you.

1D SYRUPUSDT LONGEntry: $0.272–0.276 (core: $0.2744)
SL: $0.2462
TP1: $0.3139–0.3176
TP2: $0.3184–0.3488 (bearish FVG + 3D EMA)
TP3: $0.3926–0.4357 (bearish FVG + trendline)
Risk: 0.10–0.25% (mood level 2, fakeouts elevated)
Daily long setup from the support/base after the EMA logic flip to the upside (EMA order is mixed/chaotic, but the break direction is bullish) and a bullish structure impulse (updating highs). The plan’s Point B is 0.3175, so the first take-profit sits at the daily resistance/fractal zone 0.3138–0.3176. If price holds above 0.3176 and doesn’t fall back into the range, the next target is the main profit-taking area 0.3184–0.3488 (bearish FVG + 3D EMA). Final extension target is 0.3926–0.4357 (next bearish FVG + trendline), where it makes sense to close the remainder as this is the upper supply area on your map.
Why caution: on 15m and 4H there’s a series of fakeouts (stop hunts back into the range), and on 1D fakeouts are moderate; the daily bar series below EMA is far longer than average (stretched correction), so the market can chop and sweep stops. That’s why the entry is best executed in pieces (scale in across 0.272–0.276) and avoid increasing risk.
Fundamentals: positive driver is the 2M SYRUP token buyback, but there’s legal uncertainty / reputational risk around Maple vs Core, so the factor score (-1.1) supports a level-to-level trade, not a blind hold.
Invalidation: a sustained break and close below $0.2462 (stop beyond the nearest fractal). Early defense: if after entry price can’t hold the key support $0.2541 and starts losing the base, reduce size before the hard stop.

BTC 1D: watching 64–73k box for Nov 25–26 FED weekBearish channel intact unless 80k is reclaimed. Map, not signal.
Key idea: the bearish channel guides price into 64–73k. If we drift there by Nov 25–26, FED could trigger the next major move.
Not advice: I act only if price respects the box and vol/volume confirm. Until then this is a roadmap, not a signal.
Which side of 64–73k breaks first?

Swing Setup: (1D+4H) POI + 5min DIVERGENCE + FVA RESPECT So I did my top down analysis, saw a 1D FVG and price respected it, so I looked for divergences and i found it on the 5min, saw price made an FVA and displaced through it so I decided it was time to enter that because a 4H and 1D FVG is a strong POI, and the fact that price did not burst through it meant it was getting respected.
So I think it was at this time that I saw the FVA has formed and has been respected so I looked for an entry.
For the actual entry, I think there was a small bullish FVG there above the FVA so I took that.
Since price was at a 1D + 4H FVG, I considered it as the Internal Range Liquidity(IRL) and therefore targeted the External Range Liquidity (ERL). I put my SL quite far, at the bottom of this sting into the FVG. It got me 2.8RR I think, and that's good enough.
I made this trade on friday, and it only resolved the next trading day, which was monday.
TL;DR, 4H and above POI(IRL), once you see it getting respected (with an FVA + FVG), take it as a sign, enter without hesitation, and target the ERL.

Tesla Breakout? For the majority of the calendar year TESLA has been in a range between $220 - $365 with a clear midpoint of $295.
From March to the beginning of May TESLA bounced between range low and the midpoint until finally breaking through into the upper half of the range where it has stayed ever since. However, there is a clear diagonal resistance level that is preventing higher highs.
So will TESLA breakout, or will it lose the midpoint? Structurally it is clear that the bulls have a set level they are happy to buy at (Midpoint) but the bears are getting more aggressive with their selling, hence the lower highs. This compression inevitably leads to an impulse move but the direction is not so clear.
Bullish scenario: A clean breakout with volume that makes a new higher high, signaling a shift in structure. A pullback and retest of the breakout would be an ideal opportunity to go long and aim for that range high before expecting resistance.
Bearish scenario: The lower highs keep printing until the midpoint is lost and price accepts below it, that would then signify to me the new trading range is between Range Low and Midpoint.
The fakeout scenario is a risk but with price so close to the midpoint already it follows the same invalidation criteria as the bullish scenario, the midpoint is vital to both sides.

Sweep-&-Reclaim at Range HighXRP is holding the upper third of the range with liquidity building on both sides. Classic SMC setup: sweep the inside of the range → reclaim → trend continuation upward. Confluence from author view: strenSetup & Levels
Entry idea: $2.70-2.80 (limit after reclaim)
Stop: $2.62 (below range low/liquidity pocket) → -9.66%
Target: $3.70 → +33.59%
R:R: ~3.29 : 1
Decision/Flip zone: prior range high / reclaim line around $2.90
Liquidity pools: equal lows cluster below $2.70–$2.62, resting buys above $3.30–$3.50 into $3.70
Scenarios
A) Sweep & Reclaim (Preferred)
Trigger: Wick below the mid/inner range (ideally toward $2.80–$2.75), H1/H4 SFP + close back above $2.90 (acceptance).
Execution: Buy the reclaim > $2.90 or first retest of $2.90 as support.
Targets:
TP1: $3.25–$3.35 (range mid/imbalance fill)** — reduce 30–50%
TP2: $3.70 (range high extension)
Invalidation: H4 close back below $2.90 after reclaim (failed acceptance) or hard stop $2.62.
B) Direct Continuation from $2.90
Trigger: Clean H1/H4 hold above $2.90 without deep sweep.
Execution: Limit at $2.90–$2.93 with tight risk to plan stop.
Targets: Same as A (TP1 $3.25–$3.35, TP2 $3.70).
Invalidation: H4 close < $2.90 (acceptance lost) or hard stop $2.62.
Bearish Invalidation Scenario
Daily close < $2.62 = range demand lost → idea invalid. Stand aside and reassess lower liquidity magnets.
Risk Management
Move stop to BE on break-and-hold >$3.25 or after TP1 hit.
If entry comes after a deep sweep, allow for one retest of the flip before tightening stops.
Avoid chasing mid-range; wait for acceptance signals, not just wicks.
Smart Money View
Purposeful liquidity take below intra-range lows to fuel a reclaim bid.
Equal lows near the stop zone invite the sweep; equal highs overhead (into $3.70) offer the draw.gth into alt rotation once majors resolve.

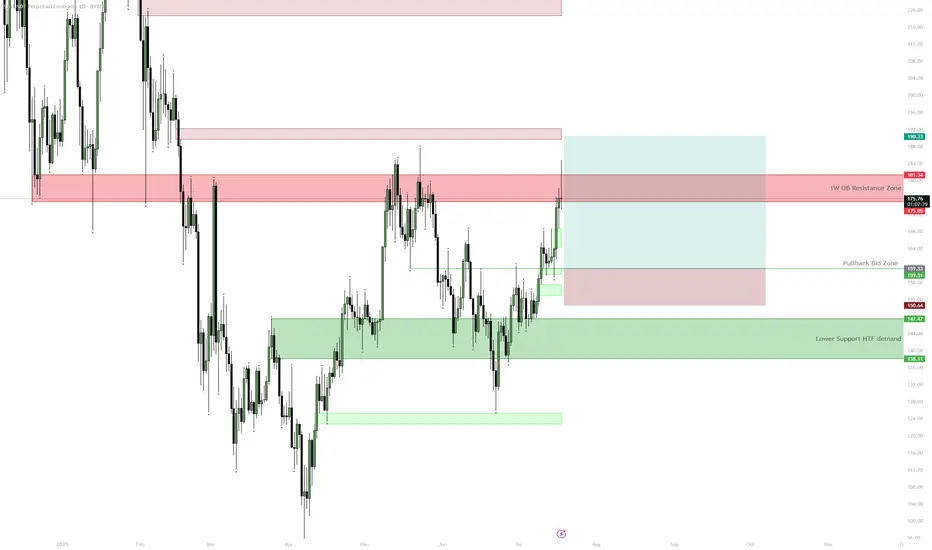
SOL — $180 HTF Resistance | Consolidation ExpectedSOL is approaching a key HTF resistance zone at $175–$181 with 1D RSI close to overbought. Unless price cleanly breaks above this area, a pullback to $160 or even the $138–$147 demand zone is likely before further upside. The setup provides a better risk/reward for longs on pullbacks after consolidation rather than chasing at resistance.
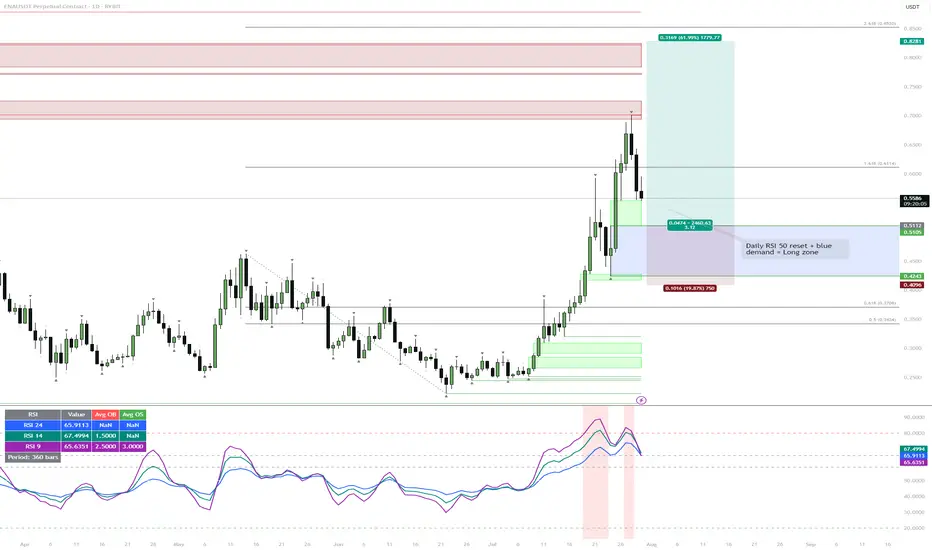
ENA | Waiting for the Daily RSI 50 ResetWatching for price to drop into the blue demand zone while the daily RSI resets to the 50 level. If both conditions align, that's the next high-probability long setup.
Reasoning:
Strong rally has left RSI elevated, so a cool-down is likely.
The blue zone lines up with the prior breakout and consolidation, so it's a logical area for buyers to step in.
A confluence of demand and neutral RSI usually provides the best R:R for trend continuation.
BTC | Swing Plan UpdatePrice failed to break out above 1D supply and sharply rejected, losing key 4H demand at $117,300.
HTF demand at $109,000 (1D FVG + BOS + S/R) is the next major area of interest—this is where I’ll look for fresh swing setups if the market flushes further.
No need to rush new positions until a clean setup prints or levels are reclaimed.
Plan:
Wait for price to test $109,000 zone before considering a swing long.
Only consider LTF scalp longs if we reclaim the 4H BOS at $118,300.
Stay flat until high-probability entry, let the market show its hand.

BTC – Still looking heavy below key resistanceDespite a short-term relief bounce after Monday’s drop, BTC remains below the critical 1D MSS + S/R (red box). Structure is weak until this level is reclaimed. Bears remain in control as long as price can’t close above 115.7k.
Plan:
Maintain bearish bias while below the red box — expecting new lows, targeting the green demand/OB cluster around 108.3k.
Flip the red box (close above 115.7k) and the outlook shifts to neutral or bullish.

BTC Broke the downtrendCRYPTOCAP:BTC has broken a descending trendline and is pushing toward the mid-range resistance at 119,500. Above that sits a liquidity pocket at 121,000, with the range high at 123,250.
Momentum signals on higher timeframes remain bullish, with accumulation patterns in place, but lower timeframes show bearish RSI divergences, suggesting the potential for a pullback before continuation.
Bullish scenario:
Hold above 117,000 – 117,454 (4H Bull FVG) keeps bullish momentum intact.
Break and close above 119,500 sets up a liquidity sweep at 121,000.
If momentum sustains, an extension toward 123,250 (Range High) becomes possible.
Bearish / Invalidation scenario:
Rejection from 119,500 followed by a break below 117,000 could pull price back toward 115,750 (Range Low).
Loss of 115,750 exposes deeper retrace into 1W Bull FVG 110,655 – 115,900.
Trading plan:
Watch for breakout + retest of 119,500 to target 121k.
Take partial profits into 121,000; leave runner toward 123,250.
Protect downside if price loses 117,000.

XLM Price holding multi-TF Bull FVGCRYPTOCAP:XLM is trading inside a multi-timeframe Bullish FVG cluster (0.40 – 0.4368) with confluence from 1W, 1D, and 4H charts. Price is holding above POI that previously triggered bullish continuation.
Bullish scenario (#long):
Accumulate within 0.42 – 0.41 zone.
Breakout above 4H Sell FVG (0.44 – 0.46) confirms upside momentum.
Progressive take-profits: 0.5206 → 0.5606 → 0.6081 → final at 0.6374.
Bearish scenario / Invalidation:
Breakdown and close below 0.41 shifts bias to bearish, opening path to deeper retrace toward 0.36 and potentially re-testing lower 1W Bull FVG levels.
Trading plan:
Entry: 50% at 0.42, 50% at 0.41.
Stop Loss: Below 0.41.
Take Profits: As per targets above.
Bias: Bullish while price remains above 0.41.

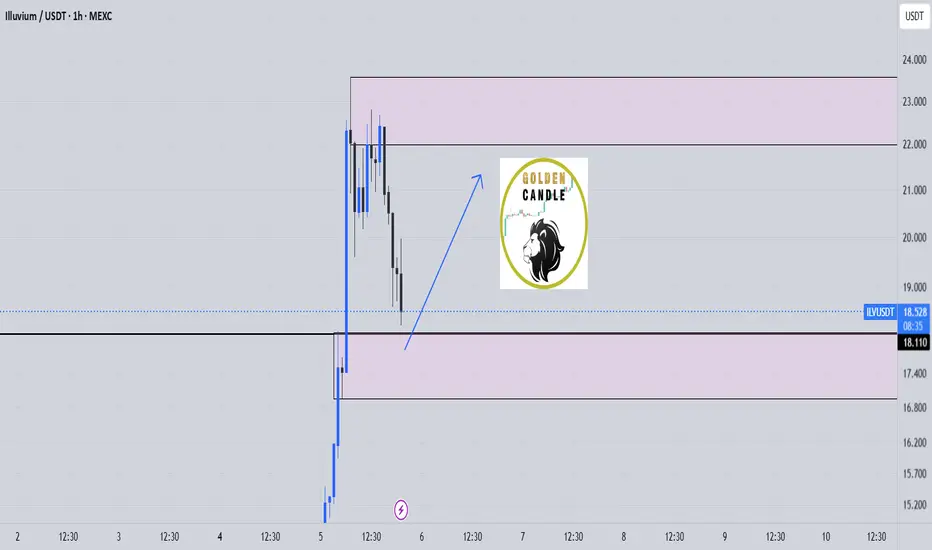
ilv buy midterm"🌟 Welcome to Golden Candle! 🌟
We're a team of 📈 passionate traders 📉 who love sharing our 🔍 technical analysis insights 🔎 with the TradingView community. 🌎
Our goal is to provide 💡 valuable perspectives 💡 on market trends and patterns, but 🚫 please note that our analyses are not intended as buy or sell recommendations. 🚫
Instead, they reflect our own 💭 personal attitudes and thoughts. 💭
Follow along and 📚 learn 📚 from our analyses! 📊💡"
ARB – Critical Support ZonePrice is retesting a major support at $0.363. This level has acted as a strong pivot multiple times in the past, providing both support and resistance. Bulls need to hold this zone to avoid a deeper retrace. Below it, next support is down at $0.264.
Plan:
• Hold above $0.363 – could see a local bounce and retest of $0.44–0.50 resistance
• Lose $0.363 – opens the way for a larger flush down toward $0.26
• No setup for longs if we close below support — would flip bias to short on breakdown

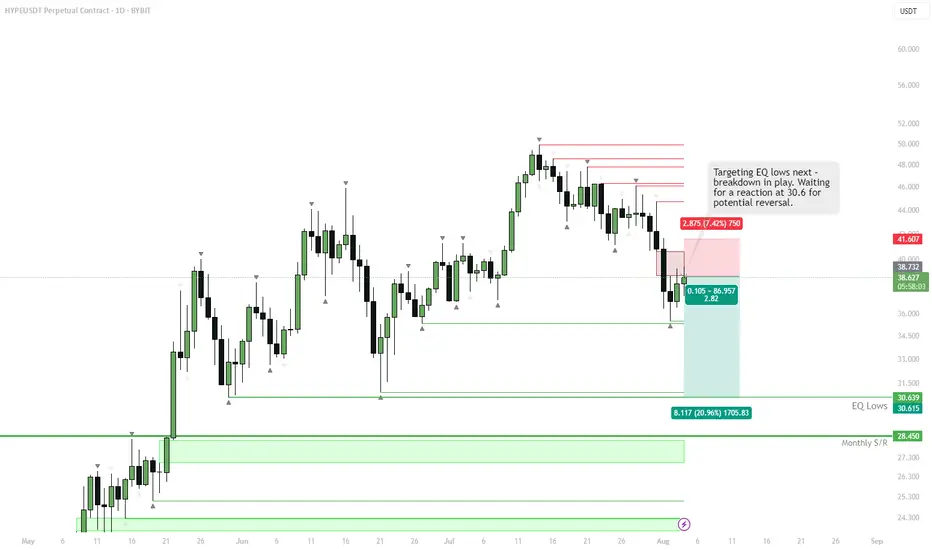
HYPE – EQ lows next Local breakdown confirmed after losing support, with no clear reversal signal yet. Structure favors a continued move lower toward the equal lows around 30.64. Momentum is still to the downside, so no reason to anticipate a bounce early.
Plan:
• Main target: EQ lows zone (~30.64)
• If monthly S/R at 28.45 doesn’t hold, further downside opens up
• No long setups until a reaction and reclaim of a key support
SUI | Spot Buy Zone for PullbackPrice has pulled back after a local top and is heading toward a clear demand zone.
Key buy area sits around $3.12, aligned with 0.618 retracement and recent consolidation.
Strong structure below—if majors keep retracing, this is where risk/reward for new spot buys becomes attractive.
Plan:
Waiting for price to reach the green zone to accumulate spot.
Invalidation below $2.80, targeting a move back toward $4.45 and higher if momentum returns.

HYPE | Sweep & Reclaim SetupPlan:
Watching for a sweep into the blue H4 Untapped Demand zone, then a reclaim of 41.237 (green line) to add longs.
Ideal target: new ATH and 55 extension.
If the blue zone fails or we can't reclaim 41.237, risk-off mode: equal lows at 30.6 could be the draw.
Reasoning:
A sweep into demand would reset local liquidity and trap late shorts.
Reclaiming 41.237 confirms a shift in momentum and invalidates the breakdown.
Structure is bullish above 41.237; below, risk increases for deeper downside.
