Nice XLM chart.I think that even though Lumens is quite an old asset, it will show itself again.
I am starting to work more often with MOTT and I am also starting to experiment with Linear Regression Oscillator .
We can see that the reversal signal has been received.
The price is confidently contracting above

HopiumI’m gonna trade XLM purely based on this piece of Hopium. Sell target is 40-45 cents. After that XLM will go back to 20-25 cents. These are pure speculation and guesswork. This is not an analysis.

XLMUSDT.PXLMUSDT.P is in bullish trend.
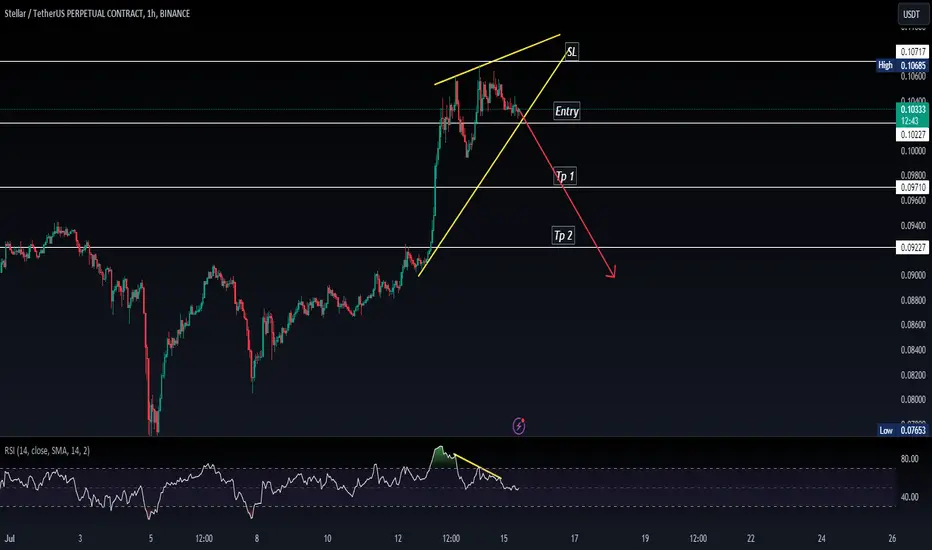
Bearish divergence also shown in RSI.
Bearish rising edge reversal pattern also form .
WE wait and watch for the breakout of wedge pattern
XLM is comingXLM is a project i despise but, it's chart is beautiful in all timeframes below 1W <3
Retesting a daily golden cross with bulish indicators
4H TF is at good support in the indicators
15min is screaming breakout

XLMUSDT SellStellar sell signal on H4 chart. We see consolidation between 0.1010 - 0.1075 level. Now bears are ready to retest bulls power at 0.097 level. Risk Reward 1:2.5

XLMUSDTWe can attempt to short XLMUSDT from specified level if it break HL , also bearish divergence occur indicate that it moves downward.
SL , TP mention in chart.

Everyone is waiting for XRP, but XLM will flyThe Coinbase exchange has filed documents with the CFTC to list US-regulated futures.
On the chart we see that wave 2 may be completed after 1 diagonal. We are waiting for a big 3rd wave of growth to 0.45-0.5$ and a second target of 1.2$

Axis of ResistanceXLM must be able to break through all these resistance levels for a reversal. based on price action xlm has rejected every single resistance level and has failed to find support. alts bottom out after btc, the bottom for this bearish move is not in. price action says xlm will reject the next resista

Learn Somethingusually when price breaks above a trendline, a successful retest is a pull back to the trendline and a violent buying pressure. we will assume that my trendline is correct. if xlm is really in a bull market, then upon breaking out of the triangle and a pullback to the trendline it had to print multi

Descending TriangleSupport and Resistance trend lines are shown. we will go to support before breaking out of the triangle to the upside. buy area = $0.07

See all ideas
Frequently Asked Questions
The current price of Stellar / TetherUS (XLM) is 0.1030 USDT — it has fallen 0.10% in the past 24 hours. Try placing this info into the context by checking out what coins are also gaining and losing at the moment and seeing XLM price chart.
Stellar / TetherUS price has fallen by 2.18% over the last week, its month performance shows a 14.06% increase, and as for the last year, Stellar / TetherUS has decreased by 35.34%. See more dynamics on XLM price chart.
Keep track of coins' changes with our Crypto heatmap.
Keep track of coins' changes with our Crypto heatmap.
Stellar / TetherUS (XLM) reached its highest price on May 16, 2021 — it amounted to 0.7985 USDT. Find more insights on the XLM price chart.
See the list of crypto gainers and choose what best fits your strategy.
See the list of crypto gainers and choose what best fits your strategy.
Stellar / TetherUS (XLM) reached the lowest price of 0.0260 USDT on Mar 13, 2020. View more Stellar / TetherUS dynamics on the price chart.
See the list of crypto losers to find unexpected opportunities.
See the list of crypto losers to find unexpected opportunities.
The safest choice when buying XLM is to go to a well-known crypto exchange. Some of the popular names are Binance, Coinbase, Kraken. But you'll have to find a reliable broker and create an account first. You can trade XLM right from TradingView charts — just choose a broker and connect to your account.
Crypto markets are famous for their volatility, so one should study all the available stats before adding crypto assets to their portfolio. Very often it's technical analysis that comes in handy. We prepared technical ratings for Stellar / TetherUS (XLM): today its technical analysis shows the buy signal, and according to the 1 week rating XLM shows the sell signal. And you'd better dig deeper and study 1 month rating too — it's sell. Find inspiration in Stellar / TetherUS trading ideas and keep track of what's moving crypto markets with our crypto news feed.
Stellar / TetherUS (XLM) is just as reliable as any other crypto asset — this corner of the world market is highly volatile. Today, for instance, Stellar / TetherUS is estimated as 0.39% volatile. The only thing it means is that you must prepare and examine all available information before making a decision. And if you're not sure about Stellar / TetherUS, you can find more inspiration in our curated watchlists.
You can discuss Stellar / TetherUS (XLM) with other users in our public chats, Minds or in the comments to Ideas.