XRPUSD 1H EMA CROSSOVER STRATEGYStep #1: Plot on your chart the 20 and 50 EMA
The first step is to properly set up our charts with the right moving averages. We can identify the EMA crossover at the later stage. The exponential moving average strategy uses the 20 and 50 periods EMA.
Most standard trading platforms come with default moving average indicators. It should not be a problem to locate the EMA either on your MT4 platform or Tradingview.
Step #2: Wait for the EMA crossover and for the price to trade above the 20 and 50 EMA.
The second rule of this moving average strategy is the need for the price to trade above both 20 and 50 EMA. Secondly, we need to wait for the EMA crossover, which will add weight to the bullish case.
We refer to the EMA crossover for a buy trade when the 20-EMA crosses above the 50-EMA.
By looking at the EMA crossover, we create an automatic buy and sell signals.
Since the market is prone to false breakouts, we need more evidence than a simple EMA crossover. At this stage, we don’t know if the bullish sentiment is strong enough to push the price further after we buy to make a profit.
To avoid the false breakout, we added a new confluence to support our view. This brings us to the next step of the strategy.
Step #3: Wait for the zone between 20 and 50 EMA to be tested at least twice, then look for buying opportunities.
The conviction behind this moving average strategy relies on multiple factors. After the EMA crossover happened, we need to exercise more patience. We will wait for two successive and successful retests of the zone between the 20 and 50 EMA.
The two successful retests of the zone between 20 and 50 EMA give the market enough time to develop a trend.
Never forget that no price is too high to buy in trading. And no price is too low to sell.
Note* When we refer to the “zone between 20 and 50EMA,” we actually don’t mean that the price needs to trade in the space between the two moving averages.
We just wanted to cover the whole price spectrum between the two EMAs. This is because the price will only briefly touch the shorter moving average (20-EMA). But this is still a successful retest.
Now, we still need to define where exactly we are going to buy. This brings us to the next step of the strategy.
Step #4: Buy at the market when we retest the zone between 20 and 50 EMA for the third time.
If the price successfully retests the zone between 20 and 50 EMA for the third time, we go ahead and buy at the market price. We now have enough evidence that the bullish momentum is strong to continue pushing this market higher.
Now, we still need to define where to place our protective stop loss and where to take profits. This brings us to the next step of the strategy.
Step #5: Place the protective Stop Los 20 pips below the 50 EMA
After the EMA crossover happened, and after we had two successive retests, we know the trend is up. As long as we trade above both exponential moving averages the trend remains intact.
In this regard, we place our protective stop loss 20 pips below the 50 EMA. We added a buffer of 20 pips because we understand we’re not living in a perfect world. The market is prone to do false breakouts.
Step #6: You choose TP or Take Profit once we break and close below the 50-EMA
In this particular case, we don't use the same exit technique as our entry technique, which was based on the EMA crossover.
If we waited for the EMA crossover to happen on the other side, we would have given back some of the potential profits. We need to consider the fact that the exponential moving averages are a lagging indicator.
The exponential moving average formula used to plot our EMAs allow us to still take profits right at the time the market is about to reverse.
Note** The above was an example of a BUY trade. Use the same rules – but in reverse – for a SELL trade. However, because the market goes down much faster, we sell on the 1st retest of the zone between 20 and 50. After the EMA crossover happened.
1h


SELL bitcoin $8555 - $8645 Limit SELL Orders from $ 8555 - $8645
Reason 4 Trade: ewCount | RSI Div. | MACD Div.(Sell Signal) | Just Bcuz ))
TP: $ 8313 - $ 8300
Risk: 8/10
1% MAX Position Allocation
7x leverage (Cross leverage)
**Always USE Protection** ))
Stop Loss : ABOVE $8750

BTCUSD 4H 1H DESCENDING CHANNEL BEARISH BREAKOUTStep#1: Draw a Price Channel if you are able to see at least two Higher Highs and Higher Lows. The Price Channel pattern is drawn by connecting the highs and lows.
During this stage, we’re looking for distinctive price action that can be contained within two parallel lines. These lines will ultimately form the Price Channel Pattern.
If you’re able to spot two consecutive swing highs followed by two consecutive two higher lows you simply connect these points using the Price Channel tool.
The majority of the trading platforms has incorporated into their default trading tools the Price Channel indicator.
Step #2: Wait for a Swing High to fail to reach the top of the Price Channel pattern.
In the case of an ascending or upward Price Channel pattern the first warning signal that the price will fail to trade within the boundaries set by the Price Channel Pattern presents itself when the last swing high point fails to reach the top of the channel.
Only our Price Channel trading strategy makes use of this powerful price reading technique because our team at Trading Strategy Guide has developed the “early signs” of Price Channel breakout.
The fail attempt to test again the top of the Price Channel is a sign of price weakness which is confirmed when the price also fails to bounce off the Price Channel bottom and breaks it instead.
Note* - The more times a swing High fails to reach the top of the Price Channel pattern the better the trade setup
Step #3: Wait for the Price Channel breakout and for breakout confirmation
One of the worst mistakes traders does when trading Price Channel patterns is that they don’t wait for confirmation signal when the breakout happens.
You should always wait for breakout confirmation!
What do we mean by breakout confirmation?
In simple terms, we want the breakout candle to post a close below the Price Channel bottom to confirm the breakout. We also have training on How to use Japanese Candlesticks.
So we don’t just wait for the Price Channel breakout, but instead, we also want to see the breakout candle closing below the Price Channel pattern. This is a very simple way to avoid many of the false breakout signals.
Note* - The breakout candle needs to be a big decisive looking candle, but it’s not mandatory
Step #4: Sell right at the Breakout Candle Closing Price
The Price Channel trading strategy uses a very simple trade entry technique.
A sell order is triggered at the breakout candle closing price.
The Price Channel breakout technique provides us with an entry signal that you can be confident in executing the trade.
The next logical thing we need to establish for the Price Channel trading strategy is where to take profits.
Step #5: Take Profit 1 at the 50% Fibonacci Retracement of the previous trend, Take Profit 2 at the starting point of the Price Channel
The Price Channel trading strategy employs multiple entry techniques.
Our first potential take profit zone is the 50% Fibonacci retracement of the previous trend.
What do we mean by the previous trend?
The trend that was contained within the Price Channel pattern. So plot the Fibonacci retracement indicator between the high and the low of the price channel.
The second potential take profit zone is the Price channel starting point.
Step #6: Place the protective stop loss above the swing high prior to the Price Channel breakout
We’re adopting a very conservative approach when it comes to the stop loss technique. Simply hide the stop loss above the swing high prior to the Price Channel breakout.
We also recommend you to trail your stop loss above the last swing high once you cash in on the first portion of the trade.

USDCAD 1H WHAT DOES TRADEABLE OPEN SPACE MEANLook to the left at the past candles.
Trade 1 had a long body bearish candle to the left so price is rising through that space now.
Above trade 1 box you see several candles in a consolidation sideways move which creates a resistance zone.
If price can break through that resistance zone then you see to the left several long body bearish candles.
This will be the tradeable open space for trade 2 to pass through in a bullish trade.

USDCHF 1H - Move along Trendline to Daily R3/Weekly R2OANDA:USDCHF
Price currently moving up along a trend line that is also the 20EMA and mid Bollinger Band. Reaching a squeeze point between the Daily R1 and 75 Fib and upper Bollinger Band. Expecting price break to the upside to the daily R3 which is also the weekly R2 and psychological 0.9980 (just below 1.00).
Watch for a break of the trendline to the downside as price could retrace to daily Pivot at 0.9890 and 55EMA.


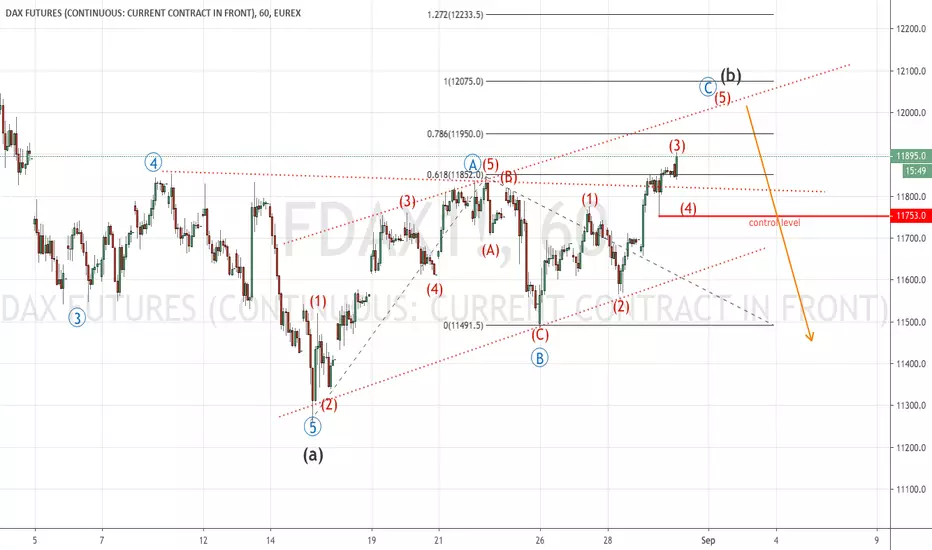
FDAX/DAX 1H alternive EW Count (ABCDE Szenario) Please take look at the DAX Big Picutre Analysis to understand this EW Count more deeply. Should we break the red control level (around 11740) in the next couple of session then I would prefere this ABCDE Szenrio over the (ABC) Szenario which I have postet prior. As long as the Index stays above the red control level I prefere the ABC count.

FDAX/DAX 1H EW Count Update (ABC Szenario)Please take a look at the DAX Big Picture Analysis to understand the EW Count. As long as we are staying over the red control level (around 11740) there should be an ABC up in play which will end around the 12K level.

USDCAD - Waiting for Reversal PatternHi Traders!
The market was just moving up for the recent candles.
Now it reaches the next resistance level.
We expect the market to pull back.
We recommend to sell with a risk-to-reward ratio of 1 to 4.5.
But wait for the reversal pattern :)!
Thanks and good luck!

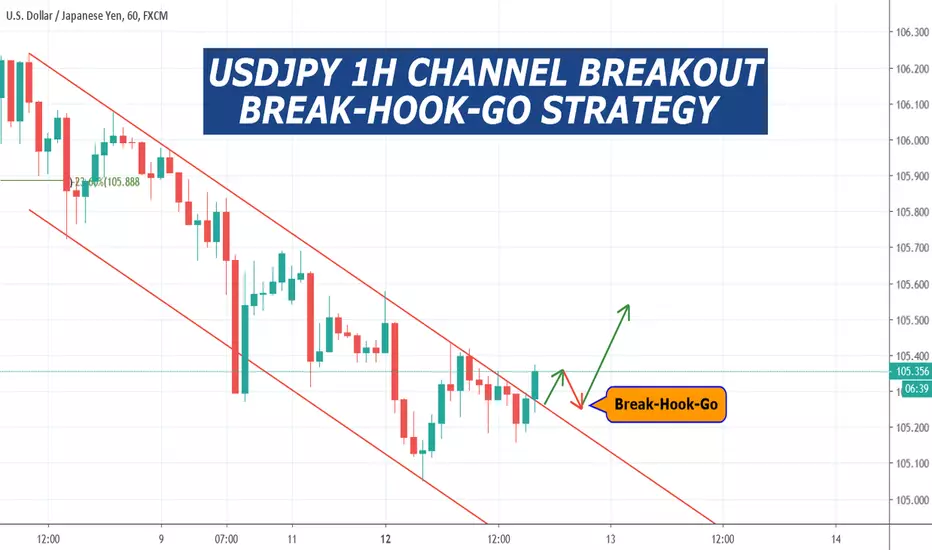
USDJPY 1H CHANNEL BREAKOUT - BREAK HOOK GO STRATEGYPrice is in a descending channel pattern
Price has broken out of the top of the channel
Wait for a Break-Hook-Go price pattern
You can watch for this BHG pattern on a 15m chart
After a Bearish Pullback Hook move then enter after 2 green 15m candles
Let us know what you determine your TP & SL is.


EURGBP 1H/15M RABBIT TRADING STRATEGYStep 1 on a 1H chart find a channel
Step 2 Find a breakout of channel
Step 3 on a 15m chart find a bullish pullback
Step 4 Wait for 2 bearish candles to close then ENTER
Step 5 Place your TP 50 pips away
Step 6 Place SL above the last resistance point
Rabbit Trail Channel Trading Strategy Link
tradingstrategyguides.com

BANKER'S FAVORITE FX PATTERNSILVER FUTURES 1D ORB NR4 STRATEGY
Step 1 Find ORB Nr4
Step 2 Mark Hi & Lo of 4th candle
Step 3 1H chart Buy break Hi/Sell break Lo
Step 4 SL above/below 4th candle
Step 5 TP trail SL above/below each 1H candle
ORB NR4 Strategy Link
tradingstrategyguides.com

XBTUSD 1H BIG THREE LONG TRADEThe Big Three Indicator has found a bullish pullback retracement or bullish reversal. \
Let's see what happens.

USDJPY 1H EFC INDICATOR STRATEGYEFC Indicator has found a Bearish reversal
EFC Indicator shows:
Entry Signal
Take Profit Signal
Stop Loss Signal
PM if you have any question on the EFC Indicator I can help you with

Light Crude Oil 1H Ichimoku StrategyStep 1 Price breaks below cloud
Step 2 Blue line crosses below Red line
Step 3 Buy at open of next candle
Step 4 SL above breakout candle
Step 5 TP when Blue line crosses above Red line

GBPJPY - 1H ChartHello Traders,
In this pair I see a possible retracement to the Little Accurate Support (Yellow)
and a rejection of the 0.236 Fib Level and 0.50 Fib Level to the 136.000 Level.
If you agree with the idea please comment, like and follow me on TradingView.
Be patient, Good luck.

GBPAUD - 4H ChartHello Traders,
In this pair I see a possible retracement to the little resistance and a rejection of the 0.618 Fib Level
with a clear Pin bar or a Engulfing Candlestick to the 1.75000 Level.
If you agree with the idea please comment, like and follow me on TradingView.
Be patient, Good luck.


LTCUSD 1H ATR STRATEGYStep #1: Make Sure Your Chart Setup Configuration Looks the Same as our Price Chart
Step #2: Wait for ATR Indicator to break above 20-EMA
Step #3: Check the Price Chart to Ensure the ATR Breakout is followed by a Price Breakout
Step #4: Enter Short Once we break Below the Low of the Breakout Candle
Step #5: Your Take Profit Target should be Equal to the ATR indicator value
Step #5: You determine your own TP strategy
Step #6: Place the Stop Loss above the Breakout Candle High
Note** The above was an example of a SELL trade. Use the same rules – but with the only difference that you need a bullish breakout candle – for a BUY trade.
