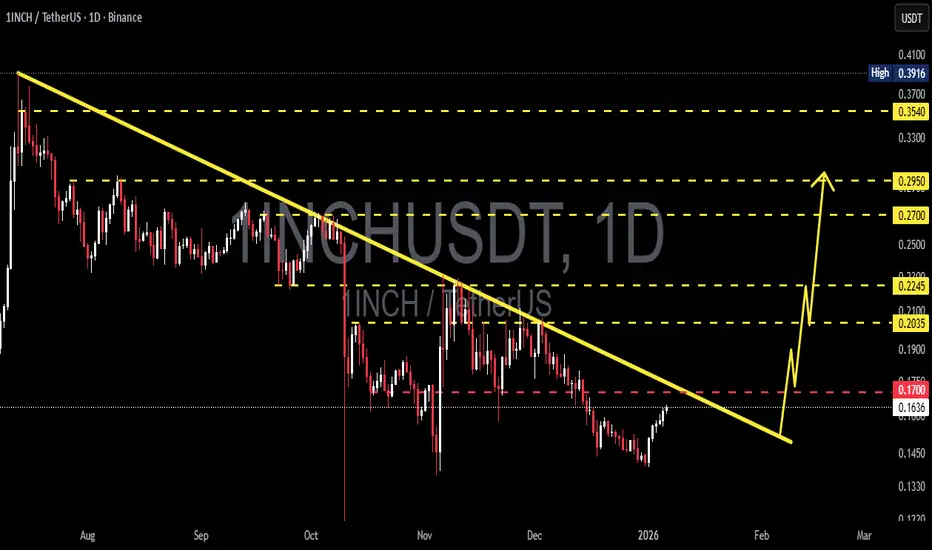
1INCH/USDT – Test Downtrend Resistance | Breakout or Rejection?1INCH/USDT remains in a medium to long-term downtrend, clearly characterized by a sequence of lower highs and lower lows since the previous peak. Price is currently experiencing a relief rally, moving upward toward a major descending trendline resistance that has historically capped bullish attempts.
This area represents a critical decision zone. Market participants are closely watching whether price will break the trendline or get rejected and continue the bearish structure.
---
Pattern Explanation
Descending Trendline (Bearish Market Structure)
The descending trendline has been respected multiple times, acting as a strong dynamic resistance.
Each previous touch of this trendline resulted in price rejection and continuation to the downside.
Price is now approaching the same trendline again, making this level technically significant.
Potential Bearish Continuation Structure
Overall structure still favors sellers unless a confirmed breakout occurs.
Failure to break above resistance may form a bearish continuation setup, leading to another impulsive drop.
---
Key Levels
Resistance Zones
0.1700 USDT – Minor resistance / reaction zone
0.2035 USDT – Key resistance & trendline breakout level
0.2245 USDT – Strong resistance / confirmation level
0.2700 – 0.2950 USDT – Upper supply zone
0.3540 USDT – Major resistance / previous range high
Support Zones
0.1635 USDT – Short-term support
0.1450 – 0.1330 USDT – Major demand zone
A breakdown below this zone would strengthen the bearish continuation scenario.
---
Bullish Scenario
Price breaks and closes above the descending trendline on the daily timeframe.
Strong confirmation occurs with a daily close above 0.2035 USDT.
This would invalidate the bearish structure and signal a potential trend reversal.
Bullish targets:
0.2245 USDT
0.2700 USDT
0.2950 USDT
Increasing volume during breakout would further support bullish momentum.
Bias: Trend reversal if breakout is confirmed.
---
Bearish Scenario
Price fails to break the trendline and shows rejection (bearish candle / long upper wick).
Rejection around 0.1700 – 0.2035 USDT confirms seller dominance.
Downside targets:
0.1635 USDT
0.1450 USDT
0.1330 USDT
A clean breakdown below support would confirm bearish continuation.
Bias: Bearish continuation if rejection occurs.
---
Conclusion
1INCH/USDT is currently trading at a major technical inflection point. The descending trendline acts as the key level determining the next major move.
Traders should wait for clear confirmation — either a breakout for bullish continuation or a rejection for bearish continuation.
This is a high-risk, high-impact zone, best traded with confirmation and proper risk management.
---
#1INCH #1INCHUSDT #CryptoAnalysis #TechnicalAnalysis #Altcoins #Downtrend #Trendline #SupportResistance #Breakout #Bearish #Bullish #PriceAction
1inch
1INCH: Swing position on the daily chart.Excellent structure. I removed the fat — liquidity capture.
The target is 0.204.
When 0.17 is reached, I will secure part of the profit and move the stop to break even.
BYBIT:1INCHUSDT.P

#1INCHUSDT — Accumulation or the Beginning of a Breakdown?#1INCH
The price is moving within an ascending channel on the 1-hour timeframe and is adhering to it well. It is poised to break out strongly and retest the channel.
We have a downtrend line on the RSI indicator that is about to break and retest, which supports the upward move.
There is a key support zone in green at 0.1770, representing a strong support point.
We have a trend of consolidation above the 100-period moving average.
Entry price: 0.1909
First target: 0.1954
Second target: 0.2010
Third target: 0.2080
Don't forget a simple money management rule:
Place your stop-loss order below the green support zone.
Once you reach the first target, save some money and then change your stop-loss order to an entry order.
For any questions, please leave a comment.
Thank you.

1INCH Analysis (2H)The internal trendline has been broken and the structure is bearish. Below the current price, there is an important support level that has been tested multiple times, and lower highs have formed, indicating selling pressure.
The targets are marked on the chart.
A daily candle closing above the invalidation level will invalidate this analysis.
Do not enter the position without capital management and stop setting
Comment if you have any questions
thank you

$1INCH Update📊 $1INCH Update
$1INCH has formed a Double Top pattern 🧠
If price breaks below the 🔵 support zone, it could confirm a bearish setup 📉
Short-term target = 🟢 level 👇

1INCH/USDT — Accumulation or the Beginning of a Breakdown?The price of 1INCH is currently trading within a major historical support zone between 0.175 – 0.155 USDT, a level that has repeatedly acted as a key turning point since mid-2024.
Recently, the market revisited this critical zone under strong selling pressure but showed a sharp liquidity wick down to 0.1036 USDT, followed by an immediate recovery — a classic signal of liquidity absorption or a potential accumulation event by larger players.
In other words, this zone represents the final line of defense for buyers — holding above it could trigger a major rebound, while a confirmed breakdown below may lead to deeper capitulation.
---
Structure and Pattern Overview
Overall trend: still bearish, forming a sequence of lower highs and lower lows.
Yellow zone (0.175 – 0.155): a strong demand area that has acted as a reliable support multiple times.
Long wick to 0.1036: a sign of extreme liquidation followed by potential smart money accumulation.
Potential formation: if the price holds this zone and forms a higher low, a double bottom pattern could emerge — a classic early reversal signal.
---
Bullish Scenario
If 1INCH holds above 0.175 – 0.155 and forms a strong bullish 3D candle with rising volume, a potential reversal could begin.
Main confirmation: 3D candle close above 0.19 USDT.
Bullish targets:
0.2346 → first resistance to reclaim.
0.2730 → breakout confirmation level.
0.3515 → primary swing target if structure shifts bullish.
Narrative: this area could serve as a major accumulation base before the next markup phase, signaling that institutional buyers are quietly positioning before a broader trend reversal.
---
Bearish Scenario
If 1INCH closes below 0.155 USDT with strong momentum, the support zone will fail, and sellers will regain full control.
First downside target: 0.1036 (previous wick low).
Below 0.1036: the next psychological area lies around 0.09 – 0.08 USDT.
Narrative: a breakdown here would indicate full bearish dominance and could trigger a capitulation phase before any potential recovery.
---
Market Psychology
The 0.175 – 0.155 USDT zone represents a psychological battleground between fear and opportunity.
Retail traders who panic-sold below 0.16 may have provided the liquidity needed for smart money to accumulate positions.
If volume confirms steady buying interest within this area, we could soon witness the beginning of the next bullish markup phase for 1INCH.
---
Conclusion
1INCH is now standing at one of its most critical levels of 2025.
This is more than just a technical support — it’s the decisive zone for the medium-term trend.
Holding above 0.155 = possible start of a major reversal.
Breaking below 0.155 = potential continuation to 0.1036 or lower.
From this point, the market will decide whether 1INCH enters a strong accumulation phase or dives into its final capitulation stage.
---
#1INCH #CryptoAnalysis #1INCHUSDT #CryptoTrading #AltcoinWatch #ReversalZone #SupportZone #BearishVsBullish #PriceAction #MarketStructure #SwingTrade #LiquiditySweep

1INCH Analysis (12H)From the point marked START on the chart, a corrective phase seems to have formed on the 1INCH pair.
This phase appears to be a diametric, and we are currently in wave F of this diametric.
Within the red zone, wave F could terminate, after which wave G is expected to begin. Wave G is a bearish wave.
Targets are shown on the chart.
A daily candle close above the invalidation level will negate this analysis.
For risk management, please don't forget stop loss and capital management
When we reach the first target, save some profit and then change the stop to entry
Comment if you have any questions
Thank You

1INCH/USDT (3D) — at Demand Zone: Accumulation or Breakdown?Analysis:
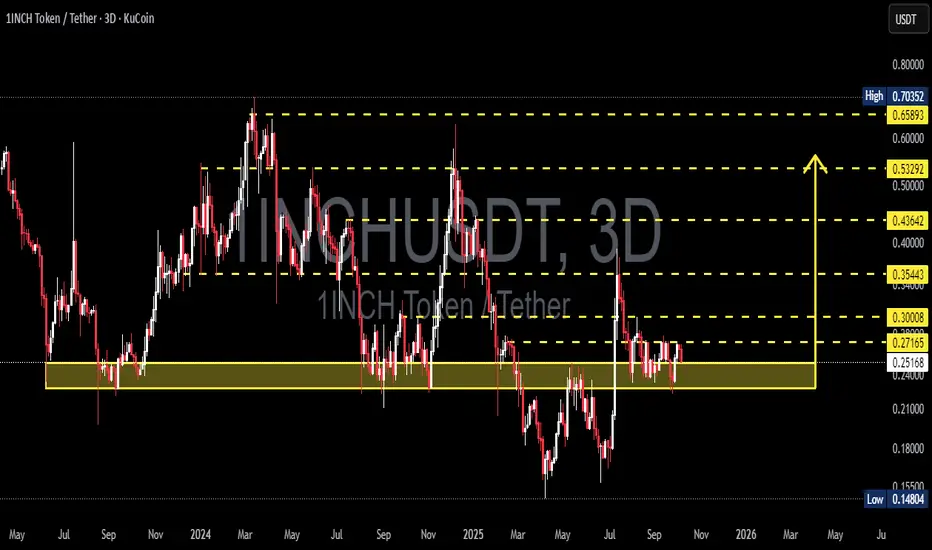
The 3-day chart shows 1INCH consolidating tightly within the 0.23–0.25 demand zone, an area that has acted as a critical base since mid-2024.
Every touch of this zone has triggered a strong bullish reaction, proving it’s a key defense area for buyers. However, repeated retests also weaken its strength — making this retest a make-or-break moment for the mid-term trend.
Price is currently moving sideways with declining volatility, suggesting the market is in a final consolidation phase before a major directional move.
This zone will decide whether we see a strong reversal rally or a structural breakdown into new lows.
---
Key Technical Structure
Demand Zone (Major Support): 0.23 – 0.25
Nearest Resistance: 0.27 – 0.30
Higher Resistances: 0.354 → 0.436 → 0.533 → 0.659
Major Support Below: 0.148
---
Price Structure & Pattern
1INCH has been forming a broad horizontal range with multiple retests at 0.23–0.25, signaling potential base accumulation.
However, the macro structure still shows a series of lower highs, keeping the overall trend bearish-to-neutral until a confirmed breakout occurs.
Long downside wicks around 0.23 indicate liquidity sweeps — a common sign of institutional accumulation before a major move.
---
Bullish Scenario
Confirmation:
A strong 3D candle close above 0.30 — confirming breakout from the range.
Implication:
Marks the end of accumulation and the beginning of a potential mid-term reversal structure.
Upside Targets:
TP1 → 0.354 (mid-range top)
TP2 → 0.436 (major supply)
TP3 → 0.533 (trend reversal confirmation)
TP4 → 0.659–0.703 (extended target)
Entry Strategy:
Conservative: wait for a 3D close above 0.30 and enter on retest.
Aggressive: enter near 0.23–0.25 upon bullish rejection, with a tight stop below 0.23.
Stop Loss: below 0.23 (breakdown invalidates setup).
---
Bearish Scenario
Confirmation:
A 3D close below 0.23 confirms structural breakdown from the base range.
Implication:
Signals a shift from accumulation to redistribution, resuming the broader downtrend.
Downside Targets:
0.20 → 0.18 (intermediate)
0.15 (major psychological and technical support)
Strategy:
Look for bearish rejection around 0.27–0.30 for short setups, or enter breakdown continuation trades below 0.23 with confirmation.
---
Conclusion
The 0.23–0.25 zone stands as the final equilibrium point between buyers and sellers — the golden demand zone that will dictate 1INCH’s next major trend.
A confirmed breakout above 0.30 could trigger a strong reversal toward 0.53–0.70, while a breakdown below 0.23 opens the door for a drop toward 0.15.
The market is silent — and this calmness often precedes a massive move.
---
#1INCH #CryptoAnalysis #TechnicalAnalysis #Altcoin #Breakout #PriceAction #CryptoTrading #SwingTrade #SupportResistance #MarketStructure #ReversalZone #CryptoMarket #ChartAnalysis
1INCH/USDT — Critical Accumulation Zone?🔎 Overview
Currently, 1INCH/USDT is trading around $0.2449, sitting right above the key demand zone at $0.21–$0.25 (yellow box). This level has repeatedly acted as a major support, preventing further downside.
On the 3D timeframe, price action shows extended corrective structure after a strong downtrend. This zone is now a make-or-break area: will it turn into an accumulation base for a new bullish cycle, or become a distribution zone before further decline?
---
📌 Market Structure & Price Action
Mid-term trend: still forming lower highs → bias remains neutral-to-bearish until reversal signs appear.
Yellow zone ($0.21–$0.25): major demand zone, repeatedly tested with strong rebounds.
Deep wick spikes → liquidity grabs / stop-hunts before price recovery.
Currently consolidating sideways above demand → market waiting for the next decisive move.
---
🟢 Bullish Scenario
For bullish confirmation, price needs:
1. Hold above $0.21–$0.25 zone.
2. Break & close 3D above $0.30 → early reversal confirmation.
3. Establish higher highs & higher lows → sign of trend shift.
📈 Upside targets:
R1: $0.300
R2: $0.354
R3: $0.436
R4: $0.532
R5: $0.659 – $0.703
With strong momentum, the $0.65–$0.70 zone could act as a mid-term price magnet.
---
🔴 Bearish Scenario
For bearish continuation, price needs:
1. 3D close below $0.21 with volume.
2. Failed retest (previous support flips into resistance).
📉 Downside targets:
S1: $0.190
S2: $0.165
S3: $0.148 (major low on chart)
Breaking below $0.148 would heavily weaken long-term structure for buyers.
---
🎯 Trading Approach & Risk Management
Swing setup: Long from $0.22–$0.24 with stop below $0.195 → target $0.30+.
Breakout setup: Wait for 3D close > $0.305, enter on retest → target $0.354+.
Short setup: Only valid if 3D close < $0.205 with failed retest → targets $0.165–$0.148.
⚠️ Risk note: Keep per-trade risk under 1–3% of capital. Always use stop losses.
---
📊 Key Levels
Main demand/support: $0.21–$0.25
Major resistances: $0.30 → $0.35 → $0.43 → $0.53 → $0.65–0.70
Critical low: $0.148
---
✨ Conclusion
1INCH/USDT is at a decisive crossroads.
Holding the $0.21–$0.25 zone could trigger a bounce toward $0.30 and potentially higher. However, a confirmed breakdown below $0.21 exposes the market to deeper correction toward $0.19–$0.148.
Traders should carefully watch the 3D candle close and volume confirmation before committing to directional trades.
---
#1INCH #1INCHUSDT #CryptoAnalysis #Altcoin #TechnicalAnalysis #CryptoTrading #PriceAction #SwingTrading #BreakoutSetup

1INCH - LONG SET-UP BINANCE:1INCHUSDT
1INCH Long Set-up 📈
Looking good to long between 0.2130 - 0.2241 🔼
SL Below 0.20 or as per your risk capacity 🔽

1INCH/USDT — Golden Pocket Re-Test at a Critical Zone!Currently, 1INCH/USDT is trading around $0.2568, sitting right at the Golden Pocket (Fibonacci 0.5–0.618) between $0.242–$0.263. This area is highly significant because:
It has acted as a historical demand zone since 2023, often serving as both support and resistance.
It will determine whether buyers can defend this level for a recovery, or if a breakdown towards lower support levels will occur.
---
🔎 Market Structure & Pattern
Macro trend: Since topping near $0.70, the market has been printing lower highs & lower lows → bearish bias still present.
Golden Pocket zone: Represents a potential accumulation area, where smart money often positions for a reversal.
Recent price action: A sharp retracement occurred after rejection at higher levels, and price is now testing this crucial zone again.
---
🚀 Bullish Scenario
If 1INCH manages to hold above $0.242 and closes the 3D candle strong:
1. This will confirm a successful retest at the golden pocket → strong signal for a rebound.
2. Further confirmation if price breaks & closes above $0.300 with volume.
🎯 Upside Targets:
TP1: $0.300 (+16.9%)
TP2: $0.354 (+38%)
TP3: $0.436 (+70%)
Extended targets if momentum continues: $0.532 – $0.658
📌 Bullish Invalidation: 3D close below $0.242 → bullish thesis fails.
---
🐻 Bearish Scenario
If the golden pocket fails to hold and price closes below $0.242:
1. Support flips to resistance → opening the path for deeper downside.
2. Price may revisit $0.19, with extended risk toward the swing low at $0.148.
🎯 Downside Targets:
TP1: $0.190 (–26%)
TP2: $0.148 (–42%)
📌 Bearish Invalidation: A strong reclaim and close above $0.300 would cancel the bearish outlook.
---
📌 Conclusion & Strategy
$0.242–$0.263 = Decision Zone.
Bullish case: A rebound from this zone could fuel a swing rally toward $0.354 – $0.436.
Bearish case: A breakdown below $0.242 targets $0.19 – $0.148.
Watch for 3D candle close & volume confirmation → critical for the next major move.
👉 Aggressive traders may position within the golden pocket with tight risk management, while conservative traders should wait for 3D confirmation before committing.
#1INCH #1INCHUSDT #CryptoAnalysis #Altcoins #SwingTrade #Fibonacci #SupportResistance #DeFi

1inchSaw that band was pumping with link..
Band being an alternative ethethereum oracle, got me thinking 🤔 there could be an ecosystem wide ethereum network speculative move if eth breaks into aths, uni aave link and crv being some of the bluechip ecosystem coins, they all have derivatives 1inch is a dex aggregator, finding the cheapest route amongst dexs for swaps.
With a speculative wave comes congestion, price premiums etc so tradfi might be getting educated on aggregators quite quickly if they hear there's better swap rates during the speculative wave. 1inch's time to shine. Technically speaking we've been in a long accumulation zone after a mass market alt drawdown from 2022.
A retest of the MA50 1M would be about a 3x from here given how low these alternative coins ended up ~98% from aths.

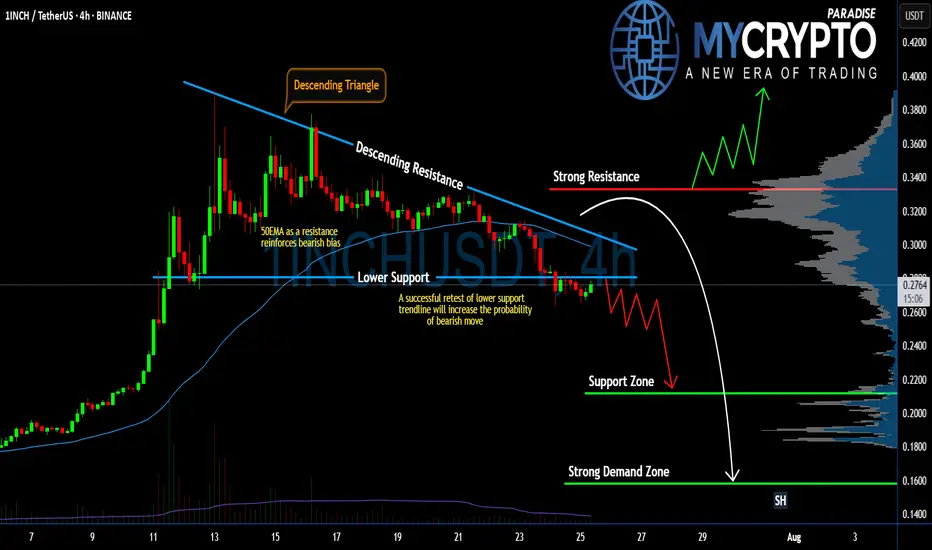
#1INCH Setup Favors Bears | Can Bears Pull it Down Further? Yello Paradisers! Are you prepared for what might be the next big move on #1INCHUSDT? The #1INCHNetwork is flashing clear warning signs:
💎#1INCH is currently trading inside a Descending Triangle, a pattern that historically favors bears. The price has broken down the lower support and is coming to retest it. If #INCHUSD retests the lower support and doesn't enter the descending triangle, the probability of the bearish pressure will increase.
💎The 50 EMA is acting as a strong dynamic resistance, reinforcing the bearish bias. Every attempt to reclaim higher levels has been rejected, and as long as we remain capped below the descending resistance, bulls are at a clear disadvantage.
💎A successful retest of the lower support trendline will significantly increase the probability of a breakdown. If this triangle finally breaks to the downside, we should be watching the $0.2116 support zone as the first key level to catch any temporary reaction.
💎But the real danger — and opportunity for patient traders — lies lower. If $0.2116 fails, the next strong demand zone sits at $0.1582, which could be the level where real buyers finally step back in. Until then, any bullish scenario remains invalid unless the price breaks and closes above the strong resistance at $0.3332.
Trade smart, Paradisers. This setup will reward only the disciplined.
MyCryptoParadise
iFeel the success🌴
1INCHUSDT - fear zone, return to the channel, growth potential1inch - is a decentralized exchange (DEX) aggregator that combines multiple DEXs into a single platform, aiming to provide users with the most efficient routes for swaps across all platforms.
📍 CoinMarketCap : #160
📍 Twitter(X) : 1.3M
The coin has already been listed on exchanges during the distribution phase of the cycle and was partially sold off in waves. Then, in line with the overall market, it declined to more reasonable accumulation prices, shaking out small investors and those who entered positions on positive news.
The price has been moving within a horizontal channel for a couple of years, and the channel’s percentage range reflects the coin’s liquidity. Currently, the coin is in a fear zone, at its lowest price levels. In moments like this, very few people have funds left to accumulate positions, as they’ve already been trapped by optimistic bloggers and a positive news background earlier.
Many were wiped out recently due to a breakdown and consolidation below the previous support of the inner channel, and now there's emptiness and fear below. What’s happening now is an attempt to return back into the inner channel. If this zone holds, the channel targets may be realized.
Resistance zones where the price may react are marked on the chart. Potential final downside wicks are also indicated. It’s important to allocate funds wisely for position building and use proper percentage distribution, according to your own experience!
______
📌 Not financial advice. Observing structure and recurring phases.
Operate within your strategy and with an awareness of risks.

1INCHUSDT Forming Falling Wedge1INCHUSDT is setting up for what could be a significant bullish reversal as it breaks out from a classic falling wedge pattern. This well-known technical setup typically signals a trend reversal with a strong probability of a sharp upside move once resistance is breached. Over recent sessions, 1INCH has demonstrated strong buying interest with an uptick in volume, indicating that investors and traders alike are beginning to take positions ahead of a possible rally.
The increase in trading volume is an encouraging sign that accumulation is underway. This means that both institutional players and retail investors see value at these levels and are positioning themselves for a potential 60% to 70% gain in the coming weeks. With key resistance levels getting cleared and the falling wedge breakout confirmed, momentum could build quickly, driving price action toward higher targets.
Sentiment surrounding 1INCH is also benefiting from its strong fundamentals as a leading decentralized exchange aggregator. The project’s ability to find the best token swap rates across multiple DEXs has kept it relevant in the DeFi space, attracting new users and liquidity. Combined with improving on-chain metrics and renewed interest in the DeFi sector as a whole, the setup looks increasingly favorable for bulls.
✅ Show your support by hitting the like button and
✅ Leaving a comment below! (What is You opinion about this Coin)
Your feedback and engagement keep me inspired to share more insightful market analysis with you!

2021 Resistance Broken: 1INCH Eyes Major Bullish PotentialThe 1INCH/USDT monthly chart provides a compelling glimpse into the long-term price action and potential future trajectory of the cryptocurrency. The chart captures key market dynamics, highlighting a prolonged downtrend and a recent breakout that could signal the beginning of a new bullish cycle.
The overall context suggests that 1INCH has experienced a significant long-term downtrend, marked by a descending white trendline originating from its peak price of 7.3345. This trendline underscores consistent selling pressure and a bearish market sentiment that persisted for an extended period. However, the broader picture also reflects the cyclical nature of markets, with an initial strong rally in early 2021, followed by a protracted consolidation phase, and now the possible emergence of a fresh upward trend.
A pivotal development is the recent breakout above the downward-sloping trendline. Such a breakout often indicates a shift in market momentum from bearish to bullish, signaling that the downward pressure may be easing. This breakout is further underscored by annotations on the chart suggesting that the price is “ready for re-test.” This refers to the likelihood of the price pulling back towards the broken trendline to confirm it as a new level of support before continuing its upward trajectory. Retests are a natural and critical component of breakout scenarios, offering traders an opportunity to validate the strength of the breakout.
The chart also highlights a projected target price of 7.9266, indicated by a green rectangle. This ambitious target represents a substantial increase from the current price of 0.4005, suggesting the potential for a significant rally if the bullish momentum holds. Additionally, key support levels are identified at 0.3286, 0.2600, and 0.2304, providing important reference points for risk management and trade planning.
From a trading perspective, the breakout sets the stage for a bullish outlook, with the re-test offering a potential entry point. Traders might wait for the price to dip towards the broken trendline or one of the identified support levels and observe whether these levels hold as support. Confirmation of support can come in various forms, such as the formation of a higher low or a strong green candle signaling buyer strength.
However, trading based on this analysis should include proper risk management. Setting a stop-loss near critical support levels can help mitigate potential losses if the breakout fails or market conditions reverse unexpectedly. Furthermore, traders should remain aware of the high volatility inherent in cryptocurrency markets and adjust their strategies accordingly.
It’s also essential to acknowledge that this analysis is based on a monthly timeframe, which means the trends and price movements are likely to unfold over an extended period, spanning weeks or months. While the technical setup appears promising, it’s important to incorporate fundamental factors such as news, project developments, and broader market sentiment to gain a more comprehensive view.
In conclusion, the 1INCH/USDT monthly chart reveals a promising bullish scenario with the potential for significant upside, provided the breakout holds and the market aligns with the technical projections. Observing the re-test and confirming the newly established support levels will be key steps in navigating this potential rally.
Disclaimer: This is not a financial advise. This analysis is purely for informational purposes and should not be considered as investment advice. Trading involves risk, and you should consult with a financial professional before making any decisions.

1INCHUSDT Forming Bullish Wave1INCHUSDT is showing signs of a promising bullish wave pattern that could deliver solid gains for traders who position themselves early. The 1INCH token, which powers the popular decentralized exchange aggregator 1inch Network, has seen a consistent uptick in trading activity and on-chain volume recently. This uptick in volume indicates that investors and whales are quietly accumulating positions, setting the stage for a possible breakout move. If this momentum continues, the price action could produce an impressive 60% to 70% upside from current levels.
The project’s fundamentals remain strong as the 1inch Network continues to expand its reach in the DeFi space, offering some of the best rates and routing for decentralized trades. This network effect, combined with increased protocol usage, provides additional fuel for a sustained uptrend. The bullish wave pattern developing on the chart suggests that the price could test key resistance levels soon, and a breakout above these levels may trigger a strong upward rally supported by healthy liquidity.
Technically, 1INCHUSDT has formed a clear accumulation zone with higher lows indicating growing buyer confidence. As traders look for altcoins with solid use cases and liquidity, 1INCH is positioning itself as a standout candidate. The alignment of strong technicals with a robust DeFi narrative makes this pair one to watch closely in the coming weeks. Smart investors will be paying attention to volume spikes and breakout confirmations to catch the wave early.
✅ Show your support by hitting the like button and
✅ Leaving a comment below! (What is You opinion about this Coin)
Your feedback and engagement keep me inspired to share more insightful market analysis with you!

TradeCityPro | 1INCH Tests Supply Zone After Strong Bounce👋 Welcome to TradeCity Pro!
In this analysis, I want to review the 1INCH coin for you. It’s one of the DeFi coins, with a market cap of $256 million, ranked 162 on CoinMarketCap.
⏳ 4-Hour Timeframe
As you can see in the 4-hour timeframe, this coin is sitting on a support floor at the 0.1668 zone and has formed a range box at this bottom.
🔔 There’s a key supply zone at the top of this range box, which I’ve marked as a range for you, and currently, the price is inside this zone.
📊 Given the significant buying volume that has entered this coin, the price has penetrated into this range and is testing it for the several-th time.
✨ If this range is broken, we can confirm the bullish reversal of this coin and open a long position. Volume has already given us confirmation, and if RSI enters the Overbuy area, that will be our momentum confirmation.
🔼 The next resistance levels for this coin—which we can consider as targets—are 0.2031 and 0.2207.
✔️ If the price gets rejected from this zone, it may move back down toward the 0.1668 floor. For a short position, we can enter if 0.1668 is broken.
📉 However, if we get confirmation of rejection from the zone, we can look for an early entry trigger in the lower timeframes.
📝 Final Thoughts
This analysis reflects our opinions and is not financial advice.
Share your thoughts in the comments, and don’t forget to share this analysis with your friends! ❤️

1INCH 1D. Showing Signs of Accumulation. 06/12/25BINANCE:1INCHUSDT There's growing media and social media attention around the 1INCH project, which could be a bullish sentiment trigger.
Currently, the price is trading within a descending channel and has recently bounced from the lower boundary, signaling a potential long entry or spot accumulation opportunity.
From current levels, I expect a clean 2x upside on spot. Personally, I think it's worth starting to scale in carefully on spot or futures.
However, keep in mind — even after a bounce, price could still dip slightly lower before any meaningful move up. A deeper correction remains a possibility, so always factor in risk.
📌 Key Takeaways:
• Long bias from current levels
• Potential 2x on spot
• Further dip possible — manage risk accordingly
DYOR. Stay sharp.

1INCHUSDT 1D Analysis 1INCH ~ 1D Analysis
#1INCH Buy gradually within this pattern with a short-term target of at least 10%++ and a long-term target of $0.63+

1INCH Inverse Head & Shoulders (1H)BINANCE:1INCHUSDT completed an Inverse Head & Shoulders pattern, clearly visible on the hourly timeframe.
Key Levels
• Left Shoulder: $0.223
• Head: $0.218
• Right Shoulder: $0.223
• Neckline: $0.232
• Measured Target: $0.245 (aligned with local high)
Status
Breakout has already occurred, activating the target.
Next Steps
It may be too late to chase, but a retest of the neckline as support (~$0.232) could offer a compelling long entry.
Invalidation Levels
• Early Invalidation: Break below $0.232
• Full Invalidation: Break below the right shoulder at $0.223

1INCH USDT Bull Pennant, BULLISHBINANCE:1INCHUSDT
1INCH USDT Bull Pennant, BULLISH
TARGETS are fib levels as shown in the chart

1INCH Rectangle Downside BreakoutLast week, BINANCE:1INCHUSDT fully confirmed a downside breakout from a multi-year rectangle.
If $0.20 isn't reclaimed soon, there is a good chance that the token will head to the $0.06 rectangle target.
Worth watching it, as a failed retest of $0.20 could offer a very good short opportunity, while a sustained daily close above it would invalidate the setup and possibly lead to a retest of $0.45 or even $0.70.
