1INCHUSDT: The Invisible Forces Driving Price Right Now - 1inch◳◱ Ever seen the Bollinger Band Breakout Super Trend on a chart? It's exciting to watch! With the price hovering around 0.2093, there's potential for a breakout above 0.2203 | 0.2433 | 0.2859. Support at 0.1777 | 0.1581 | 0.1155 provides confidence for bulls.
◰◲ General Information :
▣ Name: 1inch
▣ Rank: 199
▣ Exchanges: Binance, Kucoin, Huobipro, Gateio, Mexc, Hitbtc
▣ Category / Sector: Financial - Decentralized Exchanges
▣ Overview: The 1inch Network unites three separate decentralized protocols, aggregating liquidity from a variety of decentralized exchanges to facilitate cost-efficient transactions.
Its native token, the 1inch token (1INCH) serves two primary purposes: As a governance token granting voting rights towards the 1inch DAO and as a utility token, where it is used as a connector to achieve high-efficiency routing in the 1inch Liquidity Protocol. It will also be used in the tokenomics of all future protocols developed by the 1inch Network.
◰◲ Technical Metrics :
▣ Current Price: 0.2093 ₮
▣ 24H Volume: 3,767,156.011 ₮
▣ 24H Change: 3.358%
▣ Weekly Change: 4.06%%
▣ Monthly Change: -21.88%%
▣ Quarterly Change: -56.72%%
◲◰ Pivot Points :
▣ Resistance Level: 0.2203 | 0.2433 | 0.2859
▣ Support Level: 0.1777 | 0.1581 | 0.1155
◱◳ Indicator Recommendations :
▣ Oscillators: NEUTRAL
▣ Moving Averages: BUY
◰◲ Summary of Technical Indicators : BUY
◲◰ Sharpe Ratios :
▣ Last 30 Days: -3.94
▣ Last 90 Days: -4.16
▣ Last Year: -0.69
▣ Last 3 Years: -0.39
◲◰ Volatility Analysis :
▣ Last 30 Days: 0.79
▣ Last 90 Days: 0.78
▣ Last Year: 0.93
▣ Last 3 Years: 0.87
◳◰ Market Sentiment :
▣ News Sentiment: N/A
▣ Twitter Sentiment: 0.53 - Bullish
▣ Reddit Sentiment: 0.60 - Bullish
▣ In-depth BINANCE:1INCHUSDT analysis available at TradingView TA Page
▣ Your thoughts matter! What do you think of this analysis? Share your insights in the comments below. Your like, follow, and support are greatly valued and help sustain high-quality content.
◲ Disclaimer : Disclaimer
The content provided is for informational purposes only and does not constitute financial, investment, or trading advice. Always conduct your own research and consult a qualified professional before making any financial decisions. Use of the information is solely at your own risk.
▣ Explore the Power of Charting with TradingView
Unlock a wide range of financial analysis tools, data, and features to elevate your trading experience. Take a tour and see the possibilities. If you decide to upgrade your plan, you can receive up to $30 back. Discover more here - affiliate link -
1inch
TradeCityPro | INCH: Delving into a Leading DEX Project👋 Welcome to TradeCityPro!
In this analysis, I want to review the INCH coin for you. It's one of the DEX projects in crypto, active in the DeFi space, and considered one of the successful projects in this category.
📅 Weekly Timeframe
As you can see in the weekly timeframe, after its launch, the price began a downward trend and is currently in a consolidation box between $0.2098 and $0.6270.
⚡️ The bottom of this box is a very important support, arguably the only and last support for this coin. Conversely, the top of this box, as you can see, is a very strong supply zone. The price has approached this area several times with high momentum, but it has been rejected each time and returned to the bottom of the box.
🔍 Currently, as you observe, the price, after being rejected from this level, has moved downward and reached the bottom of the box, where it has been ranging for about three weeks. If this bottom breaks, the price could move lower and set a new all-time low (ATL), which would worsen the project's situation.
📈 However, if the price can rise from this area, finally moving upwards and breaking the supply zone, it could successfully start its bullish trend after several years.
🚀 The targets for the bullish trend are initially at $0.8438 and then at $2.0175. The ATH area is at $7.1331, which seems far from the current price and out of reach unless the market cap of 1inch significantly increases.
📅 Daily Timeframe
In the daily timeframe, as we observe, we can see more details about the last downward movement. As you see, after entering the correction phase, the price first corrected to $0.3638. However, after stabilizing below this area, the next downward leg started, and currently, the price has reached $0.25 and has formed a small box between $0.25 and $0.2756.
🔽 For short positions, we have a very suitable trigger at $0.25, where if this area breaks, the price could move down to its main support at $0.2226.
✅ On the other hand, if this box that the price has formed breaks upwards and the price can stabilize above $0.2756, forming a higher low and higher high, we could say it has risen from the bottom of the box and could move higher.
💥 Overall, the price is in a very large weekly box, and any spot purchases and positions taken within this box are highly risky. So, be sure to not engage in excessive risk with this coin and wait until the large weekly box is broken either upwards or downwards.
📝 Final Thoughts
This analysis reflects our opinions and is not financial advice.
Share your thoughts in the comments, and don’t forget to share this analysis with your friends! ❤️

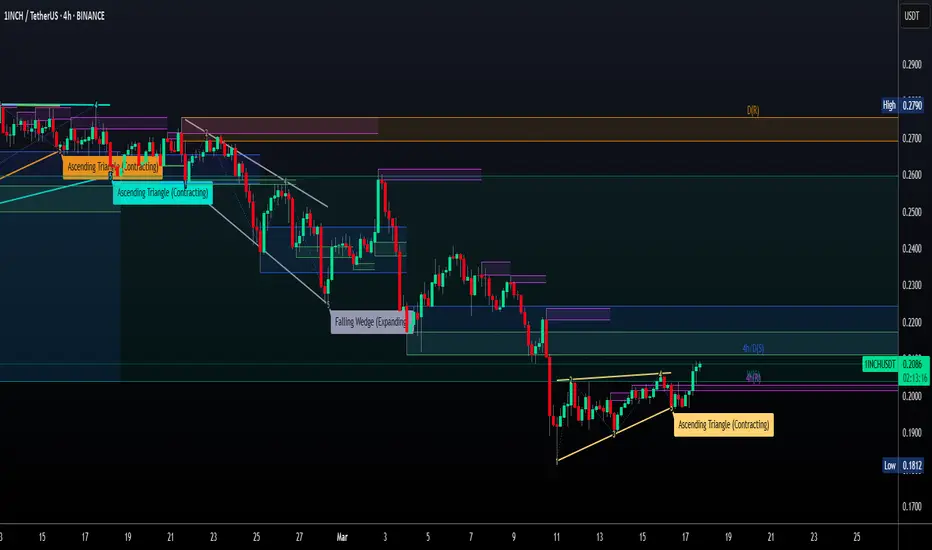
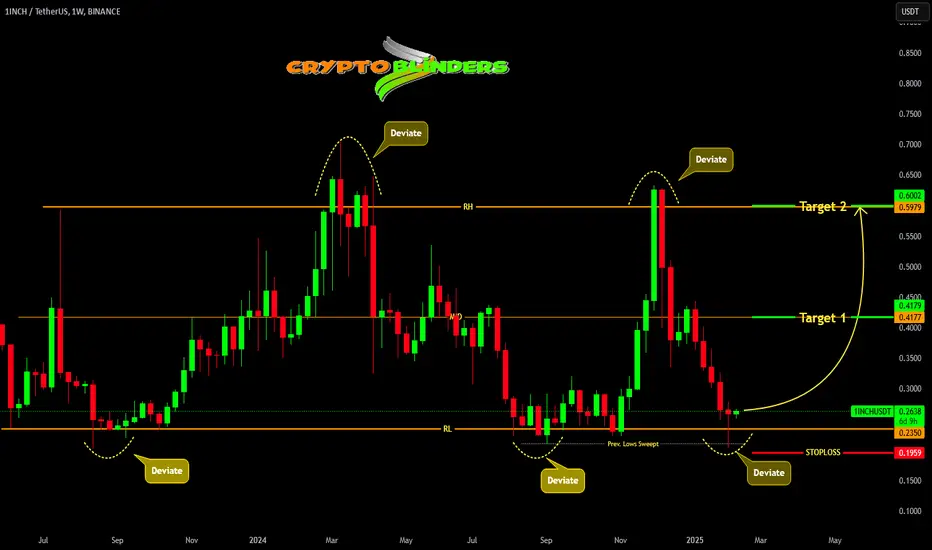
1INCH ABOUT TO MAKE A BIG MOVE !!!1inchusdt been trading in a range, had recently swept previous lows and deviated range low and reclaimed it. It signs a strength and we can expect targets of mid range and range high putting stops below recent low.
1inch review analysis: where to buy?hello friends
As you can see, this currency has grown well with the defeat of its suffering, now that it has entered a price correction, it is a good opportunity for us to buy in steps with capital and risk management.
We have specified goals for you.
*Trade safely with us*

1inch - Long Priority BINANCE:1INCHUSDT
✅Before we start to discuss, I would be glad if you share your opinion on this post's comment section and hit the like button if you enjoyed it.
Thank you.
Possible Targets and explanation idea
➡️We bounced from fundamental price value. Usually after that we follow to liquidity like magnet to "Exit line" by Take Profit indicator
➡️We probably will test with break out 1st resistance zone soon
➡️Already retested on D1 timeframe downtrend line since April
➡️Targets for November is 2nd resistance zone and test of global downtrend line
➡️Signal to Buy appeared on "Direction" indicator 20 September. No signal to sell or open short. Long priority
Hope you enjoyed the content I created, You can support with your likes and comments this idea so more people can watch!
✅Disclaimer: Please be aware of the risks involved in trading. This idea was made for educational purposes only not for financial Investment Purposes.
* Look at my ideas about interesting altcoins in the related section down below ↓
* For more ideas please hit "Like" and "Follow"!


1inch Network (1INCH)Comprehensive Analysis of 1INCH/USDT 🪙
Introduction
1INCH is the native token of the 1inch Network, a DEX aggregator designed to optimize trades in the DeFi space. This platform enables users to access the best rates across various decentralized exchanges. The 1INCH token serves multiple purposes, such as reducing transaction fees, offering discounts, and acting as a governance token.
🔍 Technical Analysis Breakdown
1. Long-Term Descending Channel
1INCH has broken out of its long-term descending channel and is currently retesting the channel boundary. This pullback is a positive sign for a potential bullish continuation, but further confirmation is needed.
2. Daily Support Zone (Red)
The $0.3377 - $0.3757 range is identified as a key daily support level.
If the price stabilizes within this zone and starts to rise, it could confirm the pullback and signal the beginning of an upward move toward higher resistance levels.
3. Weekly Resistance Zone (Green)
The $0.6276 - $0.7049 range represents a significant resistance in the weekly timeframe.
A breakout above this zone, accompanied by increased trading volume, could lead to a rally toward the blue target zone ($1.1819 - $1.450).
4. Support in Case of a Drop
If the red support zone fails to hold:
The price might re-enter the descending channel and move toward the weekly support zone ($0.2101 - $0.2338), marked in gray.
📌 Suggested Entry Points
1. Breakout-Based Entry:
Condition: Price breaks above the green resistance zone with increased trading volume and stabilizes above this range.
2. Pullback-Based Entry:
Red Zone ($0.3377 - $0.3757): Enter with a stop-loss below the red support zone.
Gray Zone ($0.2101 - $0.2338): Enter with a stop-loss below the gray support zone.
Note: The gray zone offers a higher risk-to-reward ratio but comes with greater risk.
📈 Entry Triggers and Confirmation Signals
RSI Support:
Price holding above the midline on higher timeframe RSI charts can confirm the start of an uptrend.
Increased Trading Volume:
Breakouts of key zones must be validated by significant volume increases.
Low-volume breakouts could indicate false signals (fakeouts).
⚠️ Key Risk Management Tips
Volume Monitoring:
Ensure volume spikes during breakouts to avoid falling for fakeouts.
Capital Management:
Given the sensitivity of this analysis, strictly adhere to proper capital management strategies and set stop-loss orders at the identified levels.
Patience and Confirmation:
Avoid impulsive entries. Wait for clear confirmation signals before committing to a trade.
✨ Final Conclusion
1INCH is at a critical juncture from a technical perspective:
The breakout from the descending channel and the pullback to the support zone indicate a positive setup for a bullish continuation.
Close monitoring of price behavior in the key zones (red and green) is essential, with confirmations such as rising trading volume and RSI support being mandatory for entry.
A successful breakout of the weekly resistance (green) could lead to targets in the blue zone ($1.1819 - $1.450).
However, if the red support zone fails to hold, a decline toward the gray support zone becomes a strong possibility.

Trading opportunity for 1INCHUSDTBased on technical factors there is a Buy position in :
📊 1INCHUSDT
🔵 Buy Now
🪫Stop loss 0.4170
🔋Target 0.4530
📏 R/R 2,2
💸RISK : 1%
We hope it is profitable for you ❤️
Please support our activity with your likes👍 and comments📝

Is #1INCH Ready For a Major Move or Not? Key Levels to Watch Yello, Paradisers! Is a decisive breakout brewing for #1INCH, or are we in for more sideways action? Let’s dive into the latest analysis of #1INCHNetwork:
💎After an extended period of consolidation, #1INCHUSDT is forming a clear Falling Wedge pattern, a structure often hinting at a potential bullish reversal. The price is currently trapped between Descending Resistance and Descending Support, coiling tighter with each move. The question is—will the bulls finally step up to break free?
💎To ignite a rally, #1INCHUSD must break above the $0.5049 resistance level, which has been a major obstacle. A decisive breakout here, backed by strong trading volume, could propel the price toward the next significant target in the $0.65-$0.70 resistance zone. Keep an eye out for momentum indicators like RSI and a volume spike to confirm this breakout.
💎On the flip side, the $0,38 support zone is critical where buyers have consistently stepped in. If the price closes below this level on the daily timeframe, the bulls will likely catch their next opportunity at the $0.312 strong demand level.
💎The true risk emerges if the $0.312 demand fails. A breakdown here would likely hand control back to the bears, leading to a deeper correction and squashing hopes for a short-term bullish recovery.
Stay focused, patient, and disciplined, Paradisers🥂
MyCryptoParadise
iFeel the success🌴

1INCH bullish scenario#1INCH price is 1000 % less than what it was in 2021 the market made the 1st wave for rising and also the 2nd wave now we are in the 3rd wave as i mentioned in last posts there should be a correction in the market so this coin can drop too and after that make a big rise !

1INCH roadmap (3D)It seems that 1INCH is completing a double correction.
If wave E forms as part of the terminal triangle, we can look for buy/long positions in the green zone.
The target could be the red box area.
Closing a daily candle below the invalidation level will invalidate this analysis.
For risk management, please don't forget stop loss and capital management
Comment if you have any questions
Thank You

#1INCH/USDT Ready to go higher#1INCH
The price is moving in a descending channel on the 1-hour frame and sticking to it well
We have a bounce from the lower limit of the descending channel, this support is at 0.3950
We have a downtrend on the RSI indicator that is about to be broken, which supports the rise
We have a trend to stabilize above the moving average 100
Entry price 0.5000
First target 0.5586
Second target 0.6014
Third target 0.6555

1INCH Mid-Term Bullish Confirmed1inch consolidated above 50EMA, successfully survived today's shakeout without dropping 50EMA. We are about to exit the accumulation channel that has lasted for over 924 days! My expectations are in the $5 area. Not a bad asset for those who haven't bought it yet!

1INCHUSDT: A Breakthrough Moment in the Market - 1inch◳◱ On the BINANCE:1INCHUSDT chart, the Bband Breakout pattern suggests an upcoming trend shift. Traders might observe resistance around 0.4803 | 0.5159 | 0.6119 and support near 0.3843 | 0.3239 | 0.2279. Entering trades at 0.5564 could be strategic, aiming for the next resistance level.
◰◲ General Information :
▣ Name: 1inch
▣ Rank: 162
▣ Exchanges: Binance, Kucoin, Huobipro, Gateio, Mexc, Hitbtc
▣ Category / Sector: Financial - Decentralized Exchanges
▣ Overview: The 1inch Network unites three separate decentralized protocols, aggregating liquidity from a variety of decentralized exchanges to facilitate cost-efficient transactions.
Its native token, the 1inch token (1INCH) serves two primary purposes: As a governance token granting voting rights towards the 1inch DAO and as a utility token, where it is used as a connector to achieve high-efficiency routing in the 1inch Liquidity Protocol. It will also be used in the tokenomics of all future protocols developed by the 1inch Network.
◰◲ Technical Metrics :
▣ Current Price: 0.5564 ₮
▣ 24H Volume: 23,006,005.395 ₮
▣ 24H Change: 4.429%
▣ Weekly Change: 24.47%%
▣ Monthly Change: 109.98%%
▣ Quarterly Change: 123.84%%
◲◰ Pivot Points :
▣ Resistance Level: 0.4803 | 0.5159 | 0.6119
▣ Support Level: 0.3843 | 0.3239 | 0.2279
◱◳ Indicator Recommendations :
▣ Oscillators: NEUTRAL
▣ Moving Averages: STRONG_BUY
◰◲ Summary of Technical Indicators : BUY
◲◰ Sharpe Ratios :
▣ Last 30 Days: 9.64
▣ Last 90 Days: 3.94
▣ Last Year: 0.70
▣ Last 3 Years: -0.25
◲◰ Volatility Analysis :
▣ Last 30 Days: 0.91
▣ Last 90 Days: 0.84
▣ Last Year: 0.91
▣ Last 3 Years: 0.85
◳◰ Market Sentiment :
▣ News Sentiment: N/A
▣ Twitter Sentiment: N/A
▣ Reddit Sentiment: N/A
▣ In-depth BINANCE:1INCHUSDT analysis available at TradingView TA Page
▣ Your thoughts matter! What do you think of this analysis? Share your insights in the comments below. Your like, follow, and support are greatly valued and help sustain high-quality content.
◲ Disclaimer : Disclaimer
The content provided is for informational purposes only and does not constitute financial, investment, or trading advice. Always conduct your own research and consult a qualified professional before making any financial decisions. Use of the information is solely at your own risk.
▣ Explore the Power of Charting with TradingView
Unlock a wide range of financial analysis tools, data, and features to elevate your trading experience. Take a tour and see the possibilities. If you decide to upgrade your plan, you can receive up to $30 back. Discover more here - affiliate link -

1inchusdtThe rotation in the chart is quite clear
In order to grow, it needs to break the resistance zone

1INCH/USDTBINANCE:1INCHUSDT
1INCH is your favorite coin, and it’s currently showing potential to hit resistance levels at **$0.61114** and **$0.6854** 🚀. If the price doesn’t hold these resistance levels, it could face a pullback, with support zones at **$0.500** and **$0.4333** 🛑. Here's a more detailed breakdown:
1. **Resistance Levels:**
- The **$0.61114** and **$0.6854** levels act as strong resistance zones, meaning the price may face difficulty moving above these levels. If 1INCH breaks through these levels, we could see further bullish momentum 🚀.
- These levels will be important for anyone looking to trade or anticipate price action—watch closely to see if it can hold above them.
2. **Support Levels:**
- If the price falls below the resistance and starts to decline, **$0.500** and **$0.4333** are key support zones where the price could find buying interest 🛑. These levels could act as a safety net, helping to prevent a larger drop.
- If the price holds at these support levels, there’s a chance for a bounce and upward movement, potentially setting up for a move toward the resistance levels again.
*Not financial advice* 💡📊

1inchTo reach the high lines, it should not miss the green lines. But it will have a good trend in the long run.

1INCH/USDTBINANCE:1INCHUSDT
🚨 **1Inch Coin Price Update** 🚨
- **Current Price**: **$0.4720** 💲
- The price is currently at a **support area**, suggesting it could either bounce from here or face further downside if it fails to hold this level. This support zone is crucial in determining whether the price will recover or break down.
- **If the price holds** at **$0.4720** and doesn’t drop below, the **next resistance levels** to watch for upward movement are:
- **$0.4735**: A nearby resistance level where price might face some selling pressure. It’s important to monitor for any breakouts. 📈
- **$0.5600**: If the price breaks **$0.4735**, the next resistance level is at **$0.5600**, which could lead to further upward momentum. 🚀
- **$0.61112**: This is another key resistance level, and if the price manages to break through **$0.5600**, **$0.61112** could be the next significant target.
- **If the price does not hold** at **$0.4720**, and falls below it, we need to keep an eye on the **support levels** for a potential reversal:
- **$0.3794**: This is an important support level. If the price drops below **$0.4720**, it might find support here.
- **$0.31543**: If the price continues to decline past **$0.3794**, **$0.31543** is the next critical support level to monitor. If broken, it could signal further downside movement.
🔔 **Important Note**: This is not financial advice. Always conduct your own research and consider your risk tolerance before making any trades! 📊

Trading opportunity for 1INCHUSDTBased on technical factors there is a Buy position in :
📊 1INCHUSDT
🔵 Buy Now
🪫Stop loss 0.4120
🔋Target 1 0.5300
🔋Target 2 0.6000
🔋Target 3 0.6900
💸RISK : 1%
We hope it is profitable for you ❤️
Please support our activity with your likes👍 and comments📝

Are Bulls Losing Steam, or Is a Major #1INCHUSDT Breakout?Yello Paradisers! Are we about to witness a massive bullish move on #1INCHUSDT, or will the bulls falter under pressure? Let’s dive into this analysis to find out!
💎#1INCHUSDT is currently holding its ground at the key demand level of $0.3750, showing early signs of bullish continuation. If this level remains intact, the potential for a strong rally toward the next resistance zone becomes increasingly likely. All eyes are on the $0.4105 level, where a decisive breakout could ignite a powerful upward move.
💎However, it’s important to remember that we’re not in full breakout mode just yet. For confirmation, we need a clear break above $0.4105, accompanied by strong engulfing candles signaling sustained buying momentum. Without these signals, any premature entries carry increased risk, so it’s crucial to stay cautious and avoid rushing into positions.
💎On the flip side, what if the bulls lose steam? If $0.3750 fails to hold, we’ll be watching for a potential bullish rebound from the lower support at $0.3507. But be warned, a break below $0.3482 would invalidate this bullish setup altogether, opening the door for a steep decline.
As always, patience pays in trading. Don’t let FOMO guide your decisions. Wait for clear confirmations before taking action. Discipline and strategy are the keys to long-term success.
MyCryptoParadise
iFeel the success🌴

#1INCH. ROCKET LAUNCH COMING SOON! 11/22/24A super interesting asset both locally and on a more global scale.
Descending trendline + accumulation structure. Exiting accumulation usually happens with an upward breakout + we’ve reached a strong support level, from which a bounce is to be expected. In any case, at the moment, this is an ideal price for spot buying. Added more to my spot position.
Targets:
Short-term: $0.6–$1
Mid-term: $3
Long-term (bull market): $10

1inch Network1inch Network is one of the popular decentralized exchange with several million users and needs no further introduction. Anyway, 1INCH chart is simple, first oscillation, then a downtrend move, and now price is breaking the downtrend line with strong momentum. Let's see how far up 1inch goes.

1INCH is ready to moon.#1INCH Army, here we go. 🚀
1INCHUSDT
1:5 Risk to Reward
As always, Stay Safe and DYOR.
#TheHopinionist
