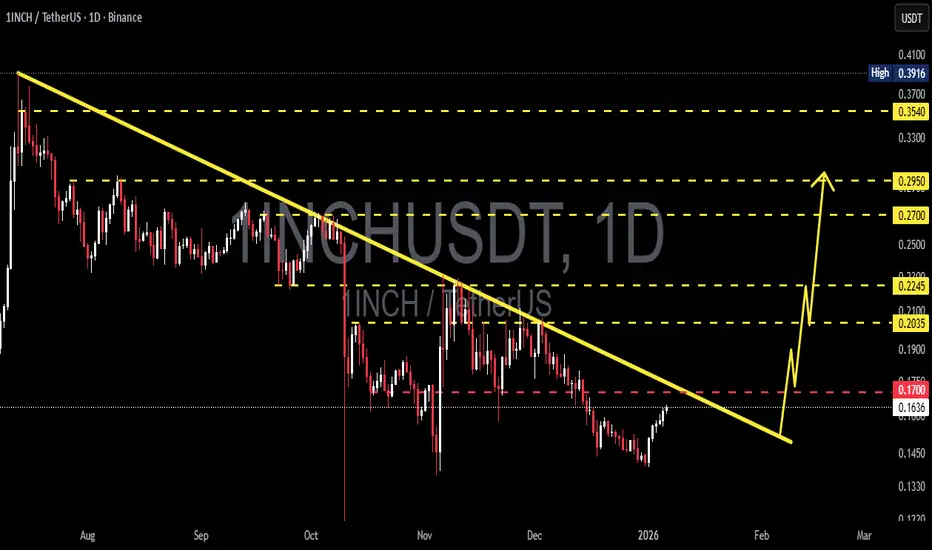
1INCH/USDT – Test Downtrend Resistance | Breakout or Rejection?1INCH/USDT remains in a medium to long-term downtrend, clearly characterized by a sequence of lower highs and lower lows since the previous peak. Price is currently experiencing a relief rally, moving upward toward a major descending trendline resistance that has historically capped bullish attempts.
This area represents a critical decision zone. Market participants are closely watching whether price will break the trendline or get rejected and continue the bearish structure.
---
Pattern Explanation
Descending Trendline (Bearish Market Structure)
The descending trendline has been respected multiple times, acting as a strong dynamic resistance.
Each previous touch of this trendline resulted in price rejection and continuation to the downside.
Price is now approaching the same trendline again, making this level technically significant.
Potential Bearish Continuation Structure
Overall structure still favors sellers unless a confirmed breakout occurs.
Failure to break above resistance may form a bearish continuation setup, leading to another impulsive drop.
---
Key Levels
Resistance Zones
0.1700 USDT – Minor resistance / reaction zone
0.2035 USDT – Key resistance & trendline breakout level
0.2245 USDT – Strong resistance / confirmation level
0.2700 – 0.2950 USDT – Upper supply zone
0.3540 USDT – Major resistance / previous range high
Support Zones
0.1635 USDT – Short-term support
0.1450 – 0.1330 USDT – Major demand zone
A breakdown below this zone would strengthen the bearish continuation scenario.
---
Bullish Scenario
Price breaks and closes above the descending trendline on the daily timeframe.
Strong confirmation occurs with a daily close above 0.2035 USDT.
This would invalidate the bearish structure and signal a potential trend reversal.
Bullish targets:
0.2245 USDT
0.2700 USDT
0.2950 USDT
Increasing volume during breakout would further support bullish momentum.
Bias: Trend reversal if breakout is confirmed.
---
Bearish Scenario
Price fails to break the trendline and shows rejection (bearish candle / long upper wick).
Rejection around 0.1700 – 0.2035 USDT confirms seller dominance.
Downside targets:
0.1635 USDT
0.1450 USDT
0.1330 USDT
A clean breakdown below support would confirm bearish continuation.
Bias: Bearish continuation if rejection occurs.
---
Conclusion
1INCH/USDT is currently trading at a major technical inflection point. The descending trendline acts as the key level determining the next major move.
Traders should wait for clear confirmation — either a breakout for bullish continuation or a rejection for bearish continuation.
This is a high-risk, high-impact zone, best traded with confirmation and proper risk management.
---
#1INCH #1INCHUSDT #CryptoAnalysis #TechnicalAnalysis #Altcoins #Downtrend #Trendline #SupportResistance #Breakout #Bearish #Bullish #PriceAction
1inchusdtanalysis
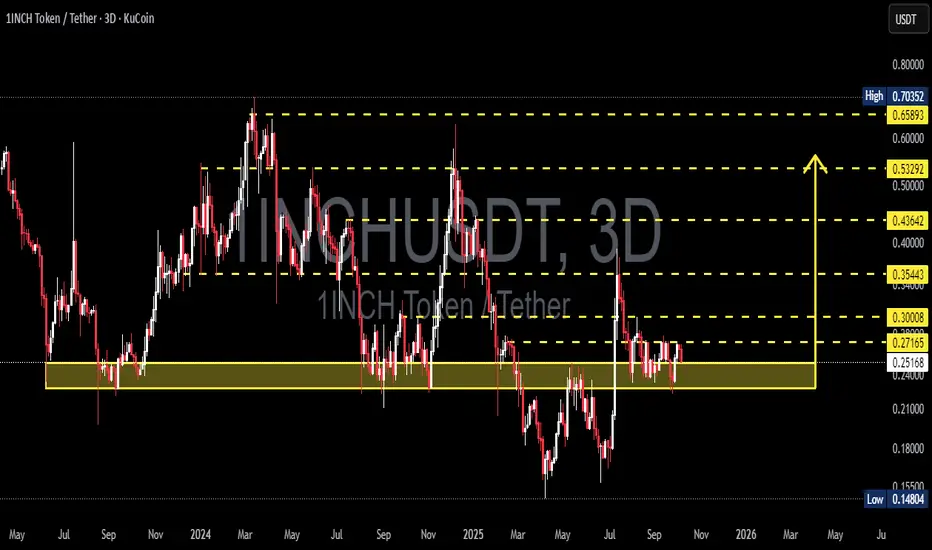
1INCH/USDT (3D) — at Demand Zone: Accumulation or Breakdown?Analysis:
The 3-day chart shows 1INCH consolidating tightly within the 0.23–0.25 demand zone, an area that has acted as a critical base since mid-2024.
Every touch of this zone has triggered a strong bullish reaction, proving it’s a key defense area for buyers. However, repeated retests also weaken its strength — making this retest a make-or-break moment for the mid-term trend.
Price is currently moving sideways with declining volatility, suggesting the market is in a final consolidation phase before a major directional move.
This zone will decide whether we see a strong reversal rally or a structural breakdown into new lows.
---
Key Technical Structure
Demand Zone (Major Support): 0.23 – 0.25
Nearest Resistance: 0.27 – 0.30
Higher Resistances: 0.354 → 0.436 → 0.533 → 0.659
Major Support Below: 0.148
---
Price Structure & Pattern
1INCH has been forming a broad horizontal range with multiple retests at 0.23–0.25, signaling potential base accumulation.
However, the macro structure still shows a series of lower highs, keeping the overall trend bearish-to-neutral until a confirmed breakout occurs.
Long downside wicks around 0.23 indicate liquidity sweeps — a common sign of institutional accumulation before a major move.
---
Bullish Scenario
Confirmation:
A strong 3D candle close above 0.30 — confirming breakout from the range.
Implication:
Marks the end of accumulation and the beginning of a potential mid-term reversal structure.
Upside Targets:
TP1 → 0.354 (mid-range top)
TP2 → 0.436 (major supply)
TP3 → 0.533 (trend reversal confirmation)
TP4 → 0.659–0.703 (extended target)
Entry Strategy:
Conservative: wait for a 3D close above 0.30 and enter on retest.
Aggressive: enter near 0.23–0.25 upon bullish rejection, with a tight stop below 0.23.
Stop Loss: below 0.23 (breakdown invalidates setup).
---
Bearish Scenario
Confirmation:
A 3D close below 0.23 confirms structural breakdown from the base range.
Implication:
Signals a shift from accumulation to redistribution, resuming the broader downtrend.
Downside Targets:
0.20 → 0.18 (intermediate)
0.15 (major psychological and technical support)
Strategy:
Look for bearish rejection around 0.27–0.30 for short setups, or enter breakdown continuation trades below 0.23 with confirmation.
---
Conclusion
The 0.23–0.25 zone stands as the final equilibrium point between buyers and sellers — the golden demand zone that will dictate 1INCH’s next major trend.
A confirmed breakout above 0.30 could trigger a strong reversal toward 0.53–0.70, while a breakdown below 0.23 opens the door for a drop toward 0.15.
The market is silent — and this calmness often precedes a massive move.
---
#1INCH #CryptoAnalysis #TechnicalAnalysis #Altcoin #Breakout #PriceAction #CryptoTrading #SwingTrade #SupportResistance #MarketStructure #ReversalZone #CryptoMarket #ChartAnalysis
1INCH/USDT — Golden Pocket Re-Test at a Critical Zone!Currently, 1INCH/USDT is trading around $0.2568, sitting right at the Golden Pocket (Fibonacci 0.5–0.618) between $0.242–$0.263. This area is highly significant because:
It has acted as a historical demand zone since 2023, often serving as both support and resistance.
It will determine whether buyers can defend this level for a recovery, or if a breakdown towards lower support levels will occur.
---
🔎 Market Structure & Pattern
Macro trend: Since topping near $0.70, the market has been printing lower highs & lower lows → bearish bias still present.
Golden Pocket zone: Represents a potential accumulation area, where smart money often positions for a reversal.
Recent price action: A sharp retracement occurred after rejection at higher levels, and price is now testing this crucial zone again.
---
🚀 Bullish Scenario
If 1INCH manages to hold above $0.242 and closes the 3D candle strong:
1. This will confirm a successful retest at the golden pocket → strong signal for a rebound.
2. Further confirmation if price breaks & closes above $0.300 with volume.
🎯 Upside Targets:
TP1: $0.300 (+16.9%)
TP2: $0.354 (+38%)
TP3: $0.436 (+70%)
Extended targets if momentum continues: $0.532 – $0.658
📌 Bullish Invalidation: 3D close below $0.242 → bullish thesis fails.
---
🐻 Bearish Scenario
If the golden pocket fails to hold and price closes below $0.242:
1. Support flips to resistance → opening the path for deeper downside.
2. Price may revisit $0.19, with extended risk toward the swing low at $0.148.
🎯 Downside Targets:
TP1: $0.190 (–26%)
TP2: $0.148 (–42%)
📌 Bearish Invalidation: A strong reclaim and close above $0.300 would cancel the bearish outlook.
---
📌 Conclusion & Strategy
$0.242–$0.263 = Decision Zone.
Bullish case: A rebound from this zone could fuel a swing rally toward $0.354 – $0.436.
Bearish case: A breakdown below $0.242 targets $0.19 – $0.148.
Watch for 3D candle close & volume confirmation → critical for the next major move.
👉 Aggressive traders may position within the golden pocket with tight risk management, while conservative traders should wait for 3D confirmation before committing.
#1INCH #1INCHUSDT #CryptoAnalysis #Altcoins #SwingTrade #Fibonacci #SupportResistance #DeFi

1INCHUSDT 1D Analysis 1INCH ~ 1D Analysis
#1INCH Buy gradually within this pattern with a short-term target of at least 10%++ and a long-term target of $0.63+

1INCHUSDT 2D Analysis 1INCH ~ 2D Analysis
#1INCH Buy on retest of this support block with short term target of at least 15%+ from here.

1INCHUSDT 1W1INCH ~ 1W Analysis
#1INCH In Time Frame 1W re -test this support block. Buy from here if you still have a Conviction on this coin with a minimum target of 20%+

1INCHUSDT 1W1INCH Update ~ 1W
#1INCH Still in a bullish trend. and successfully retested this support line,. For now the price is moving within the Golden ratio. Buy in stages here with a minimum target of 20%+

1INCHUSDT1INCH ~ 1W
#1INCH reached its current lowest price. if you have Conviction on this AltCoin,. This price is very attractive to start buying.

1INCHUSDT1INCH ~ 1W
#1INCH reached its current lowest price. if you have Conviction on this AltCoin,. This price is very attractive to start buying.

1INCHUSDT 1W1INCH ~ 1W
#1INCH Forms H&S Pattern at time 1W
This is H&S Bull. Buy in increments from here with a short term target of at least 20%+.

1INCHUSD 1W1INCH ~ 1W
#1INCH Forming a HnS Pattern on a 1W Time Frame.
Make purchases gradually within this pattern, with a target of at least 20%+

1INCHUSDT Elliott Waves AnalysisHello friends.
Please support my work by clicking the LIKE button👍(If you liked). Also i will appreciate for ur activity. Thank you!
Everything on the chart. (update)
Nothing has changed from my last analysis, everything according plan, minimal target zone ~0.9, and maybe 1.2 will depends on structure.
Entry: market and lower (im in pos from 0.49)
Targets: 0.7 - 0.85 and maybe 1.2(not sure about last)
after first target reached move ur stop to breakeven
Stop: ~0.4 (depending of ur risk). ALWAYS follow ur RM .
RR: 1 to 7
risk is justified
Good luck everyone!
Follow me on TRADINGView, if you don't want to miss my next analysis or signals.
It's not financial advice.
Dont Forget, always make your own research before to trade my ideas!
Open to any questions and suggestions

1inch is ready for bullish move 1inchusdt
Breakout has been confirmed, we have to wait for retest. If we see buying activity on retest, then we will take entry.
Also Chart is looking Ultra Bullish on Higher Time-frame, 100-200% Bullish Move can be expected in coming weeks.
Remember: We only give ldea's from our
experience and knowledge, it does not
mean that it will be 100% correct, the
market is always unpredictable, anything
can happen anytime.
Always trade with your own research and
knowledge. If You Are Satisfied With Our
Work Then Join.

1INCHUSDT Elliott Waves AnalysisHello friends.
Please support my work by clicking the LIKE button👍(If you liked). Also i will appreciate for ur activity. Thank you!
Everything on the chart.
On last trade on 1inch was gotten first target and rest of pos closed in breakeven,
we can reenter coz right now structure looks like a correction, flat(3-3-5).
Entry: market and lower
Targets: 0.7 - 0.85 and maybe 1.2(not sure about last)
after first target reached move ur stop to breakeven
Stop: ~0.36 (depending of ur risk). ALWAYS follow ur RM .
RR: 1 to 6
risk is justified
Good luck everyone!
Follow me on TRADINGView, if you don't want to miss my next analysis or signals.
It's not financial advice.
Dont Forget, always make your own research before to trade my ideas!
Open to any questions and suggestions

1INCHUSDT Elliott Waves AnalysisHello friends.
Please support my work by clicking the LIKE button👍(If you liked). Also i will appreciate for ur activity. Thank you!
Everything on the chart. (update)
Nothing has changed, everything is relevant.
First target was already reached on 0.65, stop in breakeven(0.46)
Next targets 0.9 and ~1.2
Good luck everyone!
Follow me on TRADINGView, if you don't want to miss my next analysis or signals.
It's not financial advice.
Dont Forget, always make your own research before to trade my ideas!
Open to any questions and suggestions.

1INCHUSDT Elliott Waves AnalysisHello friends.
Please support my work by clicking the LIKE button👍(If you liked). Also i will appreciate for ur activity. Thank you!
Everything on the chart.
Entry: market and lower (0.53-0.4)
Targets: 0.65 - 0.75 and zone 0.9-1$
after first target reached move ur stop to breakeven
Stop: (depending of ur risk). ALWAYS follow ur RM .
risk is justified
Good luck everyone!
Follow me on TRADINGView, if you don't want to miss my next analysis or signals.
It's not financial advice.
Dont Forget, always make your own research before to trade my ideas!
Open to any questions and suggestions.

1INCHUSDT Analysis (LOCAL VISION)Hello friends.
Please support my work by clicking the LIKE button👍(If you liked). Also i will appreciate for ur activity. Thank you!
Everything on the chart.
Entry: market and lower
Target: 2.2 - 2.5 - 2.7
after first target reached move ur stop to breakeven
Stop: 1.65 (depending of ur risk). ALWAYS follow ur RM .
Risk/Reward: 1 to 3
risk is justified
Good luck everyone!
Follow me on TRADINGView, if you don't want to miss my next analysis or signals.
It's not financial advice.
Dont Forget, always make your own research before to trade my ideas!
Open to any questions and suggestions.
