The Christmas Silver Finally Breaks FreeFor decades, Silver has celebrated the holidays the same way 🎄
Strong rallies.
Rising excitement.
And a familiar ceiling.
🎄 Christmas 1980
Silver climbed like a Christmas tree, fast, vertical, and emotional.
The star was reached at the $50 level.
And just like that, the lights went out ✨
The market peaked and collapsed back into its long-term range.
🎄 Christmas 2010
Different era. Same story.
Once again, Silver rallied into Christmas, lit up the chart, and tested the same $50 level.
The tree was tall.
The star was bright.
But price could not hold above it.
⭐️Why the Star at $50 Always Mattered
That star was not decorative .
It was structural .
The $50 level represented:
• decades of trapped supply
• historical excess from prior cycles
• a psychological round number the market respected
Every Christmas rally stopped at the same place.
Until this one❗️
💫Christmas 2025: The Star Breaks Free
This time, Silver did not just touch the star.
It broke above it and held.
The Christmas tree is no longer capped.
The star has turned into a shooting star ☄️
That is what price discovery looks like.
When a market escapes a level it failed to conquer for decades, it stops trading inside a box and starts trading into open space.
🌌Discovery Mode: The Sky Is the Limit
With the ceiling gone, Silver enters a new phase.
The blue zone ahead is not a prediction .
It is a projection .
A natural expansion toward the next psychological magnet near 100.
Not because history says so.
But because history no longer applies the same way once a multi-decade barrier breaks.
Above the star, there is only sky.
💡The Takeaway
Silver spent decades decorating the same tree.
This Christmas, it finally stepped outside the room 🎄➡️🌌
And once a market reaches open skies,
it does not ask for permission.
It explores .
🧐So here’s the real question:
Where do you see Silver next Christmas?🎄
And where do you think it will be ten Christmases from now?
⚠️ Disclaimer: This is not financial advice. Always do your own research and manage risk properly.
📚 Stick to your trading plan regarding entries, risk, and management.
Good luck! 🍀
All Strategies Are Good; If Managed Properly!
~ Richard Nasr
2025

2025 Scoreboard: Year’s Top Winners and Biggest LosersIn 2025, money flowed to safety and profits (metals, stocks) 🚀 and away from high risk (altcoins, most crypto) 📉.
Scoreboard: who won 2025? 📊
- 🥈 Silver: +160%
- 🥇 Gold: +65%
- 🧱 Copper: +43%
- 💻 Nasdaq: +20%
- 📈 S&P 500: +16%
- 🧬 Russell 2000: +13%
- ₿ Bitcoin: −6%
- Ξ Ethereum: −12%
- 🪙 Altcoins: −42%
So: metals and stocks = strong green ✅, crypto = mostly red ❌, especially altcoins.
Why metals pumped so hard 🪙🚀
- People wanted safety, not lottery tickets.
When there is fear about inflation, wars, or central banks, investors rush into gold and silver as “real” money that existed for centuries.
- Metals have real‑world demand.
Silver and copper are needed for solar, EVs, electronics etc., so there is constant buying from industry, not just traders.
Result: a huge wall of money moved into metals, pushing them up far more than Bitcoin.
Why stocks did well 📈💼
- Big Tech keeps making real profits.
AI, cloud, chips and software companies are printing earnings, so investors feel comfortable paying higher prices for their shares.
- Easy to access, easy to trust.
Anyone can buy an S&P 500 ETF in their pension account; rules are clear, liquidity is huge. That means constant passive inflows, even when crypto looks scary.
So stocks became the “default” risk trade, while crypto was left aside.
Why BTC and ETH only dipped a bit
- They are the “blue chips” of crypto.
When crypto is out of favor, funds usually sell altcoins first and keep more BTC and ETH, because they are the most liquid and most trusted.
- Still seen as long‑term bets.
Even in a bad year, many investors believe Bitcoin and Ethereum can recover, so they don’t panic‑dump as hard as they do with small caps.
That is why BTC −6% and ETH −12% look “ok” compared with altcoins −42%.
Why altcoins were destroyed 🧨🪙
- Highest risk, so they get sold first.
When people de‑risk, the order is usually: sell altcoins ➝ then BTC/ETH ➝ maybe later reduce stocks. Altcoins sit at the very end of the risk curve.
- Bad tokenomics + unlocks.
Many altcoins still release new supply to VCs, teams, or farmers. In a weak market, those extra tokens just crush price.
- Old narratives, no real users.
A lot of 2021 themes (random L1s, dead metaverse projects, copy‑paste DeFi) lost momentum. With little real usage, there were more sellers than buyers all year.
End result: altcoins became the worst‑performing major asset class of 2025.
The simple lesson for traders 🧠
- In “fear” years, money runs to real assets and profitable companies (metals, strong stocks) 🛡️.
- In those phases, crypto – especially alts – behaves like leverage on risk and gets hit the hardest 💣.
So for the next cycle, think in levels of risk:
cash → metals → big stocks → BTC/ETH → altcoins.
When the macro mood turns defensive again, rotate up this ladder instead of holding the riskiest coins and hoping.

Investment Logic: Why Gold Leads This Market CycleInvestment Logic Explained: Metals as the Preferred Asset in This Cycle
The performance gap shown in the table is not accidental. It reflects a clear capital rotation driven by macroeconomic realities in 2025. While equities and Bitcoin struggled to generate real returns, precious metals led by gold emerged as the dominant beneficiaries of this cycle. This shift is rooted in monetary policy, geopolitical risk, and the market’s renewed focus on capital preservation rather than speculation.
Gold: The Core Beneficiary of the 2025 Macro Environment
Gold’s +67.3% appreciation this year is a direct response to persistent global uncertainty and a structural shift in monetary expectations. Central banks maintained a cautious stance as inflation remained sticky, while real yields compressed amid expectations of policy easing into 2026. In this environment, gold regained its role as the primary store of value offering protection against currency debasement, sovereign risk, and declining confidence in fiat systems.
Importantly, gold’s rise was not driven by hype or leverage. It was supported by sustained institutional demand, central bank accumulation, and a steady increase in long-term holdings. This is the hallmark of a healthy, macro driven trend rather than a speculative rally.
Silver and Platinum: Beta Plays on the Same Thesis
Silver and platinum significantly outperformed gold, but their gains should be viewed as extensions of the same macro logic. As confidence in hard assets strengthened, capital flowed into metals with tighter supply dynamics and industrial demand exposure. These moves typically follow gold’s lead in the later stages of a precious metals cycle amplifying returns but also volatility.
For professional traders, gold remains the anchor. Silver and platinum offer upside asymmetry, but gold defines the directional bias of the entire metals complex.
Why Equities and Bitcoin Lagged
The S&P’s modest +17.7% gain underscores a year dominated by valuation compression rather than expansion. Elevated rates, earnings uncertainty, and geopolitical risk limited upside. Bitcoin’s −9.3% decline further highlights the difference between speculative assets and defensive capital. As liquidity tightened and risk appetite normalized, capital favored assets with intrinsic value and macro credibility areas where gold excels and Bitcoin currently does not.
Professional Takeaway: This Is a Capital Preservation Cycle
This cycle is not about chasing exponential upside. It is about protecting purchasing power, managing risk, and aligning with macro flows. Gold sits at the center of this framework. Its performance reflects disciplined capital allocation by institutions, not retail enthusiasm. Until global monetary stability is restored and real yields turn decisively positive, gold is likely to remain a preferred asset.
For traders, the message is clear: follow structure, follow liquidity, and respect macro regimes. In 2025, gold was not just a trade it was the benchmark for intelligent capital positioning.

BTCUSDT – 4H Chart Update. BTCUSDT – 4H Chart Update.
Falling channel breakout confirmed
Short-term bullish while holding above channel & MA Ichimoku: Price pushing into/above cloud → momentum improving
Support: 87,800 – 88,200
Major Support: 84,600
Resistance / Target: 93,500 – 94,000 zone
As long as BTC holds above 88k, upside continuation is likely toward the 94k supply zone. Any pullback above support can be a healthy retest.
⚠️ Break below 87.5k may delay bullish move. Manage risk.

(jasmy) JASMY "historical purchase lines"One more Jasmy post for the internet of trading view before the end of the year becomes final. Did I already post this image? This is quite sad to see there was no stability in the price of Jasmy this year. Not a single dollar withheld from the gobs of money that poured into Jasmy during the past year; Oh well.
These lines represent prices of Jasmy when I have made buys.
Sells in blue, Buys in Orange.
I never made any money from Jasmy, I never sold the bulk of my investment and only watched as the price fell to where it is now. Or I should say, I stopped watching seeing how there was no reversal in price after the price began to fall.

folks (FOLKS)This kraken listed cryptocurrency is performing well since being added to tradable tokens.
Folks is built on Algorand for DeFi.

BTC - Bulls Watching the Channel Support!📈Bitcoin remains overall bullish, trading cleanly inside its rising channel. Each dip toward the lower bound has acted as a strong springboard for the next impulsive move, showing clear demand from buyers.
⚔️As BTC approaches the lower trendline of the channel and the green demand zone, we will be looking for trend-following longs. This confluence area has held multiple times and continues to act as a key decision point for market structure.
🏹As long as BTC remains above this zone , the bullish scenario remains intact, and another push toward higher highs becomes the most likely outcome. Only a break below the demand zone would weaken the bullish outlook.
Now it’s all about the retest… will the bulls defend structure once again? 🤔
⚠️ Disclaimer: This is not financial advice. Always do your own research and manage risk properly.
📚 Stick to your trading plan regarding entries, risk, and management.
Good luck! 🍀
All Strategies Are Good; If Managed Properly!
~Richard Nasr

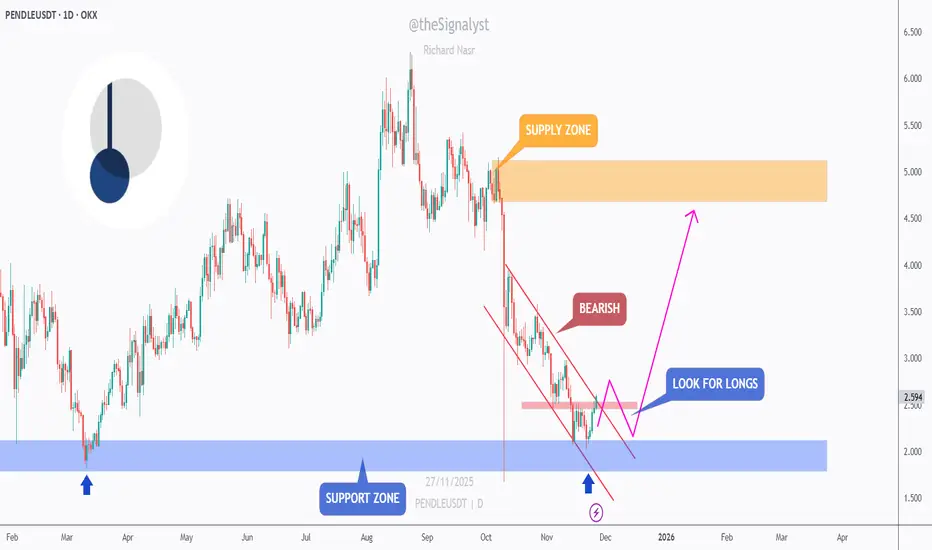
PENDLE - From Support to Setup… Bulls on Standby!📉PENDLE has been bearish for weeks, sliding inside a clean falling channel. But price is now reacting from a major support zone, the same area that initiated previous strong rallies earlier this year.
⚔️As long as this blue support zone holds, we will be looking for long setups, expecting a corrective move toward the upper bound of the falling channel. The first confirmation from the bulls will come after a break above the pink structure zone - the last lower high inside the correction.
Once that level is reclaimed, momentum could shift upward, opening the way for a larger move toward the supply zone around 5.00.
For now, PENDLE is positioned at a potential turning point… will the support zone spark the next bullish correction? 🤔
⚠️ Disclaimer: This is not financial advice. Always do your own research and manage risk properly.
📚 Stick to your trading plan regarding entries, risk, and management.
Good luck! 🍀
All Strategies Are Good; If Managed Properly!
~Richard Nasr
BTC 1D: watching 64–73k box for Nov 25–26 FED weekBearish channel intact unless 80k is reclaimed. Map, not signal.
Key idea: the bearish channel guides price into 64–73k. If we drift there by Nov 25–26, FED could trigger the next major move.
Not advice: I act only if price respects the box and vol/volume confirm. Until then this is a roadmap, not a signal.
Which side of 64–73k breaks first?

BTC & USDT.D - Who Follows Who?The eternal question in crypto, does Bitcoin lead USDT.D, or does USDT.D dictate Bitcoin’s moves?
At the moment, both charts are approaching critical inflection points.
CRYPTOCAP:BTC is retesting the $90,000 support, while CRYPTOCAP:USDT.D is nearing the 6.4% resistance.
As long as BTC holds above $90K and/or USDT.D remains capped below 6.4%, the bulls can still take over, paving the way for another impulsive rally across the crypto market.
But if these levels break… we may be in for a deeper correction before the next leg up.
So, who will make the first move? 🧩
⚠️ Disclaimer: This is not financial advice. Always do your own research and manage risk properly.
📊All Strategies Are Good; If Managed Properly!
~Richard Nasr

NOW OR NEVER - The Bulls’ Final Stand?⚔️The crypto market is standing at a make-or-break moment , and the next few weeks could define how this cycle ends.
CRYPTOCAP:BTC is testing the $90,000 support, a level that has acted as a major pivot point throughout this bullish channel.
CRYPTOCAP:USDT.D is hovering just below the 6.4% resistance, a threshold that has historically marked market reversals.
Meanwhile, CRYPTOCAP:XRP is clinging to its $1.9 support, holding the line for altcoin sentiment.
🏹If Bitcoin holds above $90K, USDT.D remains capped under 6.4%, and XRP stays strong above $1.9, the bulls could regain full control and ignite the next major impulse across the entire crypto market.
But if these levels fail… the tide could turn fast.
It’s truly NOW OR NEVER for the bulls. ⏳🔥
⚠️ Disclaimer: This is not financial advice. Always do your own research and manage risk properly.
📊All Strategies Are Good; If Managed Properly!
~Richard Nasr

ZK - Short-Term Setup, Long-Term Vision!📈 ZK has recently shown strong momentum but is now entering a short-term correction phase after facing resistance around the blue zone.
In the immediate term, I’ll be looking for short-term long opportunities near the red structure zone, which aligns with a strong support area and potential buyer interest.
🏹From a broader perspective, the real bullish confirmation will come once price breaks and holds above the blue resistance zone. That’s where long-term buyers are expected to step in, paving the way for a sustained bullish trend.
⚔️For now, short-term traders can play the bounce, while long-term investors should keep an eye on that breakout for a possible trend shift.
⚠️ Disclaimer: This is not financial advice. Always do your own research and manage risk properly.
📊All Strategies Are Good; If Managed Properly!
~Richard Nasr

ZEC - Roadmap to $500!💪Zcash has been on fire lately, outperforming over 90% of altcoins in the market. After months of accumulation, the bulls have finally taken control, driving ZEC into a strong impulsive rally that shows no signs of exhaustion yet.
📈 From a technical perspective , ZEC is trading within a well-defined rising channel, maintaining a clean bullish structure of higher highs and higher lows. The recent breakout above the previous all-time high around $372 confirms strong bullish momentum.
🏹As long as the channel’s lower boundary continues to act as dynamic support, the next logical target for the bulls sits around the $500 round number, which aligns with the upper boundary of the channel, a major confluence zone.
In the short term, a minor pullback toward the $370–$400 region wouldn’t be surprising and could offer new long opportunities before the next bullish leg kicks in.
⚠️ Disclaimer: This is not financial advice. Always do your own research and manage risk properly.
All Strategies Are Good; If Managed Properly!
~Richard Nasr

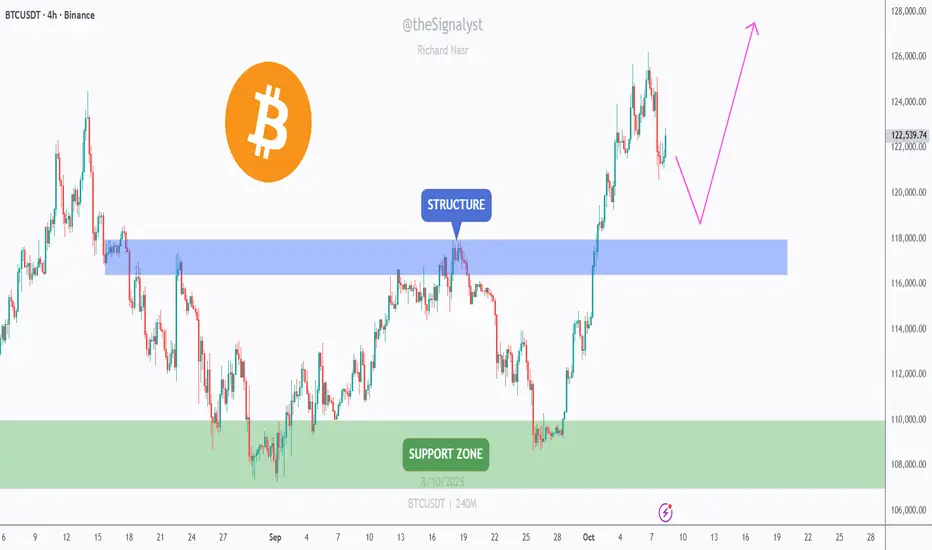
BTC - Bouncing From the Sweet Spot?⚔️Bitcoin is currently sitting at a high-confluence zone , where the daily support perfectly aligns with the lower bound of the ascending wedge. This intersection makes it a prime area to look for potential bullish reactions.
🏹As long as this support holds, I’ll be looking for long opportunities, expecting BTC to push higher within the wedge structure.
The first target for this bullish move lies around the upper bound of the wedge, which conveniently lines up with the supply zone near $122,000, a key resistance to watch.
📉If the support fails, the structure could shift, but for now, bulls still have the technical edge.
⚠️ Disclaimer: This is not financial advice. Always do your own research and manage risk properly.
📊All Strategies Are Good; If Managed Properly!
~Richard Nasr

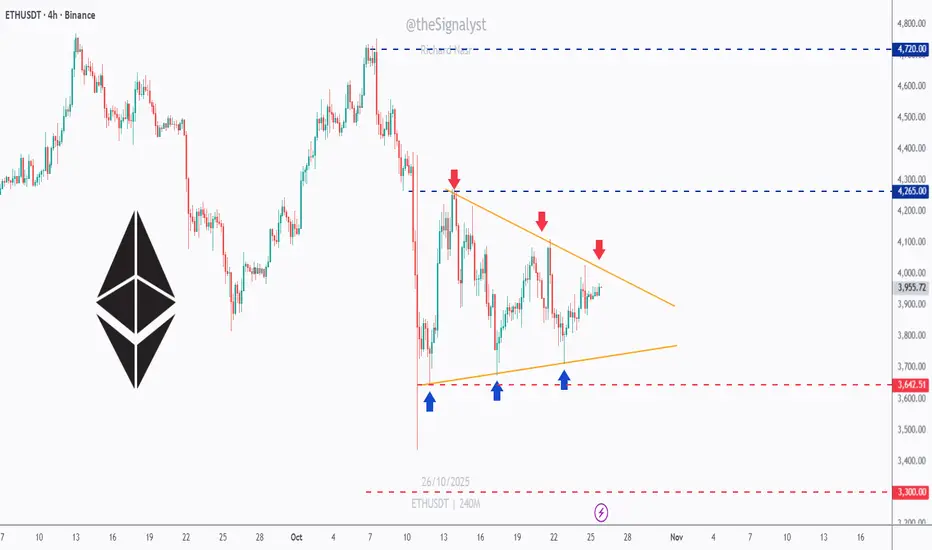
ETH - The Symmetrical Triangle of the Month!Ethereum has spent most of October coiling inside what can only be called the symmetrical triangle of the month => a textbook compression of volatility where both bulls and bears are building pressure for the next decisive move.
📦Price is trapped between the $4,265 resistance and $3,640 support, with multiple clear reactions from both boundaries. Each time ETH bounces off the lower orange trendline, buyers step in aggressively… but every push higher has been capped by lower highs, a perfect battle of strength versus patience.
The breakout from this formation will likely dictate ETH’s next major swing.
- A break above $4,265 could ignite a rally toward $4,720 and beyond.
- A break below $3,640, however, would expose $3,300, a strong historical demand zone.
⚔️ Until one side wins , it’s all about staying patient, waiting for confirmation, and letting the structure do the talking. The tighter this triangle gets — the bigger the breakout tends to be.
⚠️ Disclaimer: This is not financial advice. Always do your own research and manage risk properly.
📚All Strategies Are Good; If Managed Properly!
~Richard Nasr
NEAR - Patience at the Pivot, Power at the Bounce!📦NEAR has been stuck within a big range for months. After failing at the mid-range, price is grinding lower, and I’d prefer one more liquidity sweep into the blue support zone to reset late longs and load smart risk.
⚔️If buyers defend 2.00 and we then reclaim 2.20 → 2.30 (H4 close back above the pink structure), I’ll look for trend-following longs toward 2.70, then 3.10–3.40 (major resistance).
Plan:
🏹Wait for the dip into support, hunt for a wick + strong close/reclaim, and let the squeeze do the heavy lifting back into the range highs.
📚All Strategies Are Good; If Managed Properly!
~Richard Nasr

Palladium - The Calm Before the Next Surge!🏹Palladium has been on a strong bullish run , riding within a clean rising channel. After a sharp impulse, price is now cooling off — and this pullback might just be the calm before the next surge.
⚔️The metal is approaching a major intersection zone where the rising trendline meets a strong demand and structure area, a confluence that has previously sparked powerful rallies. As long as this intersection holds, I’ll be watching for bullish confirmations to join the trend.
A healthy correction into this zone could set the stage for the next impulsive wave, with potential upside targets around $1,550 and even $1,700 if momentum kicks in.
In short, Palladium remains overall bullish, and this upcoming retest could be the perfect reload zone before the next big move north.
📊All Strategies Are Good; If Managed Properly!
~Richard Nasr

BTC - History Doesn’t Repeat, But It Rhymes!Bitcoin has always been a market of patterns, and when you zoom out, the weekly chart tells a familiar story.
🏹 Each major bull cycle follows a similar rhythm : a strong rally, a sharp correction, a fakeout below support, and then another impulsive leg higher.
We’ve seen this movie before. In 2023, BTC broke its structure briefly before continuing its climb. Again in 2024, the market dipped below the trendline, shaking out late buyers, only to bounce and push to new highs. Now, in 2025, we’re testing that same rising trendline once again, showing another possible “fakeout before takeoff” scenario.
🔄If history continues to rhyme, this pullback could mark the final correction before BTC resumes its journey toward the upper boundary of the rising channel - possibly into the 150K–160K zone over the next phase.
But if this time is different and BTC fails to reclaim the trendline, we could witness a longer consolidation phase before the next major impulse.
The key remains the same: watch the weekly close around the trendline. Each time BTC dipped below and reclaimed it, the next move was explosive.
History might not repeat perfectly - but it tends to rhyme beautifully.
📊All Strategies Are Good; If Managed Properly!
~Richard Nasr

BTC - Decision Time at the Flip Zone!BTC is retesting a daily flip zone (former resistance turned support). This band has been the market’s pivot for most of the year and is the line in the sand for trend intent.
📈Bullish case (preferred): As long as the daily holds above the flip zone (~105k–108k) and prints a bullish reaction, I’ll look for longs. Upside magnets sit near 118k first, then 125k if momentum extends.
📉Bearish case (alternative): A clean daily close back below the flip zone turns it into supply and exposes 100k–98k, with room for a deeper correction if follow-through expands.
All Strategies Are Good; If Managed Properly!
~Richard Nasr

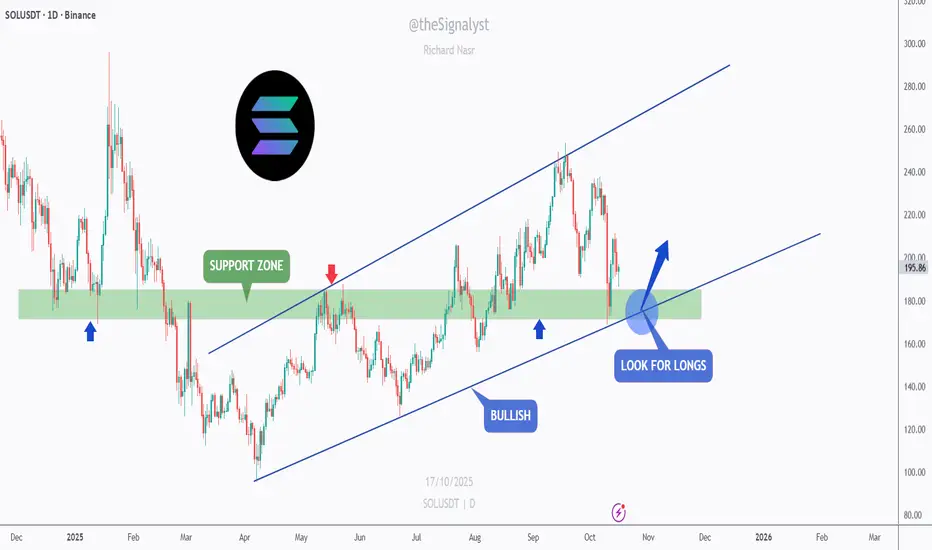
SOL - Buying the Retest Like a Sniper!SOL remains overall bullish , trading within a clean ascending channel and currently retesting the support zone that has acted as both resistance and support in the past.
This zone also aligns perfectly with the lower blue trendline, creating a strong area of confluence.
As long as this intersection holds, SOL is likely to rebound from here. I’ll be looking for bullish rejections or reversal patterns around the current zone to enter long positions, aiming for the next resistance levels near $230 and $260.
However, if the price breaks below the support zone, we could see a deeper correction before buyers regain control.
⚠️ Disclaimer: This is not financial advice. Always do your own research and manage risk properly.
📚 Stick to your trading plan regarding entries, risk, and management.
Good luck! 🍀
All Strategies Are Good; If Managed Properly!
~Richard Nasr
BTC – Bounce Off Daily Support, Eyes on Supply!Bitcoin has bounced from the daily support area (the broad green zone around $110K–$112K), reclaiming the intraday breakdown zone near $114K and turning it into support on lower timeframes.
As long as price holds above $112K–$113K, the short-term bias remains constructive and I am looking for continuation toward $118K, followed by the $121K–$122K supply zone highlighted on the chart.
The bulls will remain in control as long as the $107,500 mark holds as support.
⚠️ Disclaimer: This is not financial advice. Do your own research and manage risk.
All Strategies Are Good; If Managed Properly!
~Richard Nasr.

BITCOIN BULLISH MOMENTUM CONTINUATION? 125K Still possible?BTC/USDT 1H – Breakout Setup
Cup & Handle forming right under FVG zone, showing early bullish intent.
Recent tariff crash created the swing low and possible reaccumulation zone.
POC: 121K — strong magnet if price breaks higher.
Key Levels:
🔹 115K → Breakout confirmation level
🔹 120K → Mid FVG / Resistance
🔹 121K → POC target
🔹 125K → Next liquidity zone
🔹 110K / 105K / 100K → Downside supports
Bullish case:
Close above 115K = breakout → target 121K–125K (FVG fill + liquidity grab).
Bearish case:
Fail to hold 115K → drop to 110K → 105K → 100K possible.
Summary:
Cup & Handle under FVG + tariff crash low = potential bullish reversal zone.
Watch 115K — that’s the key trigger for direction.

BTC – Eyeing a Retest of the $118K Structure!CRYPTOCAP:BTC broke above the $117K–$119K structure (blue zone) with strong momentum.
I’m now watching for a pullback to this area to form a higher low and resume the uptrend.
As long as price holds above $117K–$119K, I’ll look for trend-following longs toward $125K–$128K, then the $130K handle.
If the blue zone fails, the next support sits at $106K–$110K (green zone), where bulls may regroup.
⚠️ Disclaimer: This is not financial advice. Always do your own research and manage risk properly.
📚 Stick to your trading plan regarding entries, risk, and management.
Good luck! 🍀
All Strategies Are Good; If Managed Properly!
~Richard Nasr