BTC – Between Structure and Supply!BTC has been trading inside a clean ascending channel 📈, respecting both support and resistance.
After breaking above the $113,000 structure zone, price pushed higher but is now approaching a potential retest area.
🟠 Structure zone ($113K – $114K): Could act as support on a pullback.
🟢 Channel support: Aligns perfectly with structure for confluence.
🔵 Supply zone ($122K – $124K): Next major resistance where sellers may step in.
As long as BTC holds above structure, bulls 🐂 remain in control, with the next upside target sitting around the supply zone.
Patience ⏳ is key — waiting for a clean retest could set up the next continuation trade.
⚠️ Disclaimer: This is not financial advice. Always do your own research and manage risk properly.
📚 Stick to your trading plan regarding entry, risk, and management.
Good luck!
All Strategies Are Good; If Managed Properly!
~Richard Nasr
2025

NEAR’s Biggest Move of 2025 Incoming?NEAR has been consolidating for months, carving out a textbook accumulation phase within the broader descending channel. Each previous cycle bottom (marked in red) has acted as a launchpad, and price is once again aligning with the cycle rhythm.
As long as the $2.5 – $2.7 demand zone holds, NEAR remains well-positioned for a potential breakout. A clean push above the short-term descending structure could ignite the impulse leg toward the $5.5 – $6.5 zone, where the next projected cycle top lies.
📌 Key Takeaways:
Structure: Price is respecting the descending channel with repetitive cycle bottoms and tops.
Accumulation: Sideways action suggests smart money is loading up.
Impulse Potential: Breakout could trigger a strong rally into the next resistance zone.
Invalid Level: A daily close back below $2.5 would put the bullish scenario on hold.
Patience is key here ⏳—waiting for confirmation above structure ensures we catch the move, not the noise.
⚠️ Disclaimer: This is not financial advice. Always do your own research and manage risk properly.
📚 Always follow your trading plan regarding entry, risk management, and trade management.
Good luck!
All Strategies Are Good; If Managed Properly!
~Richard Nasr

ETH/USD Analysis –Potential Pullback Before the Next Bullish Leg📈 ETH/USD Analysis – Potential Pullback Before the Next Bullish Leg
Ethereum is currently trading at $4,622 after an impressive rally. The price has reached a key resistance zone (~$4,700), where a short-term correction could occur.
Key insights:
EMA ribbons show a strong bullish trend – all moving averages are aligned upward and acting as dynamic support.
Fibonacci levels indicate the nearest major support around $4,000 (blue horizontal line).
Scenario: a possible retracement toward the ~$4,000 area, followed by a bounce targeting $5,250 and beyond.
Conclusion:
In the short term, we might see a healthy pullback, but the overall market structure remains strongly bullish. Strategically, watching the reaction at the $4,000 support zone could offer a good buying opportunity.

BTC - The Head and Shoulders of the Year?Bitcoin is shaping one of the most powerful reversal patterns traders could ask for: the inverse head and shoulders. After holding the ascending channel’s lower bound and bouncing from the key structure zone, BTC is signaling that bulls may soon take over.
Here’s what stands out on the chart:
🟢 Bullish Channel: Price continues to respect the rising channel, maintaining its long-term bullish outlook.
🛡️ Structure Zone: The $110,000 – $113,000 region is acting as a crucial pivot, flipping from support to resistance.
🔄 Inverse Head and Shoulders: A textbook reversal setup is forming, with the neckline aligning perfectly with structure.
🚀 Bullish Breakout: A confirmed break above this neckline could trigger the next major impulse move, putting BTC back on track toward higher channel targets.
Bulls need a clean daily close above the neckline for full confirmation — until then, the setup is in play but not yet validated.
📌 Will this become the pattern of the year that propels Bitcoin to new highs?
This is for educational purposes only, not financial advice. Always manage your risk before entering any trade.
📚 Stick to your trading plan regarding entries, risk management, and trade execution.
Good luck!
All Strategies Are Good; If Managed Properly!
~Richard Nasr

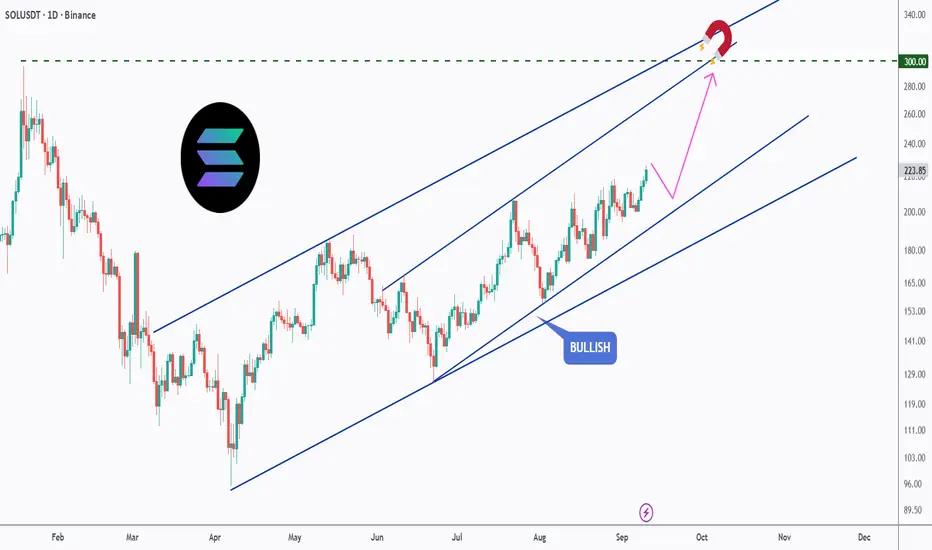
SOL’s Magnetic Path to $300!Solana has been steadily climbing inside a clean bullish channel, and the momentum is showing no signs of slowing down. The price action continues to respect higher highs and higher lows, keeping the bullish structure intact.
🟢 Bullish Channel: SOL is trading neatly within an ascending channel, confirming the trend’s strength.
🎯 Key Target: The $300 level acts as a magnet — a psychological resistance aligning with the channel’s upper boundary.
🔄 Healthy Pullbacks: Any short-term dips within the channel are being absorbed quickly, signaling strong buyer interest.
🚀 Upside Outlook: As long as SOL holds within the channel, the path of least resistance remains to the upside, with $300 as the next major milestone.
📌 Eyes remain on whether Solana can reach the $300 mark before the year’s end.
This is for educational purposes only, not financial advice. Always manage risk properly before trading.
📚 Stick to your trading plan regarding entries, risk management, and trade execution.
Good luck!
All Strategies Are Good; If Managed Properly!
~Richard Nasr
Bitcoin Cycles: History Repeating Itself?Bitcoin has always moved in cycles — a strong impulsive rally 📈 (1), followed by a healthy correction 🔻 (2), then a breakout above the previous high 🔓 (3).
Looking at the chart, the current price action is following this same rhythm once again. After the last correction, BTC bounced strongly, retested previous highs, and is now consolidating before its next potential move.
If this pattern continues to repeat, the next leg could take Bitcoin toward the $140,000 target 🎯 — aligning perfectly with the upper bound of the long-term channel.
👉 The past doesn’t guarantee the future, but BTC’s structure suggests the market might just be writing the same story again.
💬 What’s your bias here? Are you bullish or waiting for a deeper pullback?
📚 Always follow your trading plan regarding entry, risk management, and trade management.
Good luck!
All Strategies Are Good; If Managed Properly!
~Richard Nasr

BTC – Bulls Guarding the Key Zone!Bitcoin is retesting a major support zone 🛡️ that overlaps with the previous ATH breakout level.
This area has been acting as a strong demand zone, keeping the overall structure bullish despite recent corrections.
As long as this zone holds, we will keep looking for long opportunities 📈, with the next wave of momentum likely pushing BTC higher. If the bulls manage to reclaim the minor resistance ahead, we could see them fully take over and drive price back into an upward rally.
For now, this zone remains a crucial pivot — watch closely for bullish confirmation signals.
⚠️ Disclaimer: This is not financial advice. Always do your own research and manage risk properly.
📚 Stick to your trading plan regarding entries, risk management, and trade execution.
Good luck!
All Strategies Are Good; If Managed Properly!
~Richard Nasr

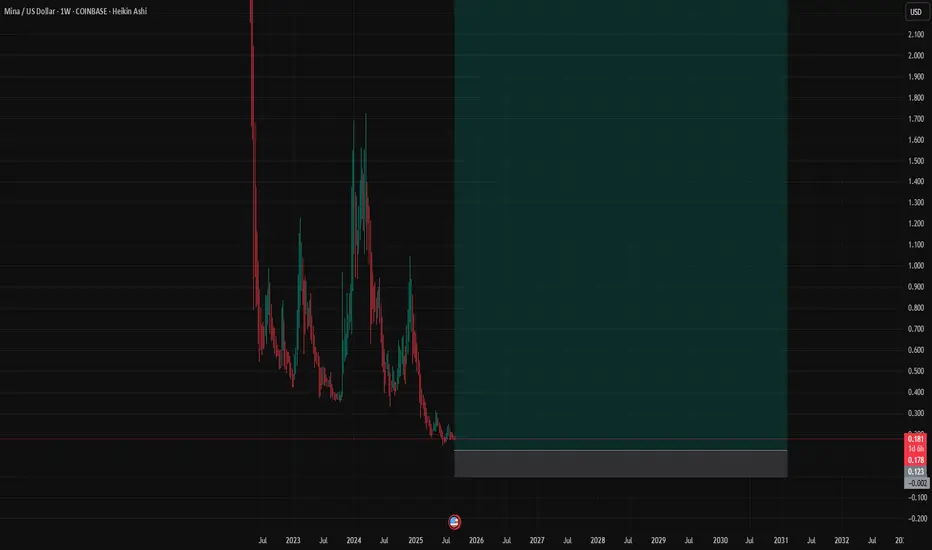
Mina Protocol - Game Changer?I'm not going to talk about that too much and I don't like to paint on chart.
this is something can be game changer in your wallet
(BTC) bitcoin "years - boxes - overlap"Essentially, the boxes in the chart gives and easy way to see Bitcoin between years correlated by using colored boxes. Using boxes I overlapped each year based on the following year's performance, working backwards. There are two boxes for each year in different colors and only touching the highest point of each year to see the difference overlapped between years and amount of gains or losses with the price of Bitcoin chart. I do not have a bias towards Bitstamp it is the chart with the longest view of BTC at the time of adding BTC to my watchlist some years ago.

(BTC) bitcoin "balancing act"Lines drawn based on indications in an attempt to foresee the direction of bitcoin. Day chart. Yellow Lines are aligned with variable average patterns. Orange lines are more concretely focused on consistent timeframe measurements. The trading psychology right now is not at its peak. Array pressure on the price is high where May 2025 was the last time BTC was at a low array buying pressure. Similarly, Bollinger Band phase is positive with the last negative being around April to May 2025. Bear power is in control right now. Selling pressure chop chai confirms the bear power indicator. Directional momentum does appear to be being taken over by selling also indicated is the strong average gauge to confirm the strength of selling. MA quad gives an indication the price is losing with the losing line in control over the top of the winning line. Triple descending pyramids appeared last week with the last time multiples of those type appeared happened around the start of February 2025. MACD lines have crossed 0 moving in a downward direction.
The balance of the imaginary weighted scale appears to be shifting to the right as in falling until the balance is level. The price of BTC often follows no logical path or makes any sense. This image is not entirely made up and relies on indicators which are unpublished that I drew over to show what is stated in the post.

TOTAL - total cap crypto "this looks bad," Not saying I've done trivial work in effort to determine the end of an Elliott wave phase peak; so, the chart looks like an Elliott wave does it not? The previously major halving did not have a similar chart where an Elliott wave 1,2,3,4,5 happened. This time it does look like that. Is it possible to have 6,7 phase inclusive to the chart albeit from the idea that Elliott wave means nothing to the new community of virtual currency digital money defi tropes meme derivative foreplay variable online meta landscape of the future? If I was betting on history repeating itself and the looks of the chart here for all cryptocurrency I would say this is not good looking for me, a guy who has made literally no money on cryptocurrency since the last halving despite trying so many times. The world is against me, the trends are fake, the people in society are all brainwashed by propaganda war machine rhetoric political asylums and the minority reports of mainstream majority peoples. Why now? Why not? I'm not looking forward to losing more money then I already have. I haven't made money. Online news doesn't help. Content creators don't help. My family does not help. These indicators which I feel I have a strong understanding of, do not help. Cryptocurrency is too volatile and unpredictable in ways that prevents mathematical decision making becoming profitable. The major players that control the phases of time are established based on the backs of working class people, and savings. We created a monster(s). Now those monsters are eating cryptocurrency for lunch. Cryptocurrency ≠ main course.

(SHIB) shiba inu "array -> YTDs" fib-no-chiShiba Inu through the years based on concurrent array measures that act as a pseudo fibonacci kind of doodle. Nothing else to say. The price is not necessary to analyze so much as look at the picture and look at it. The price of Shiba Inu is still so very low, so low. Not enough three zeroes after the decimal.
Could the logo image of Shiba Inu ever become a different background color? Is the company locked in on always using red as the background color for Shiba Inu?

(SHIB) shiba inu "boxes" yearlyWhat's the deal with shiba inu? There is so much talk about it, yet the chart looks less than the comparison to what XRP looks like, for instance. XRP has a huge following, but so does Shiba Inu. Shiba Inu even has haters due to so many people talking about the revelation that Shiba Inu will win in the end. This year, Shiba Inu did not do much of anything unless you count all that has gone on with the website and the company. As for the chart graphs pictures, the look is one that feels like there could be a predictable end to the year brewing. Or is there?

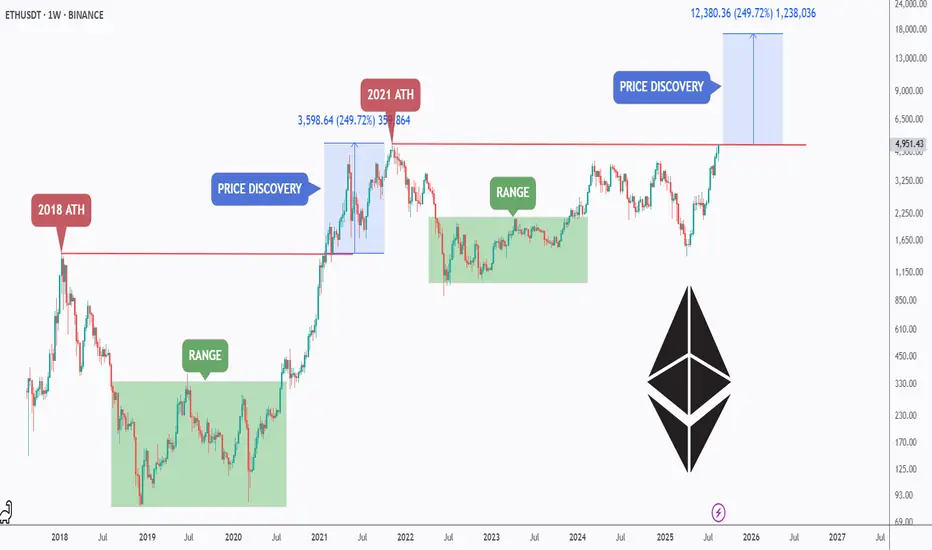
ETH – History Doesn’t Repeat, but It Often Rhymes!Ethereum has officially broken out above its previous ATH structure, entering a new price discovery phase.
📅 In 2018, ETH peaked, then spent years consolidating in a broad range before launching into the 2021 bull cycle.
Once the 2018 ATH was broken, ETH rallied nearly +250% in discovery mode, printing its 2021 ATH.
🏹After another extended range, ETH is now repeating history: breaking out again with room for another price discovery rally.
⏱️If ETH mirrors the last cycle’s percentage gain, the next optimistic target sits around $17,000–$18,000, aligning with a potential +250% leg from current breakout levels. 🚀
Cycles may not repeat perfectly, but they often rhyme — and Ethereum’s structure suggests we could be on the verge of another explosive move.
What do you think — can ETH surprise the market again this cycle? 👀🔥
📚 Always follow your trading plan regarding entry, risk management, and trade management.
Good luck!
All Strategies Are Good; If Managed Properly!
~Richard Nasr
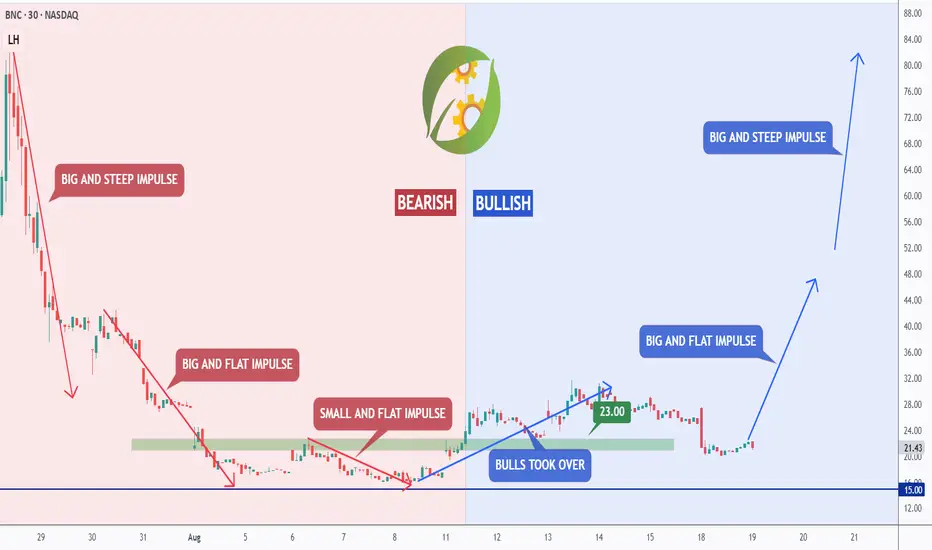
BNC - Shift in Momentum in Action!In our last update, we pointed out how BNC was holding its ground at the $12–$15 support zone. Now, we’re seeing that shift in momentum play out in real time; with the bears losing steam and the bulls taking over.
📊 Technical Update
The chart shows it clearly:
- In the bearish phase, every downward impulse got weaker — from big and steep to small and flat. Selling pressure was fading.
- Bulls stepped in at the $15 demand zone, flipping the structure bullish.
- Since then, we’ve seen a big and flat bullish impulse , hinting at healthy accumulation before the next leg.
🔎If momentum holds:
- First target: $50 => a structural resistance and psychological barrier.
- Second target: $82 => the top of the projected markup, filling a major price gap.
As long as $23 holds, and especially $15, the bullish case remains strong.
💡 Bigger Picture
This isn’t just a chart story — it’s backed by fundamentals. BNC is the first U.S.-listed company making BNB its core treasury asset , giving investors rare one-click exposure to a coin most can’t buy directly.
With over $500M already in BNB and a clear first-mover advantage, the mix of a strong macro narrative and a clear bullish shift makes this a setup worth watching closely.
📌 Previous BNC analysis is attached for context.
➡️ As always, speak with your financial advisor and do your own research before making any investment decisions.
📚 Always follow your trading plan => including entry, risk management, and trade execution.
Good luck!
All Strategies Are Good, If Managed Properly.
~ Richard Nasr
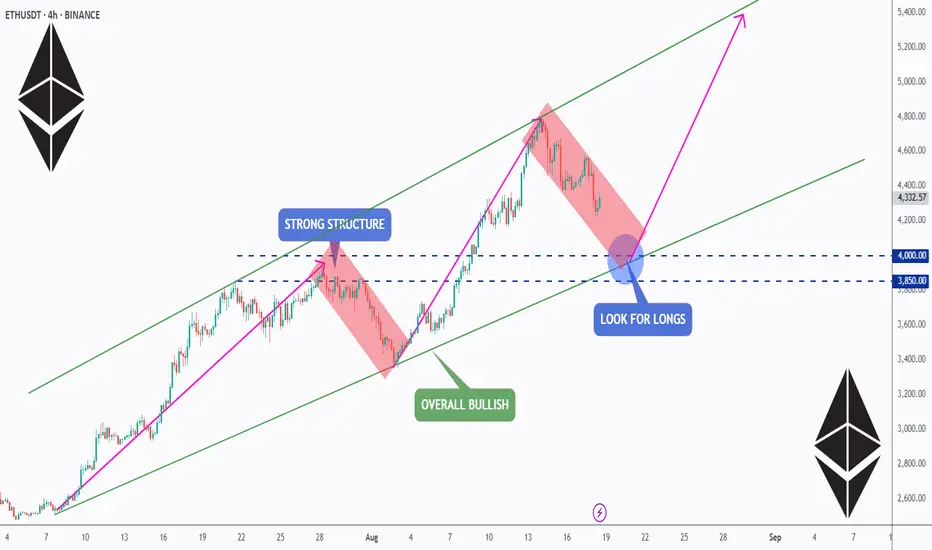
ETH Setup: Retest, Reload & Rally?ETH is pulling back after a strong run , but the bigger picture stays bullish. 📈
The $3,850–$4,000 zone is key — a solid structure + channel support. 🔑
If buyers step in here, we could see the next leg toward $5K and beyond. 🚀
Watching closely… time to retest, reload, and ride the rally? 👀
📚 Always follow your trading plan regarding entry, risk management, and trade management.
Good luck!
All Strategies Are Good; If Managed Properly!
~Richard Nasr
ETH - Eyes on a New All-Time High?ETHUSDT has been on fire lately, following a textbook bullish structure of Impulse → Fakeout → Impulse.
After breaking above the previous range in July, ETH confirmed strength with a sharp impulse move, only to shake out weak hands via a fakeout retest before pushing higher again. 📈
Currently, ETH is in the midst of another impulsive leg, with the next major target sitting at the ATH around $4,876.
📊 Key Notes:
- Fakeouts have served as liquidity grabs before strong rallies 🏹
- Current momentum favors the bulls 🐂
- As long as price holds above the last breakout zone (~$4,050–$4,150), the path of least resistance remains up.
🎯 Next Stop: ATH and beyond if bullish pressure sustains.
📚 Always follow your trading plan regarding entry, risk management, and trade management.
Good luck!
All Strategies Are Good; If Managed Properly!
~Richard Nasr

NVIDIA BITCOIN OVERLAPAnd so it appears NVIDIA is working to develop Bitcoin mining leading to a combination of both products winning this year. Nvidia continues to astonish in value and capital.

XRP - Wait for It!Hello TradingView Family / Fellow Traders. This is Richard, also known as theSignalyst.
📈XRP has been overall bullish trading within the rising wedge pattern marked in blue, and it is currently retesting the lower bound of the wedge.
Moreover, it is retesting a strong demand zone marked in orange.
🏹 The highlighted blue circle is a strong area to look for buy setups as it is the intersection of the orange demand zone and lower blue trendline acting as a non-horizontal support.
📚 As per my trading style:
As #XRP retests the blue circle zone, I will be looking for bullish reversal setups (like a double bottom pattern, trendline break , and so on...)
📚 Always follow your trading plan regarding entry, risk management, and trade management.
Good luck!
All Strategies Are Good; If Managed Properly!
~Richard Nasr

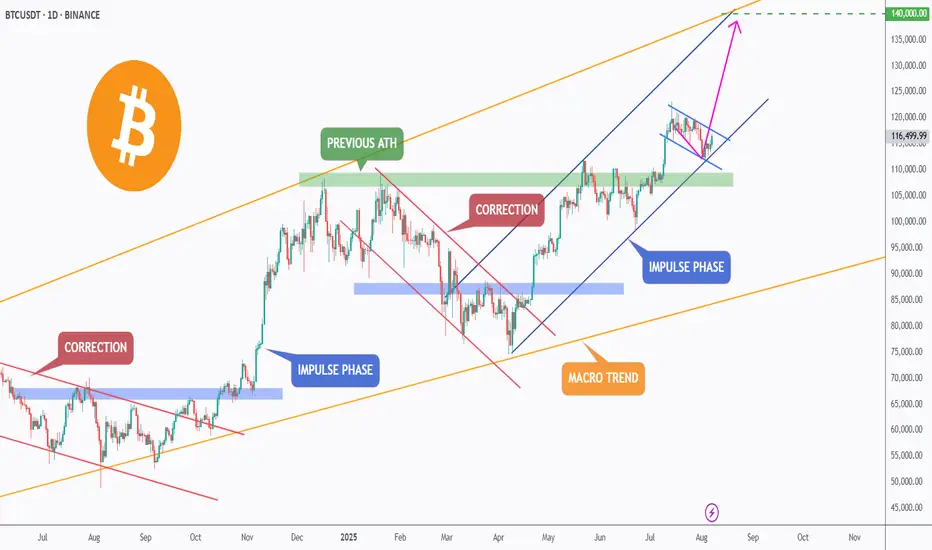
BTC – Breakout Loading?Bitcoin continues to respect its macro bullish trend (🟠), trading within a large ascending channel that has guided price action for over a year.
After breaking above the previous ATH 🟢, BTC entered a correction phase 🔻, retesting the green zone — a key structure now acting as support.
The bulls stepped back in, initiating a new impulse phase 🔵. Currently, BTC is consolidating within a small blue descending channel — forming a classic bullish flag 🏁 pattern.
⚠️ For the bulls to take over and trigger the next impulsive wave toward $140,000 🎯, we need to see a confirmed break above this small blue channel. This would signal trend continuation and open the door to the upper boundary of the macro channel.
✅ Key levels to watch:
- Support: ~$110,000 (green demand zone) 🟩
- Resistance: Top of the blue flag 🟦
- Target: $140,000 💰
A breakout from here could fuel the next major rally — stay sharp and follow the trend!
💬 What’s your bias here? Are you bullish or waiting for a deeper pullback?
📚 Always follow your trading plan regarding entry, risk management, and trade management.
Good luck!
All Strategies Are Good; If Managed Properly!
~Richard Nasr
BTC Retest In Progress – Ready for Liftoff?🚀 Bitcoin has been respecting the long-term rising channel (blue) — moving in clear impulsive 📈 and corrective 📉 waves.
After each bullish leg (highlighted in pink), BTC dips into a correction (red), finds support at key demand zones 🟧, and then kicks off a new rally.
🔥 Currently, BTC is hovering near a strong demand zone around the $110,000–$113,000 area, forming a potential higher low within structure.
If this zone holds, the bulls 🐂 could regain control and push price toward the $130,000–$140,000 range — aligning with the upper boundary of the channel 📊.
💡 Continuation soon?
Let the market decide — we’re watching this zone closely for a bullish breakout confirmation ✅
💬 What’s your bias here? Are you bullish or waiting for a deeper pullback?
📚 Always follow your trading plan regarding entry, risk management, and trade management.
Good luck!
All Strategies Are Good; If Managed Properly!
~Richard Nasr

PALANTIR GOES 'BOMBASTIC', DETHRONES JUGGER BITCOIN SUPERIORITYIt's gone less than a year or so since Palantir stock has joined on Friday, September 20, 2024 Stock Top Club, also known as S&P 500 stock index SPX .
Palantir was one of the strongest contenders for inclusion in the broad market S&P500 Index.
This inclusion, as well as Dell (DELL), came after tech companies Super Micro (SMCI) and Crowdstrike (CRWD) also joined the index earlier in the year 2024.
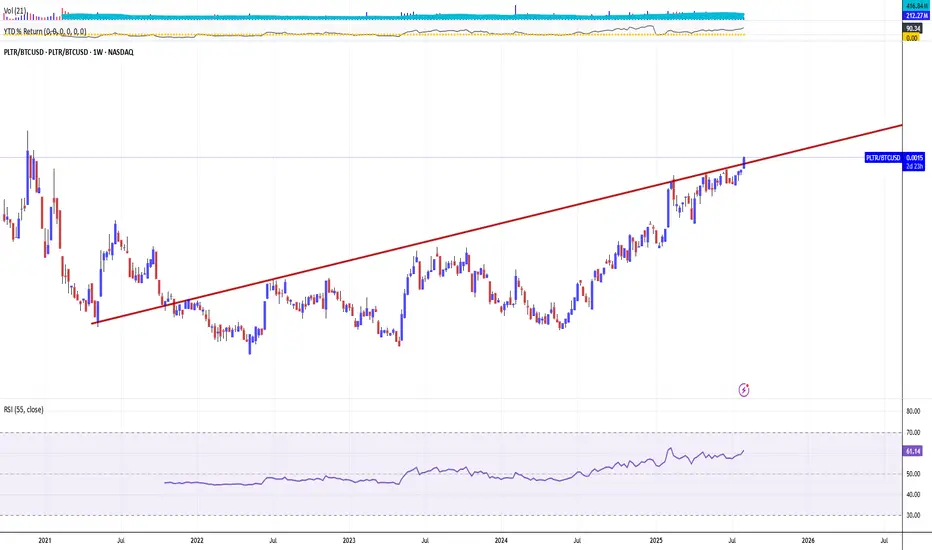
Since that, Palantir stock became the best (i.e. #1) S&P500 index performer the year 2024 and even in nowadays this Jugger remains 'The Best of The Best' over the whole S&P 500 index, with current +127% YTD return in 2025 (and +697% over the past 12 months), being highlighted at 173.29 USD per share - the new all the history peak reached last Wednesday, August 05, 2025 at regular session close.
What is most important also, nor Federal Reserve (The US Central Bank) hawkish projections on monetary policy in 2025, nor bearish were not able to stop the only game in the city, or even make a pause on Palantir leadership.
Since Palantir stock is rallying, the stalkers remain decently far away, swallowing the galactic dust of Palantir shares.
Judge for yourself.
All the nearest pursuers in 2025 are still under 100% YTD return while Bitcoin BITSTAMP:BTCUSD is traded with modest +21% YTD return in 2025.
What is most important also, Palantir stock was able to outperform S&P500 index within 12 (twelve) straight month in a row.
In human words that means, Palantir stock monthly returns (every single month from June 2024 to May 2025) were better against broad market index.
What is Behind this?
On August 4, 2025 Palantir Technologies has announced financial results for the second quarter ended June 30, 2025.
Palantir reported revenue ahead of Wall Street’s expectations in Q2 CY2025, with sales up 48% year on year to $1.00 billion. On top of that, next quarter’s revenue guidance ($1.09 billion at the midpoint) was surprisingly good and 10.5% above what analysts were expecting. Its non-GAAP profit of $0.16 per share was 15.6% above analysts’ consensus estimates.
“The growth rate of our business has accelerated radically, after years of investment on our part and derision by some. The skeptics are admittedly fewer now, having been defanged and bent into a kind of submission. Yet we see no reason to pause, to relent, here.
It has been a steep and upward climb—an ascent that is a reflection of the remarkable confluence of the arrival of language models, the chips necessary to power them, and our software infrastructure, one that allows organizations to tether the power of artificial intelligence to objects and relationships in the real world,” said Alexander C. Karp, Co-Founder and Chief Executive Officer of Palantir Technologies Inc.
Palantir stock Alpha
What is Alpha?
Alpha (a) is a term used in investing to describe an investment's ability to beat (outperform) the market, or its “edge.” Alpha is thus also often referred to as excess return or the abnormal rate of return in relation to a benchmark, or any other asset (even against simple sitting in a cash) when adjusted for risk.
The main graph represents a comparison across Bitcoin and Palantir stocks. Since Palantir outperforms BTC and accelerate right now, so why isn't to continue the play, by staying in a long with Palantir, and finally dethrone "the new oranges" respectively.
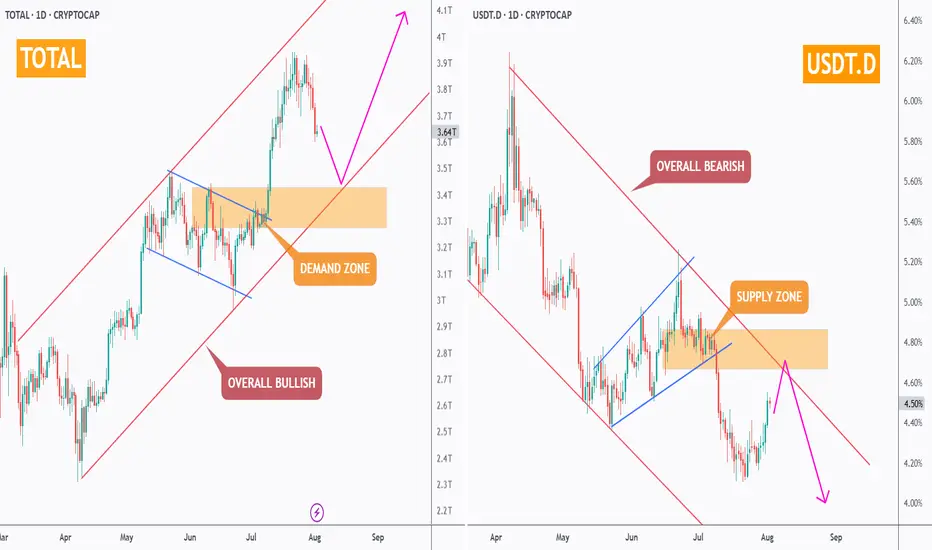
Don’t Panic — It’s Just a Healthy Crypto Correction!While the crypto market has seen some red this week, the bigger picture remains intact. Let’s zoom out and make sense of the current correction.
🔸 TOTAL Market Cap (left chart)
The structure remains overall bullish, trading inside the red rising channel.
After a solid rally, the market is currently pulling back toward a strong demand zone – perfectly aligned with the lower trendline. This area is likely to act as a major support, from which the next bullish impulse could kick off.
🔸 USDT Dominance (right chart)
USDT.D remains overall bearish, trading inside the red falling channel.
It’s currently pushing higher toward a well-defined supply zone, which also intersects with the upper red trendline. As long as this area holds, we expect sellers to take over again — giving altcoins the space they need to bounce back.
📌 In simple terms:
The market is in a healthy correction. Don’t let short-term dips shake your long-term view. The trend is still your friend.
➡️ As always, speak with your financial advisor and do your own research before making any investment decisions.
📚 Always follow your trading plan => including entry, risk management, and trade execution.
Good luck!
All strategies are good, if managed properly.
~ Richard Nasr