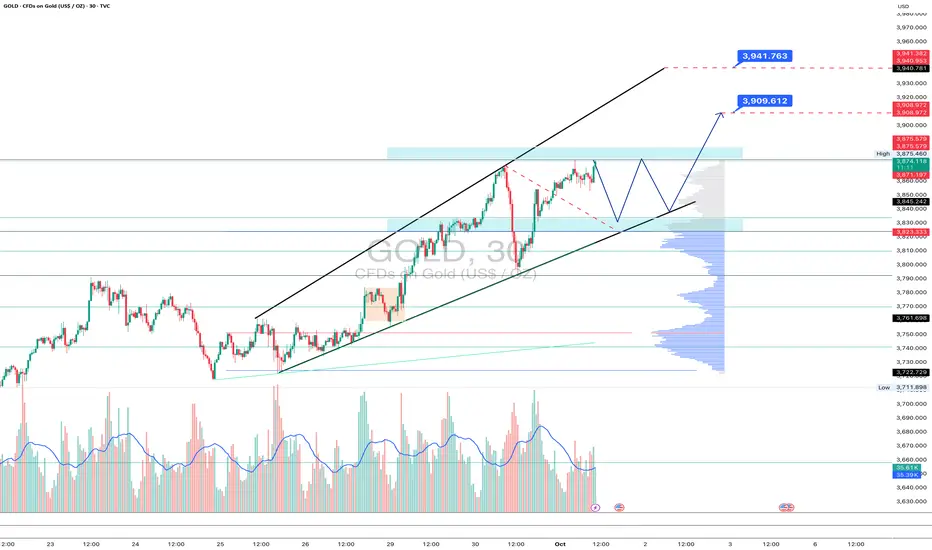
Gold is preparing a pause before a new breakthroughOn the 30-minute chart, gold remains inside the ascending channel but is showing local signs of overheating: price hit resistance around 3875 and pulled back.
The technical setup suggests a correction towards the channel support and the 0.5–0.618 Fibo zone (3833–3823), where buyers are expected to step in. If support holds, the bullish trend may resume with targets at 3909 and 3941.
Volume indicates selling pressure at highs, but the overall trend remains intact - moving averages are pointing upward, and the higher-high structure is still valid.
Tactical plan: watch how the 3833–3823 zone reacts; if buyers confirm control, gold has room for another strong push.
And if bulls rush without giving a pullback - that’s the classic “market never waits for your comfy chair” scenario.
30min
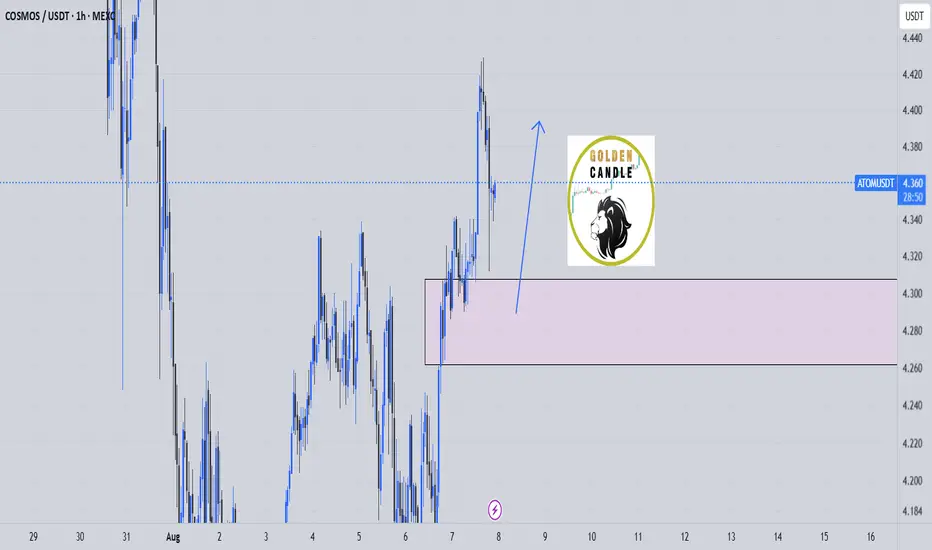
buy midterm atom "🌟 Welcome to Golden Candle! 🌟
We're a team of 📈 passionate traders 📉 who love sharing our 🔍 technical analysis insights 🔎 with the TradingView community. 🌎
Our goal is to provide 💡 valuable perspectives 💡 on market trends and patterns, but 🚫 please note that our analyses are not intended as buy or sell recommendations. 🚫
Instead, they reflect our own 💭 personal attitudes and thoughts. 💭
Follow along and 📚 learn 📚 from our analyses! 📊💡"
buy bch midterm"🌟 Welcome to Golden Candle! 🌟
We're a team of 📈 passionate traders 📉 who love sharing our 🔍 technical analysis insights 🔎 with the TradingView community. 🌎
Our goal is to provide 💡 valuable perspectives 💡 on market trends and patterns, but 🚫 please note that our analyses are not intended as buy or sell recommendations. 🚫
Instead, they reflect our own 💭 personal attitudes and thoughts. 💭
Follow along and 📚 learn 📚 from our analyses! 📊💡"

dydx sell midterm "🌟 Welcome to Golden Candle! 🌟
We're a team of 📈 passionate traders 📉 who love sharing our 🔍 technical analysis insights 🔎 with the TradingView community. 🌎
Our goal is to provide 💡 valuable perspectives 💡 on market trends and patterns, but 🚫 please note that our analyses are not intended as buy or sell recommendations. 🚫
Instead, they reflect our own 💭 personal attitudes and thoughts. 💭
Follow along and 📚 learn 📚 from our analyses! 📊💡"

doge buy midterm"🌟 Welcome to Golden Candle! 🌟
We're a team of 📈 passionate traders 📉 who love sharing our 🔍 technical analysis insights 🔎 with the TradingView community. 🌎
Our goal is to provide 💡 valuable perspectives 💡 on market trends and patterns, but 🚫 please note that our analyses are not intended as buy or sell recommendations. 🚫
Instead, they reflect our own 💭 personal attitudes and thoughts. 💭
Follow along and 📚 learn 📚 from our analyses! 📊💡"

eth buy midterm"🌟 Welcome to Golden Candle! 🌟
We're a team of 📈 passionate traders 📉 who love sharing our 🔍 technical analysis insights 🔎 with the TradingView community. 🌎
Our goal is to provide 💡 valuable perspectives 💡 on market trends and patterns, but 🚫 please note that our analyses are not intended as buy or sell recommendations. 🚫
Instead, they reflect our own 💭 personal attitudes and thoughts. 💭
Follow along and 📚 learn 📚 from our analyses! 📊💡"

30-minute candlestick chart on Gold (XAU/USD)Market Structure Labels:
CHoCH: Change of Character – indicates a shift in trend direction.
BOS: Break of Structure – confirms a continuation in trend direction.
Price Zones:
Supply Zone (Red Rectangle): Price area near the 3,114 level, where selling pressure may exist.
Demand Zones (Blue Rectangles): Areas around 3,052 and 2,950 levels where buying pressure may step in.
EQH (Equal Highs): Indicates potential liquidity resting above that high, possibly a target for price.
Weak Low: Marked below 2,950, suggesting it's vulnerable and may be swept.
Current Price Action:
Price is currently at 3,082, up 3.35% for the session.
A recent CHoCH to the upside, followed by a BOS, suggests bullish intent.
The price appears to be pulling back into a smaller demand zone (~3,064–3,052 area).
Forecasted Move (Blue Arrow):
The trader anticipates a short-term dip into the highlighted demand zone.
After tapping into demand, price is expected to bounce and move back up toward the supply zone, potentially testing or breaking the EQH around 3,114.
Trade Setup (Marked Zone):
Entry Zone: Around the demand area (~3,064–3,052).
Target Zone: Toward the top red zone (~3,114).
Risk Zone: Below 3,052.

CHFJPY SELL SETUPOANDA:CHFJPY Overall bias is bearish. Price making a retest at the daily AOI. Waiting for entry confirmation to go short on CHFJPY.

theta midterm buy "🌟 Welcome to Golden Candle! 🌟
We're a team of 📈 passionate traders 📉 who love sharing our 🔍 technical analysis insights 🔎 with the TradingView community. 🌎
Our goal is to provide 💡 valuable perspectives 💡 on market trends and patterns, but 🚫 please note that our analyses are not intended as buy or sell recommendations. 🚫
Instead, they reflect our own 💭 personal attitudes and thoughts. 💭
Follow along and 📚 learn 📚 from our analyses! 📊💡"

eth midterm range"🌟 Welcome to Golden Candle! 🌟
We're a team of 📈 passionate traders 📉 who love sharing our 🔍 technical analysis insights 🔎 with the TradingView community. 🌎
Our goal is to provide 💡 valuable perspectives 💡 on market trends and patterns, but 🚫 please note that our analyses are not intended as buy or sell recommendations. 🚫
Instead, they reflect our own 💭 personal attitudes and thoughts. 💭
Follow along and 📚 learn 📚 from our analyses! 📊💡"


GBP-USDThe gbp-usd impulse moves downward and now retraces at 50-61.8% fib retracement level. That is mentioned in the chart and the market gets down from the 1.27500 level. If the market respects that level then the market will go down to 1.26800 level.

Nasdaq Analysis Week of May 19th Weekly= Bullish
Daily= Bullish
4H= Bullish
1H= Falling Flag Pattern = Continuation Pattern
30 min & 5 min inverse head & shoulders. Expecting price to respect both patterns and continue up. First TP level around 18664.

GBPUSD 4H Inverted Head & Shouldes4H Inverted Head and Shoulders
30min Inverted Head & Shoulders as well. Expecting a pull back to 1.26180 area before continuing to the upside. Looking for TP area at 1.28000 .

GBPUSD 30m Inverted Head & Shoulders 30m Inverted Head & Shoulder.
Top of pattern is the breakout for another inverted Head & Shoulder on 4h.
See link below.

APTV Short term bearish!NYSE:APTV Has formed a bearish impulse with a healthy correction and a lower degree impulse with a lower degree correction that is breaking out of the larger degree trend line!
This is great confirmation of a trend continuation setup.

GBPUSD SELL IDEAFX:GBPUSD
The weekly, daily and 4h are overall bearish, with price having retraced to the Daily key resistance area in confluence with the 50% Fibonacci retracement level. entry is based on the 1h bearish engulfing candlestick at daily resistance and also a break of bullish countertrend, retest and bearish engulfing candlestick structure on the 15 min and 30 min timeframes


USDCAD SELL IDEAFX:USDCAD
weekly bearish, daily bearish, 4h bullish, 1h bearish, look for sells below 1.34215 as the probability of the daily and weekly continuing its bearish run will be high

gbpcad buy ideaFX:GBPCAD
The daily, 4h and 1h timeframes are bullish and in sync with each other, hence it makes sense to look for buys. Price has come to retest at 1.71010 Daily support. I will be looking to buy at that area should it hold as support during the London session.


usdjpy sell analysisFX:USDJPY
Overall structure based on the daily and 4h is bearish. price broke countertrend structure on the 1h and made a retest to the new resistance area. Entry is based on the bearish engulfing candlestick the the 30 min timeframe
