seeing a nice bounce right at the 1 day 50 maAs I anticipated, we would find support right at the 1 day 50ma...our previous bearflag consolidation had some bullish divergence on the 4hr chart and though it couldnt stop the bear breakdown it indicates that the correction may be close to over...Im thinking the 1 day chart 50 ma (in orange) could certainly be that. Currently we still haven't even touched it...turning around a quarter pip above it like the mob's herd mentality tends to do. I'm thinking we either bounce here, touchdown on the 1day 50ma then bounce back upward, sending a bear wick below the 50ma but inevitably closing above it...or maybe just one more breakdown from here. My limit buy was triggered at 6939 so I"m happy with my trade for now. But if I see the potential head and shoulders (with very little shoulders) look like it may trigger then I amout again until 6.1k -6.2 overall I think we would only see 1-2 more bear breaks downward before we turn back around but the golden cross is dependent on us not closing below the 1 day 50ma
50ma

We have broken down from a bearflag & through a big support liThe old adam and eve neckline we broke up from before was holding very strong support after the bearflag breakdown but could only hold for so long before it gave way. Are next 3 big supports are 7.3k the 4hr 200ma(shown here in blue) the 1 day 50ma and the 7k psychological. The bearflag breakdown target could send us all the way to 6.9 or even upper 6.8k. However I am hopefully that either the 200 on the 4hr chart or the 50 on the 1 day chart will provide us our much needed bounce. if we break under 7.2k however then 6.8-6.9 becomes a real possibility.
BTC weekly looks no goodAfter going to RSI middle, we change the way downward. stay away from long position, it's a new preparing of selling off.

TRX/USD 50-day and 20-day MA crossing?! BULLRUN coming?!There is a bullish indicator going in TRX! if the 50-day MA and the 20-day MA cross then we might have a bullish signal that TRX is going up! For short term I believe we will test that rectangle around 0.03$. Most indicators show bearish signs. Don't think we are going much below the 0.03$ region, since we the support there has been really strong.

Trumps Economy | S&P 500 Analysis | BullishAccording to my technical analysis on the weekly chart using the TD-Sequential Indicators along with the 50 MA (Moving Average) and the 100MA in the purple, we've got a really great chance of a few weeks of some upside. Maybe new all-time highs!!
At the time of this writing, the S&P500 (SPX) is on a green '3' of '9' candle on this weekly chart.
Typically, a perfect setup is what a green '2' closing ABOVE a green '1' candle; Which is exactly what happened here on the weekly chart!
We're finding really good support along the 50MA (in the blue). Every now and then we hit the 100MA (in the purple), but we always bounce off that support line.
There's a lot of uncertainty in the markets because of the tariff battle going on; However, I don't think this is going to really hurt the market much. I'm not a financial advisor, but overall, I'm bullish in this economy.

Currently inside a descending bull pennanthard to say whether we will break to the upside or the downside but we have 2 strong resistance lines directly above it the diagonal yellow on shown here and the 1 week charts 50 ma (not shown here) probably wise to hodl and wait for a clear breakout confirmed by volume before making any moves.

Potentially inside a rising wedge.If this continues to play out this way there is a good probability this wedge could drop the price back down to the support zone of the 4hr 50ma(in orange). Whether or not the 50ma will maintain support if it breaks own tot hat level is the question. Of course we could always break upward too but I won't be confident of that until the 4hr rsi and stochrsi are low enough with the price action close enough to the 4hr 200ma(in blue) and the top trendline of the symmetrical triangle we are in (in pink) to be able to have enough momentum to surpass them both and trigger a breakout. As of now both those indicators could stand to be a little lower before the next upswing. If the upswing happens before they drop, it's very unlikely we will break out of the pink triangle.

$BYOC Breaks out above the Ichimoku Cloud 50MA and Pinched Bolis$BYOC Continues its massive breakout run up after breaking out of the Ichimoku Cloud with 5 consecutive days above the 50MA making higher highs and higher lows. Bolis have also pinched and released on the chart and the 1 Year and 3 Year charts show extreme bullish breakout on technicals. Usually the last few days of the run the shorts were handed the mornings and the longs and bulls took over the afternoons after lunch, that seems to be the case today as the bulls have already stepped in early during lunch to take the reigns and are tapping the ask up.
Over the weekend OTCMarkets was updated to reflect the new share structure which showed a 300 mil reduction of the float and a new website was also posted.
Many catalysts are expected both short term and long term, the next short term catalyst is expected to be audited fins which should drop within the week, after that is an uplistment to OTCQB or the finalization of the first major acquisition worth over $25 Mil in revenues. Many more acquisitions are expected long term as well as an uplistment to the NASDAQ eventually.
Long term PPS target still remains $5+ by this time next year.


NZD/USD updateOk..... SO, look at the correction NU just made on the 1hr and compare that with the daily/weekly and train your eyes to see that. As of now, NU is coming off the 1.236 fib extension in a W-X-Y pattern, which makes sense (which could just be a bullish trend even though corrective looking). However, what doesn't make sense is the the length of the the last wave and the fact that I am use to seeing those do one more to break the high, or an "ending diagonal" if retracement/reversal is ready. I drew up a triple combo scenario which would line up with a higher period moving average cross, at which point we may even have a running flat signifying even more possible bullishness. My point is, it made a w-x-y correction, it was corrective. I don't see a sell setup yet. If it pulls down more it will probably do as my red trend lines say, thus producing a buy setup. Maybe is doesn't reach the 1.618 extension, however, it has to correct the opposite direction before I consider to take the sell down. I want to at least see it break the high it just made, or pull down and then make a bearish flag, then I will consider the sell. Can it sell down from here? Anything is possible, but I am telling you what I see as most likely... Double combo now...possibility of triple combo (even better for entry), until something changes.

$BYOC Triangular Breakout Pattern. Bullish on Daily and Weekly +$BYOC Anticipates an update very soon on the closing of its first acquisition business model, audited fins, and uplistment within the next couple months. In addition several more acquisitions are reported to be in the works for the next fiscal year or more in addition to a possible uplistment to the NASDAQ once everything is completed. Beyond Commerce has been steadily moving the business forward behind the scenes as the stock price has stabilized and has shaped the all too familiar bullish triangular pattern that attract tech traders to a stock. The daily and weekly outlook is bullish with a closing in on breaking back through the Ichimoku Cloud and a break back above the 50MA, both of which imo would drastically push the price back through the cloud within days of the break. Below are extensive DD research that has been done on the stock over the last 9 months.

Ripple Breaks Upward out of Descending TriangleRipple has just broken bullishly up out of the descending triangle it was in, and also well above its 4hr buy sell line. What's more this descending triangle may be the handle of a larger cup and handle pattern which if so would only lead to much more upside in the near future. This looks like a good entry point, but since I've been in for awhile I will simply laddering in more amounts of ripple incrementally.You choose your own strategy and good luck *not financial advice*


NEO/BTC Trading Opportunity NEO is forming an ascending triangle. It is currently getting supported by the 50 day moving average. if the price holds up and the upward trend line holds then we will see a short term upward movement at least to the previous high
around 0.009150 which give you about 13% gain. When the triangle breaks upward we will see more upward movements.
Good Luck!
This is not a financial advice, and please trade at your own risk.
If you like this analysis please hit like so I can publish more analysis in the future.


TRON Key Resistance PointsThe chart says it all.
We need to break key resistance levels marked X, X and get above 50 day MA before we can move higher.
We have strong support marked with green.
Of course for TRON, volume is a must.
For entry & exit points, check/follow the related idea:
Do your own analysis before trading. :)

BTC support resistance and Death CrossAfter death cross, BTC looks no good. New target is about 2500$.

BTC weekly, 20MA, 50MA and MACDAfter going below to zero on MACD, we will go below 50MA accordingly on price.

3 candle closes above the 4hr 50MA Buy/Sell LineIts been a very nice rebound thus far and as you can see on the 4 hour chart we now have 3 candle closes above the ever-important buy/sell line (50MA), renowned technical analyst Steve Primo has often said that once you have 5 closes above the buy sell line you are in a buyers market and 5 closes below puts you in a sellers market, so we only need 2 more closes above this line to be in a buyers market on the 4hr chart. Considering how the T-line(in yellow) has now come up to almost overlap with the Buy/Sell line as a double reinforced support I think the buy sell line maintaining it's support role is highly likely and that we will indeed see 5 closes above the buy sell line on the 4hr chart. Which should finally push us back above the current fib line resistance and likely flip its role from resistance to support as well. I think because of these factors, the bulls will continue their bull impulse up after this brief consolidation....I personally don't think any significant retracement will happen until the next foib line up (in blue) around the big psychological support of 8,000...I expect at that time we will get our first real retracement that isnt just sideways consolidation...that will be a great opportunity for us to see whether or not we will get a higher low...we just recently got our first higher high in awhile and need to confirm that the bulls have taken control from the bears by getting a follow up higher low on the enxt retrace...and then a higher high to go with it on the impulse after that to confirm we are fully back in bull mode....once we can do that, I anticipate the bull surge will be enough to reverse the death cross and trigger a golden cross which should put us into a mega bullish mode and hopefully get us back above the1day charts buy/sell line high enough to get 5 closes back above it and put us fully back in the bull market for the second quarter of 2018. This big bullish domino effect starts first though with us getting our 5th candle close above the 4hr charts buy sell line.

Bull flag beats out bear flag; new higher high established.As you can see we have busted up out of the bull flag and thus also upward out of the bear flag as well...I have posted 2 price targets for a bull flag breakout one that considers the pole of the flg to be just one of the green candles a price point we've already reched...and then another prie point in case the entire bull flags pole was also the long green candle just before that as well. I'm glad to see we've finally gotten a candle above the 50MA buy sell line as well...if we can close 5 consecutive 4 hour candles above the 50MA(in orange) aka the buy sell line...then expect thigns to get very bullish very quick with a domino effect ensuing. We continue to trigger higher climbs the odds are great that we will be reversing the death cross and triggering what's known as the golden cross which would help make things mega bullish. so not only do we have the potential to climb higher just from the bull flag breakout but by breaking out of the bull flag we also broke out of the bigger bear flag which would have an even higher potential climb in store for the price action if that breakout is confirmed which I believe it will be. So for now I'm switching to long I will only switch back to neutral or short if on the enxt retracement we get a lower high or if when we climb back up from the retracement we get a lower low...to confirm the bulls are noe in control after we got this higher high..w.e need the confirmation of then a higher low on the retracement followed b a 2nd confirmation higher high...I'm confident we will get that....this is not financial advise however so you make up your own mind. Thanks for reading!

BTC will remain to below of 200MA for a while..In daily period, BTC goes below to 200MA and DeathCross occured(by intersecting red and green). This picture is not good for the new long position...

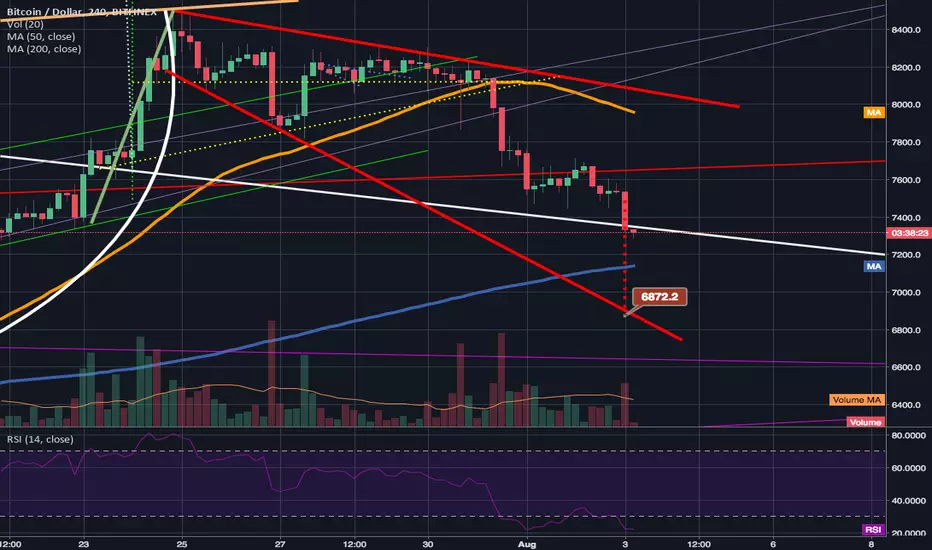
My Limit buy triggered right before the recent upswing.Was able to ride the upward bounce off of the fib after it wicked below jsut enough to trigger my limit buy...I don't anticipate the bears are done yet though...especially since the upcoming 1day chart death cross is still seeming like an inevitability in the coming days. Now that I ahd a successful limit buy triggered I qwill likely put another top loss a few pips below where I originally limit bought back in ensuring that I only sshort again if it goes noticeably and reasonably lower than where wI just bought back in but not too much lower just enough to where a long wick wont cause me to miss the trend reversal. You all do as you see fit as this is not financial advice but as you can see on my chart my limit buy triggered precisely...however this bounce needs a ton of bull momentum to see any real sustainability. If not, and the death cross on the 1 day occurs we could plummet all the way as far down as the ascending grey trendline which I still am confident would provide serious support...however for now I think the biggest downside could be the grey trendline most likely somewhere around the $7200 region my new stop loss will probably be triggered $153 under where I triggered my limit buy. Do as you choose as this is not financial advice! Thanks for reading.

Stop Loss triggered 5 closes below 50MA Nothing to do but short...and maybe reassess when to go long again based on how price reacts at the blue fib line....not a bad idea to set a limit buy way below that, while keeping an eye on how far we dip below the psychological support of 8,000. THis could very well be the results of whales stop loss hunting. So be on the ookout for any sudden boosts of bull volume and momentum to signal a turn around but for now I would be shorting at least until the 161.80% retracement. The 5 closes below the 50MA was the biggest sign...just to be safe I wanted to wait until Iw as below the red line though so I didn't ave my stop loss triggered solely by stop loss hunting whales. It seems with dips like this the death cross on the 1 day chart is an inevitability which means more downside...best to short the market for a little bit and see where this takes us, while being careful to set a smart stop loss buy back in just below the original red stop loss signal just in case it recovers before you can buy back in at the low you want. Factoring in the upcoming death cross I think it will drop farther than the blue retracement line but we will see soon enough.
